

wir0man/iStock via Getty Images
2022 has been a brutal year for investors.
Ycharts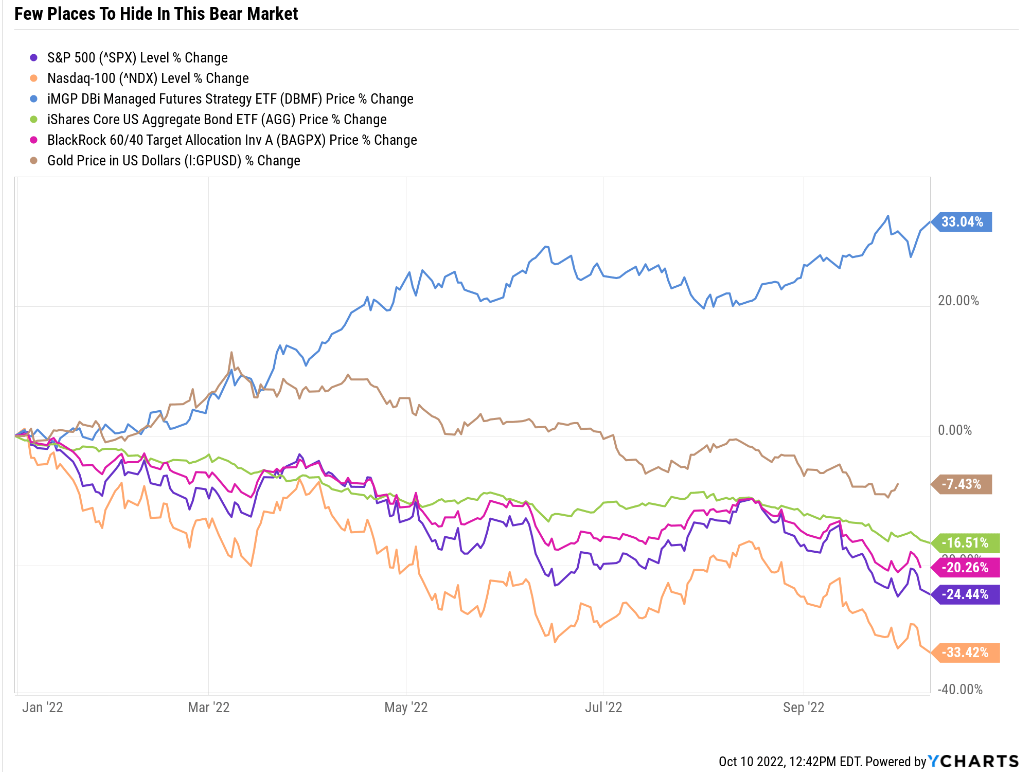
The traditional safe havens, like bonds, have been laid low by the highest inflation in 41 years and the fastest rise in interest rates in four decades.
The traditional stagflation hedge, gold, is down 7%.
And stocks? Well, what do you expect in a bear market?
I’m not going to sugarcoat things for you; the pain that began in 2022 is likely to last into 2023.
Why 2023? Because the Fed has made it clear that if it has to choose between the economy and beating inflation, it will “finish the job” and beat inflation.
But believe it or not, the Fed causing a recession in 2023 is not the worst-case scenario.
Wall Street SAYS it wants the Fed to pivot ASAP. It wants rates to come down yesterday. It wants a return to loose monetary policy and a dovish Fed that lets the economy run hot.
(Source: Ritholtz Wealth Management)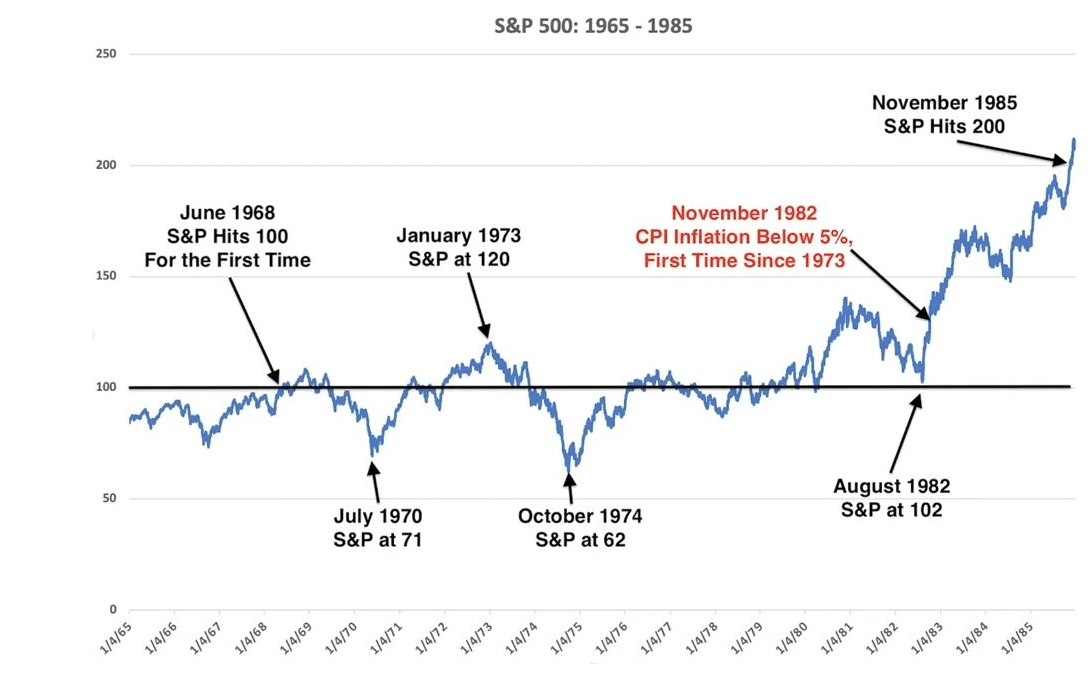
Here’s what happened the last time the Fed gave Wall Street what it said it wanted. Here is what happened the last time the Fed blinked and didn’t “finish the job” of beating inflation.
- four recessions during the great stagflation of the 70s and early 80s
- peak unemployment of 11% (worse than the Great Recession)
- three bear markets (including a 54% crash)
- the Dow was flat for 16 years
- inflation kept rising steadily all decade (an average of 7% in the 1970s)
- inflation peaked at 15%
- interest rates peaked at 20%
- long-term interest rates peaked at 16%
- home mortgages peaked at 18%.
If you think we have it bad today, this is the kind of stagflation hell that UBS and Societe Generale warn us could be coming if the Fed pivots too early.
- a 53% peak stock market decline
- a market that bottoms in 2 years from now
- a lot more misery than a 6 to 9-month mild recession that BAC and Deutsche Bank now expect next year
- 80% of CEOs according to Bloomberg expect a MILD recession in 2023.
Ben Carlson 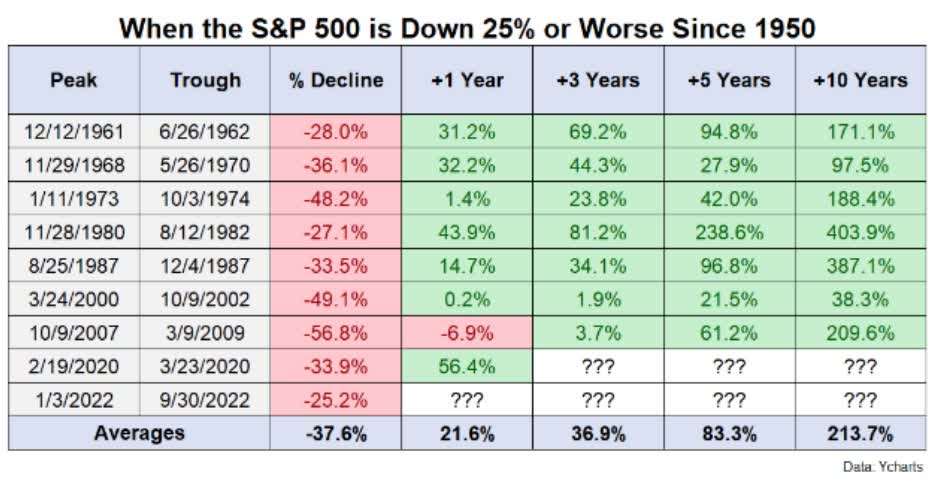
If the Fed beats inflation quickly, then investors face a decade of strong gains after a few years of pain.
If the Fed blinks too quickly? Then we have to be prepared for a potential lost decade.
If you think retirees are scared about their retirements today? A decade (or more) of stocks going nowhere combined with 3%, 4%, or even 5% inflation would be a waking nightmare from which there would be no escape.
Are things going to suck in 2023, the year of the likely market bottom and capitulation? Of course. By definition, capitulation means the temporary death of investor hope, a peak in despondency and despair.
The good news? As soon as it’s clear that the economy is entering a recession and inflation is coming down, long bonds are likely to be the best safe haven asset, as they have been 92% of the time since WWII.
That means there will be places to hide once more for those with balanced portfolios.
- long bonds and managed futures are historically the best hedges
- with positive long-term returns, AND they tend to go up in most bear markets.
My goal for my readers and Dividend Kings’ subscribers isn’t to lie to you. I’m not going to blow smoke up your butt and tell you that undervalued blue-chips are going to go up in a bear market.
- defensive low volatility blue-chips do their job by falling less
- bonds and managed futures are the assets that go up.
My job is to give it to you straight and prepare you emotionally, financially, and even spiritually (it’s going to be an exhausting ordeal for many) for the coming pain.
But when the pain is over, then the bull market begins, and market hell morphs into market heaven.
That’s the true light at the end of the tunnel, and that’s where the 10 best REITs for this recession can help.
Help you sleep well at night in this recession and make it past the valley of doom and despair to the golden mountain top of long-term income and generous and safe income.
REITs: Historically A Great Source Of Safe Income In Recessions
Outside of the Great Recession, when high leverage and an imploding credit market caused most real estate investment trusts (“REITs”) to cut their dividends, REITs tend to be a great way to enjoy safe and growing income in all economic conditions.
JPMorgan Asset Management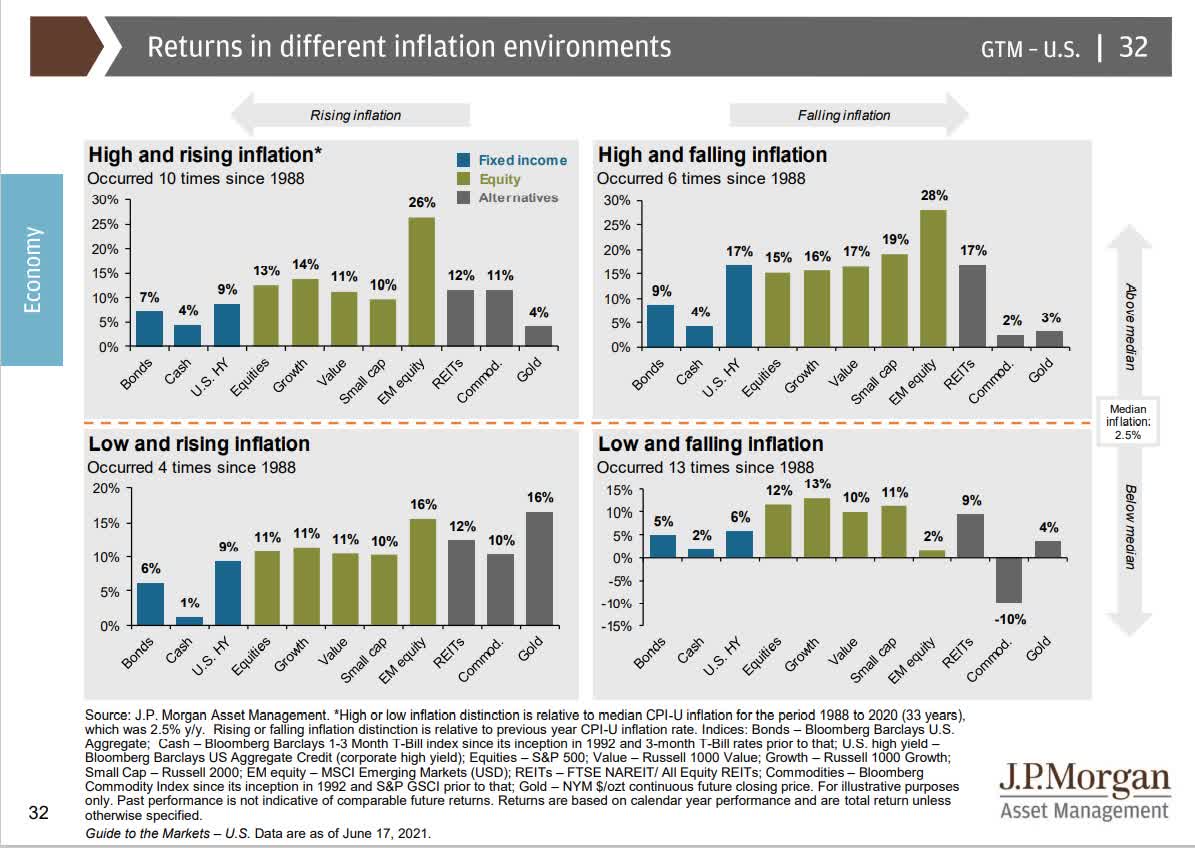
In fact, REITs tend to be a great inflation hedge outside of the actual bear markets (when almost no stocks go up).
Daily Shot 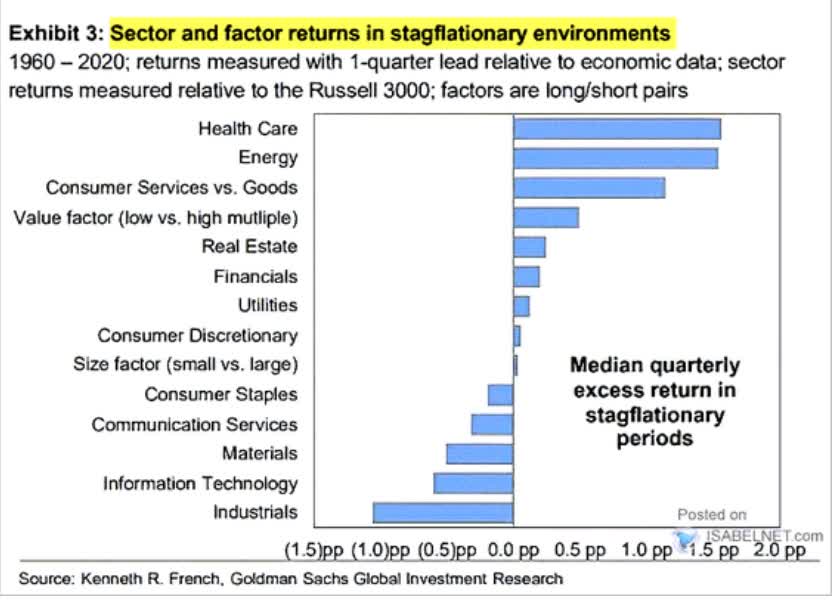
Even during stagflationary periods, REITs tend to outperform the market (though by falling less than the broader market).
- REITs raise rents on tenants and thus cash flow and dividends growth in high inflationary times
But just as with any sector or asset class, safety and quality are essential if you want to sleep well at night and pay the bills during a recession.
How To Find The 10 Best Recession REITs…In 2 Minutes
For every article, I use the Dividend Kings Zen Research Terminal to screen for the best combination of blue-chips for any goal, time horizon, and risk profile.
Let me show you a quick and easy screen for the 10 best REITs you can safely buy in this recession.
We currently have about 40 REITs in the DK 500 Master List and are adding another 40 or so in the coming months.
- the top 33% of U.S. REITs by safety and quality per the iREIT iQ quality model
Finding The Top 10 REITs For This Recession
| Step | Screening Criteria | Companies Remaining | % Of Master List |
| 1 | Reasonable Buy, Good Buy, Strong Buy, Very Strong Buy, Ultra Value Buy (Never Overpay For Stocks) | 411 | 81.55% |
| 2 | Sector “REIT” | 37 | 7.34% |
| 3 | Sort by quality, top 10 | 10 | 1.98% |
| 4 |
Using the “Watch list” feature to create a watchlist of these 10 highest quality REITs |
||
| Total Time | 2 minutes |
(Source: Dividend Kings Zen Research Terminal)
This takes almost no time at all, and just take a look at the results.
The 10 Best REITs You Can Buy For This Recession
(Source: Dividend Kings Zen Research Terminal)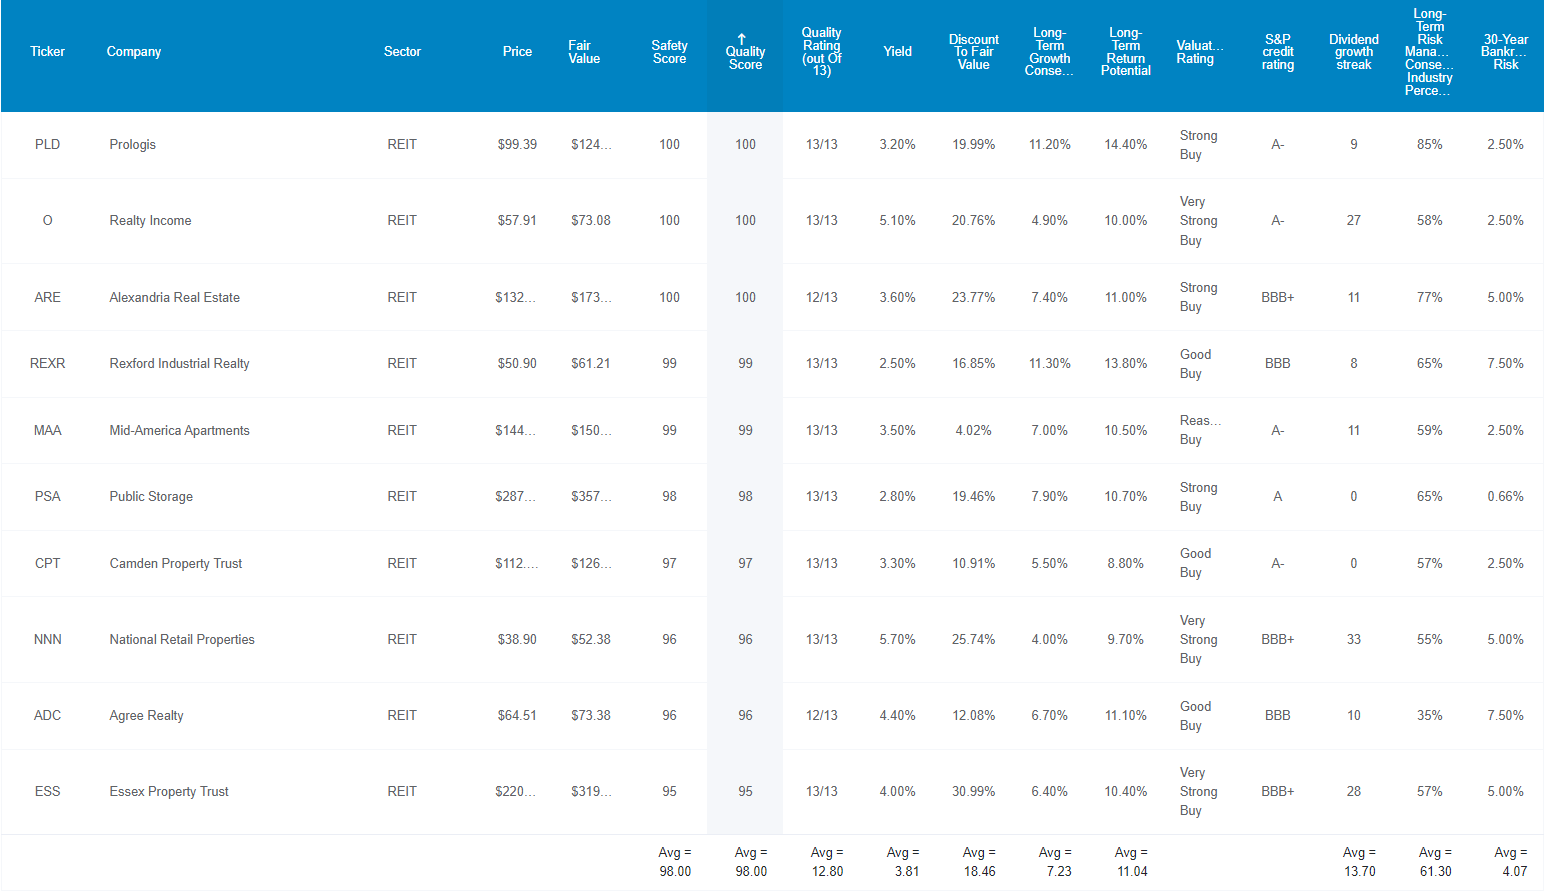
I’ve linked to articles exploring each REIT’s investment thesis and growth outlook courtesy of Brad Thomas, Dividend Kings’ co-founder and Seeking Alpha’s REIT guru.
Here they are in order of highest to lowest quality, according to iREIT’s quality model.
- Prologis (PLD) – industrial
- Realty Income (O) – triple-net-lease/retail
- Alexandria Real Estate (ARE)- bioscience office buildings
- Rexford Industrial Realty (REXR) – industrial
- Mid-America Apartment (MAA) – apartments
- Public Storage (PSA) – storage
- Camden Property Trust (CPT) – apartments
- National Retail Properties (NNN) -triple-net-lease/retail
- Agree Realty (ADC) triple-net-lease/retail
- Essex Property Trust (ESS) – apartments
FAST Graphs Up Front
Prologis 2024 Consensus Total Return Potential
(Source: FAST Graphs, FactSet) 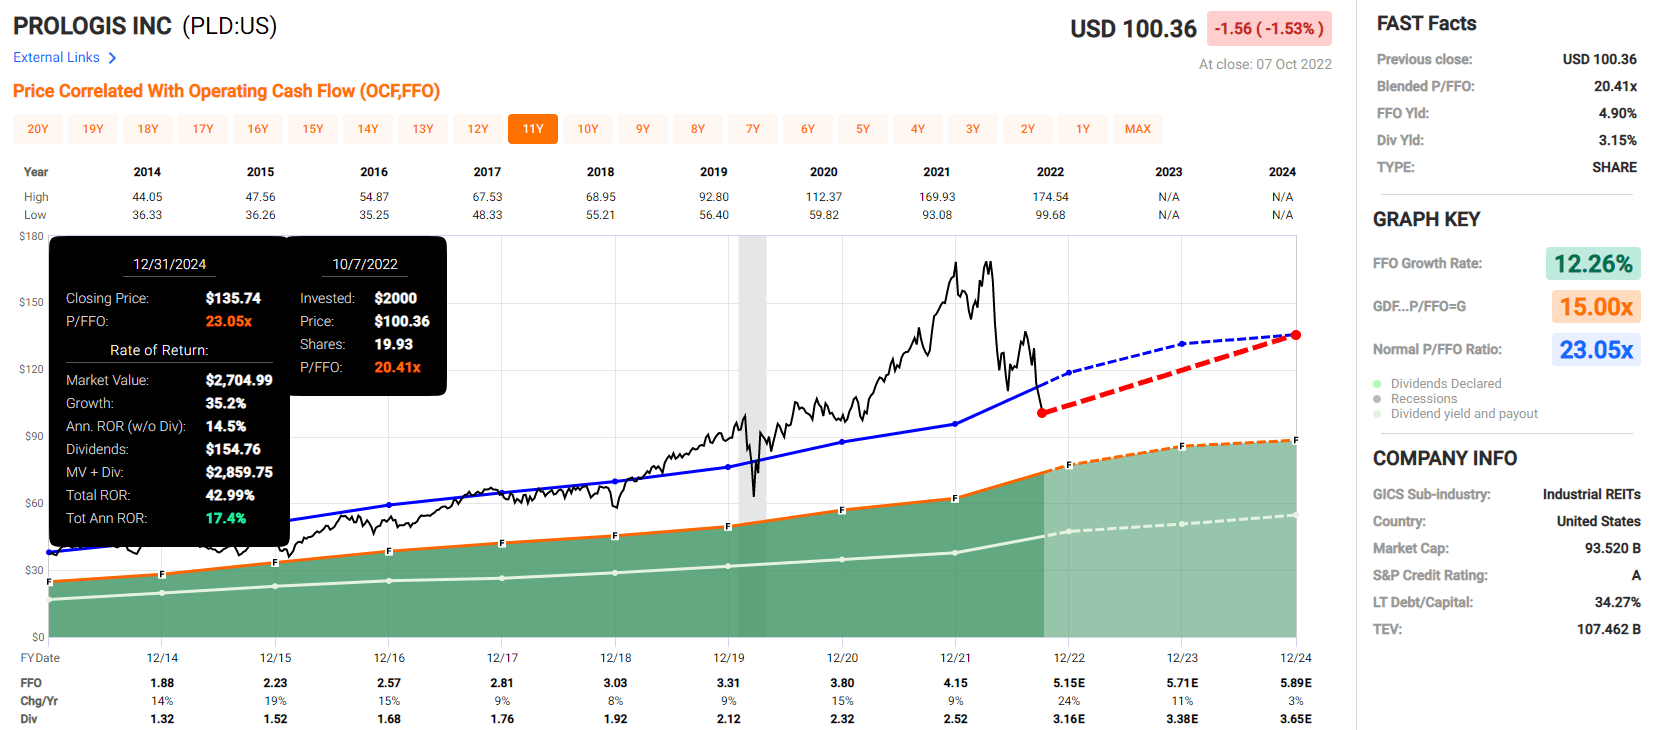
Realty Income 2024 Consensus Total Return Potential
(Source: FAST Graphs, FactSet)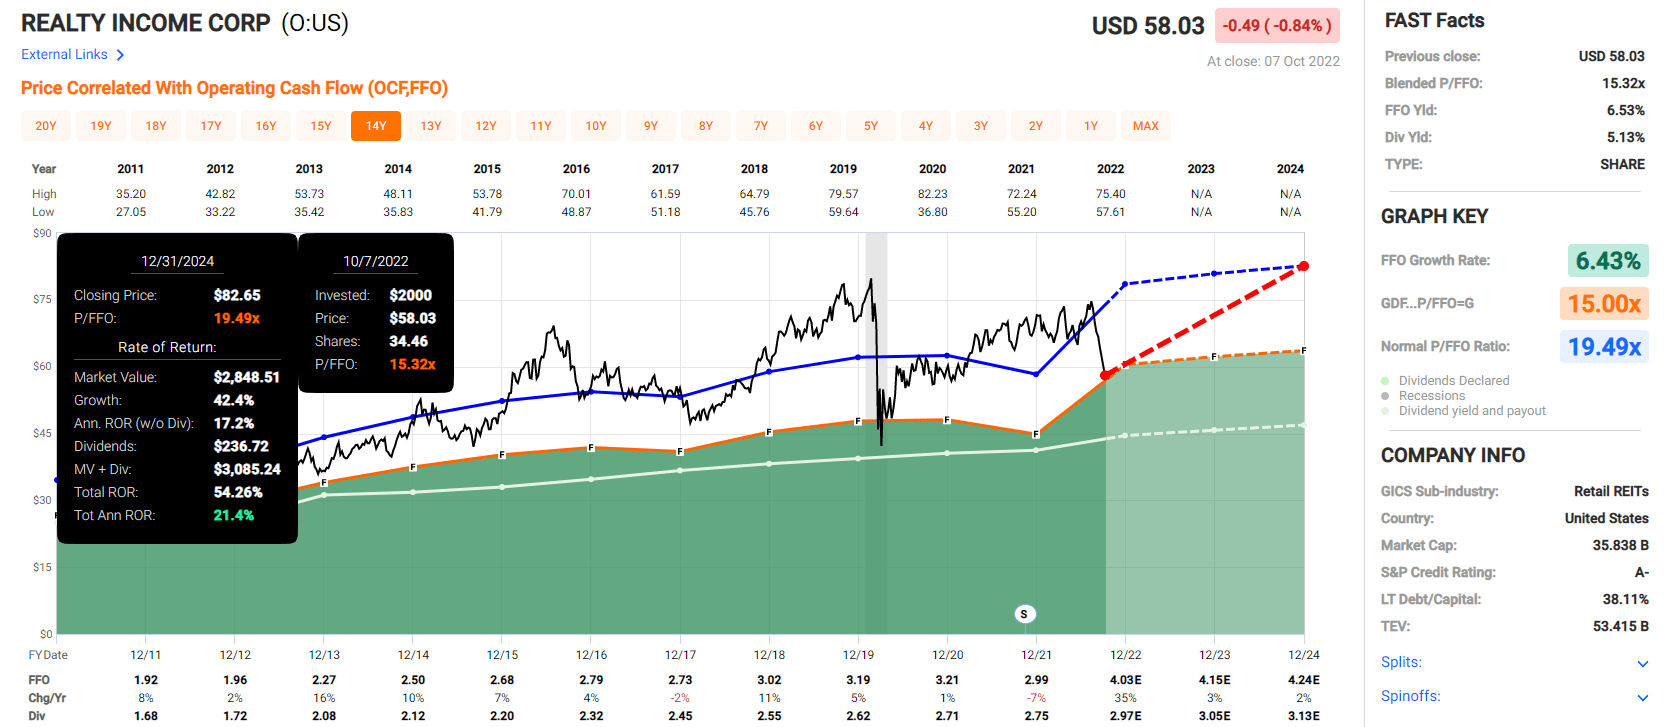
Alexandria Real Estate 2024 Consensus Total Return Potential
(Source: FAST Graphs, FactSet)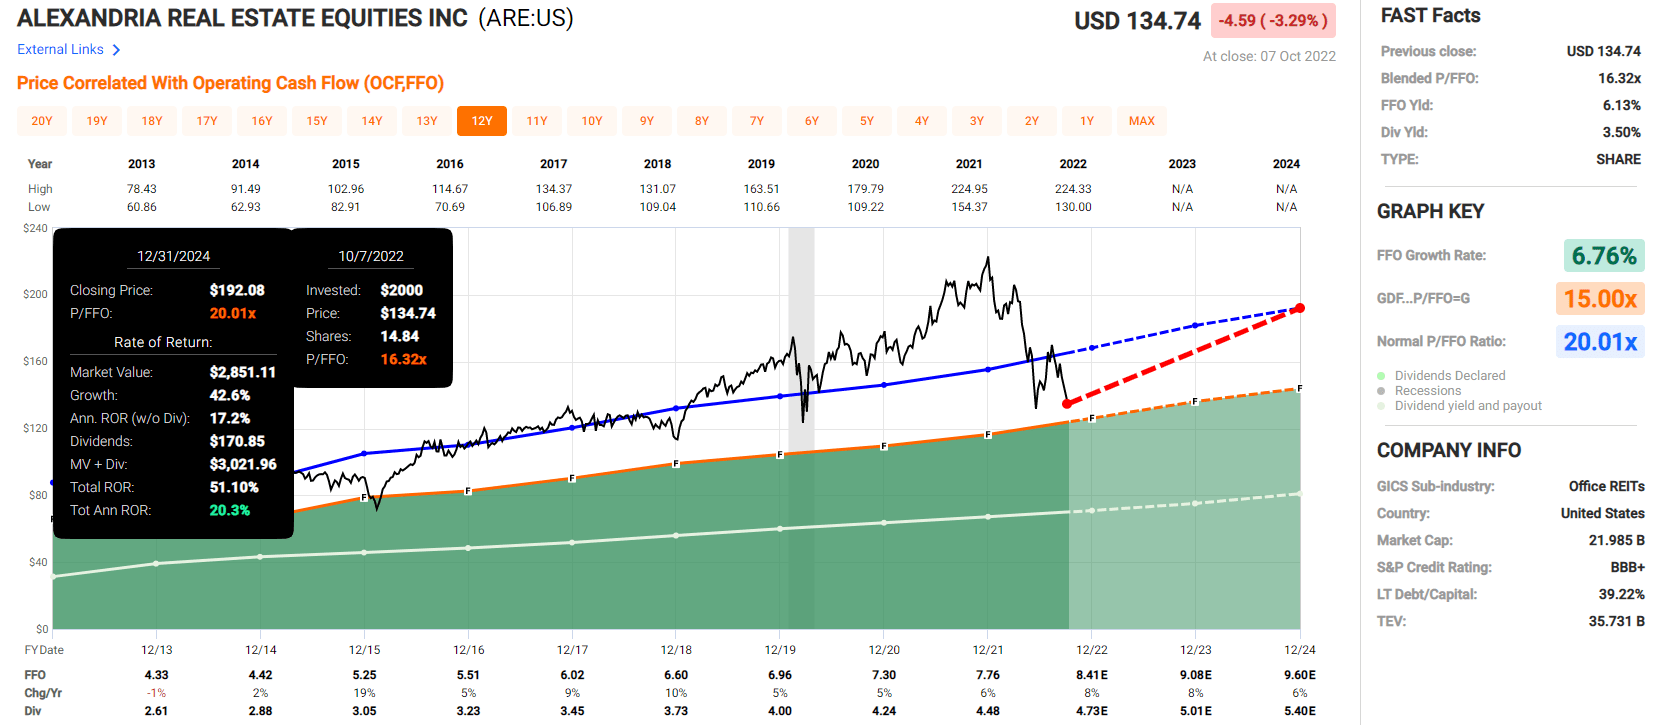
Rexford Industrial 2024 Consensus Total Return Potential
(Source: FAST Graphs, FactSet)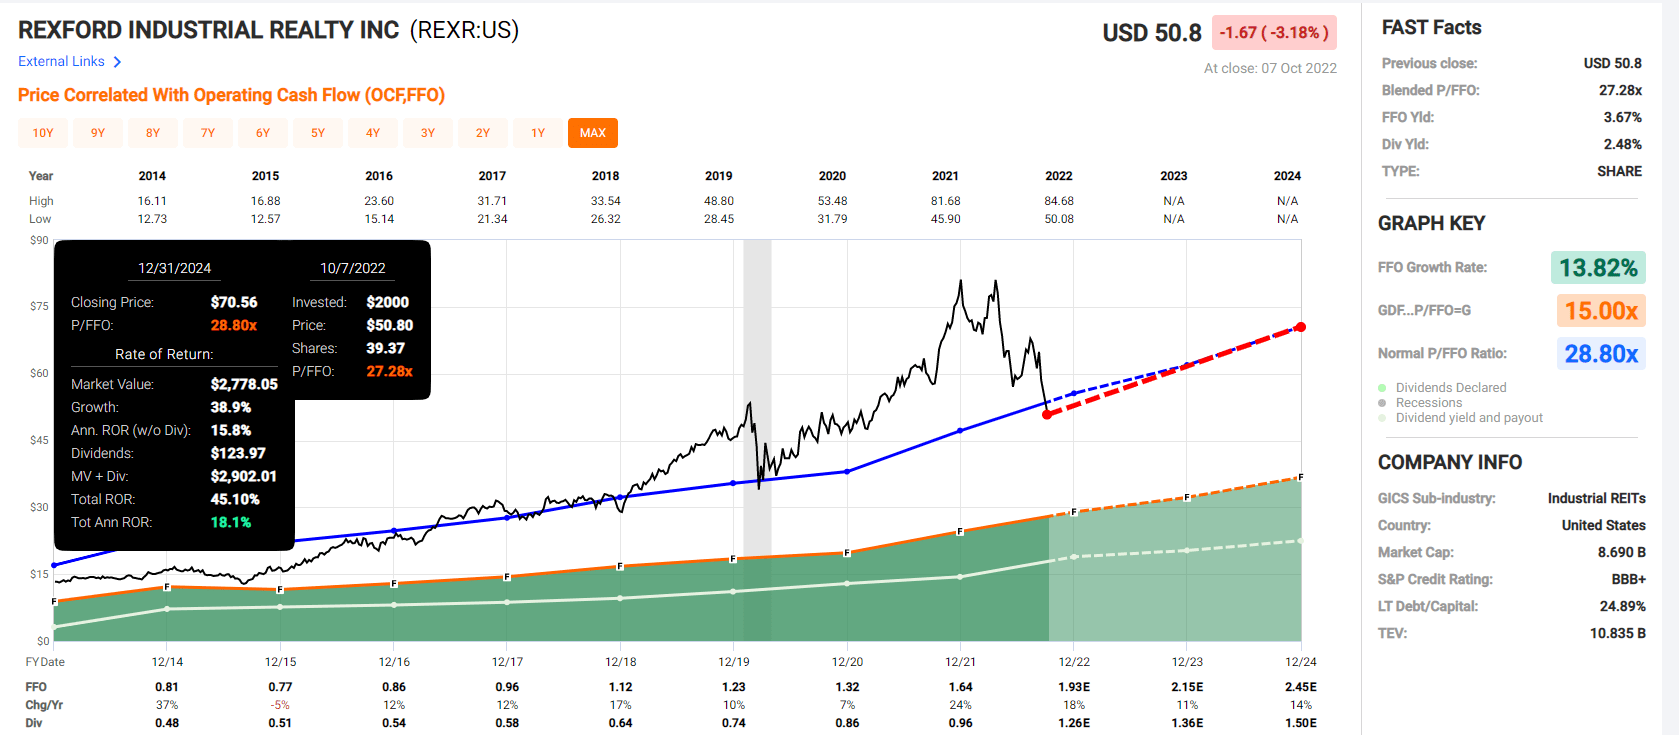
Mid-America Apartment 2024 Consensus Total Return Potential
(Source: FAST Graphs, FactSet)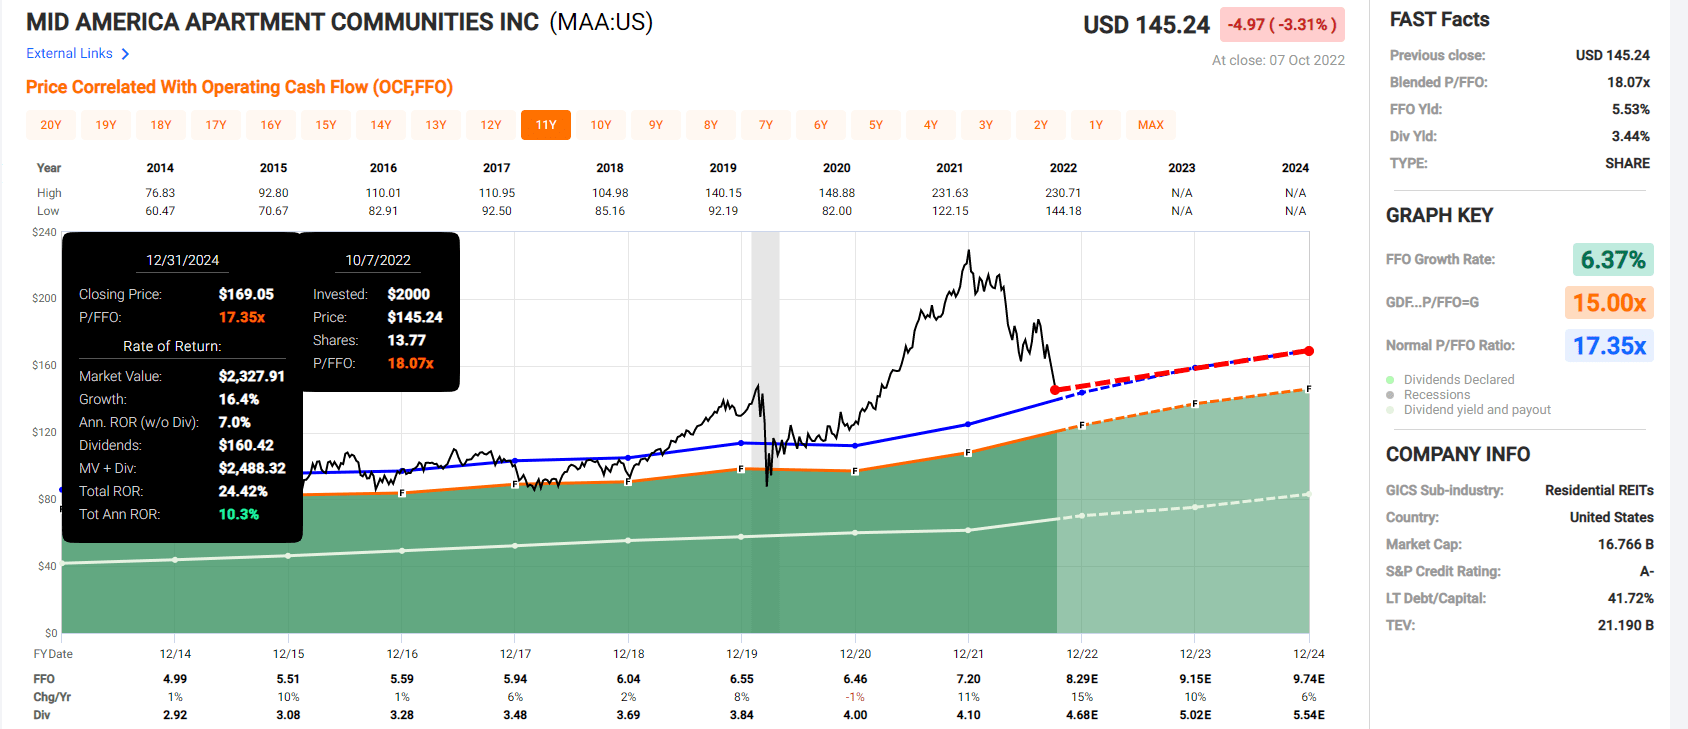
Public Storage 2024 Consensus Total Return Potential
(Source: FAST Graphs, FactSet)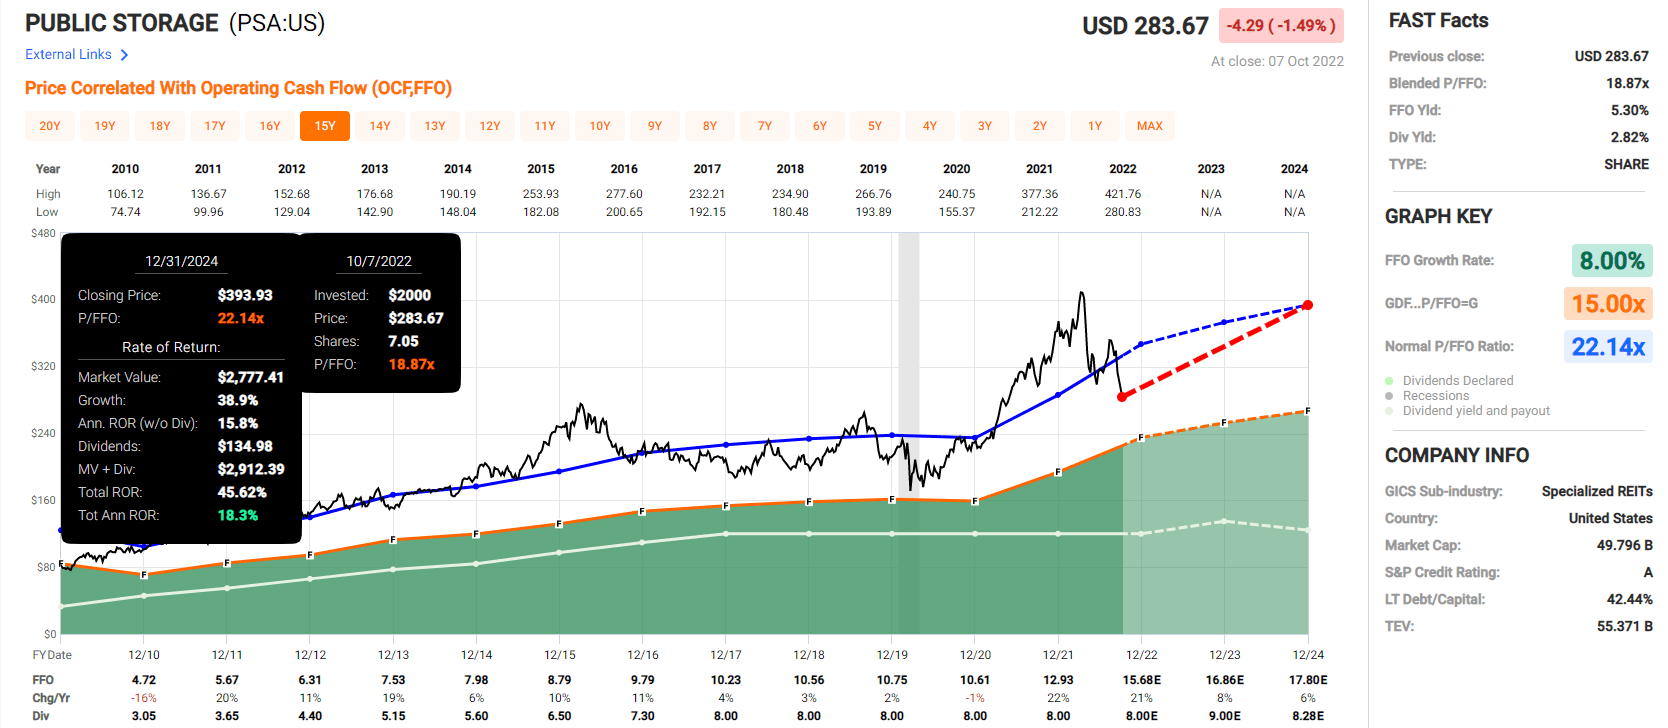
Camden Trust 2024 Consensus Total Return Potential
(Source: FAST Graphs, FactSet)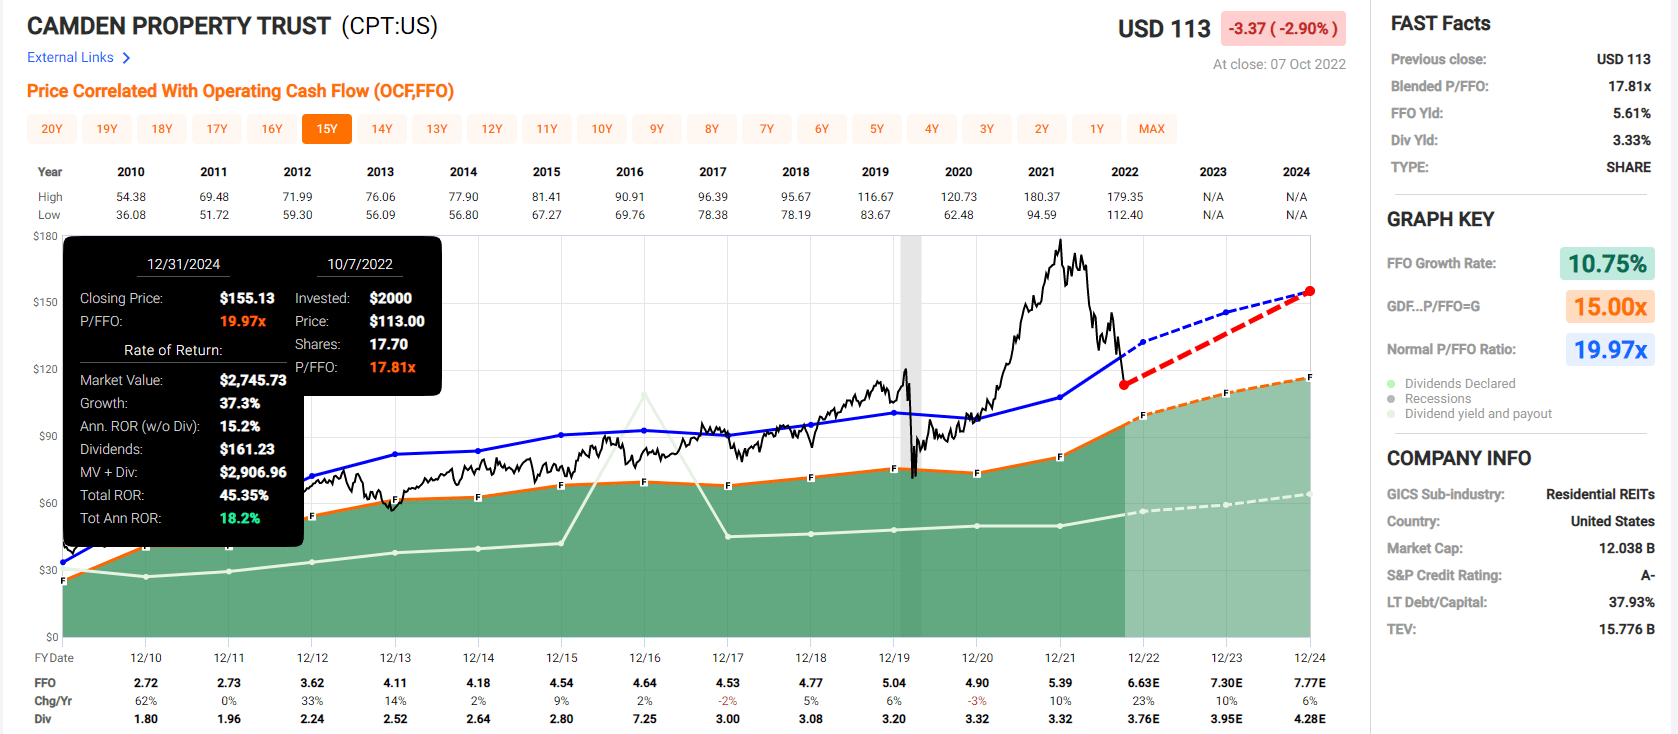
National Retail 2024 Consensus Total Return Potential
(Source: FAST Graphs, FactSet)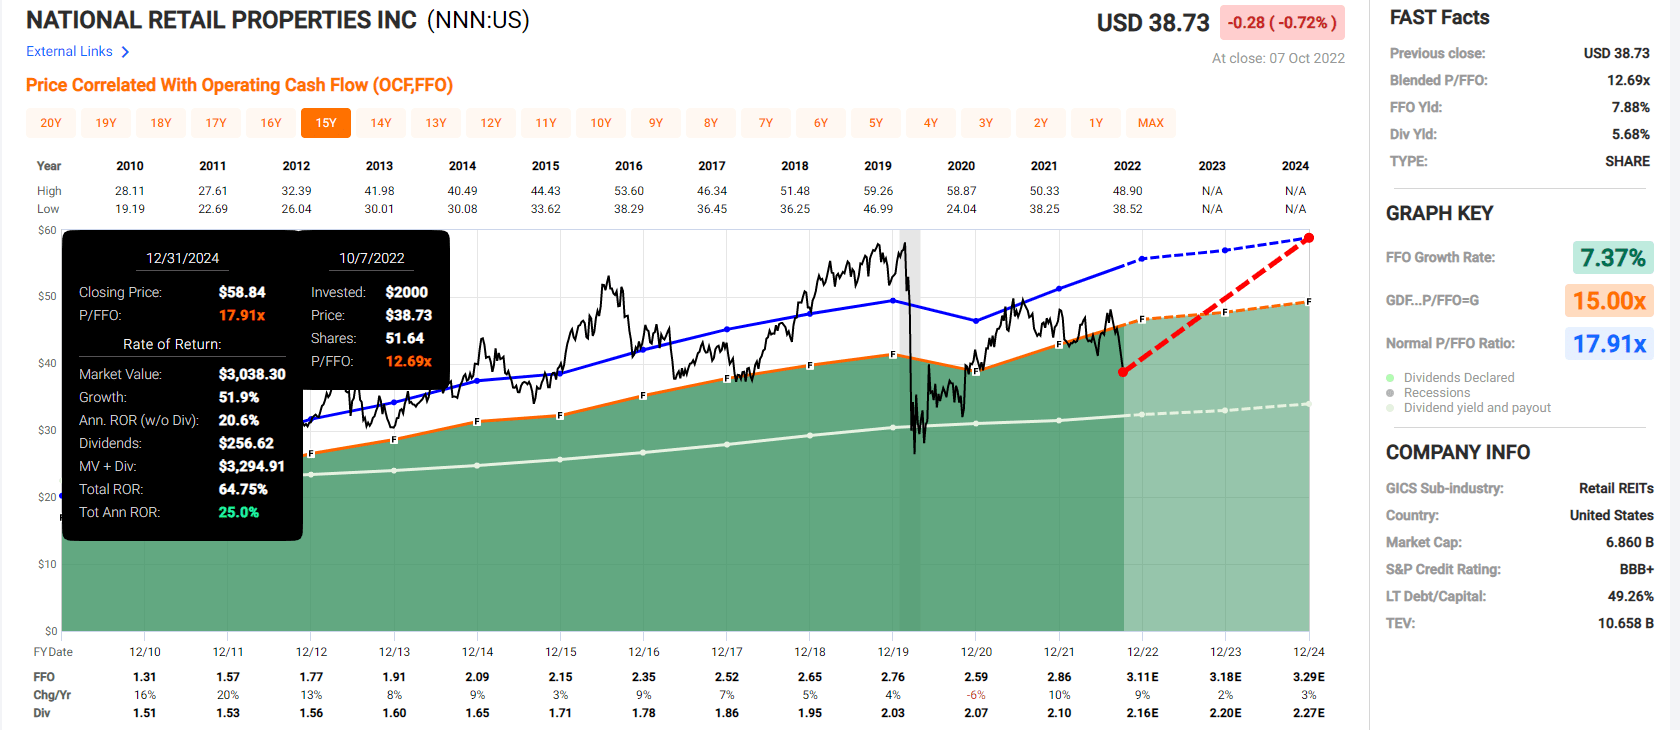
Agree Realty 2024 Consensus Total Return Potential
(Source: FAST Graphs, FactSet)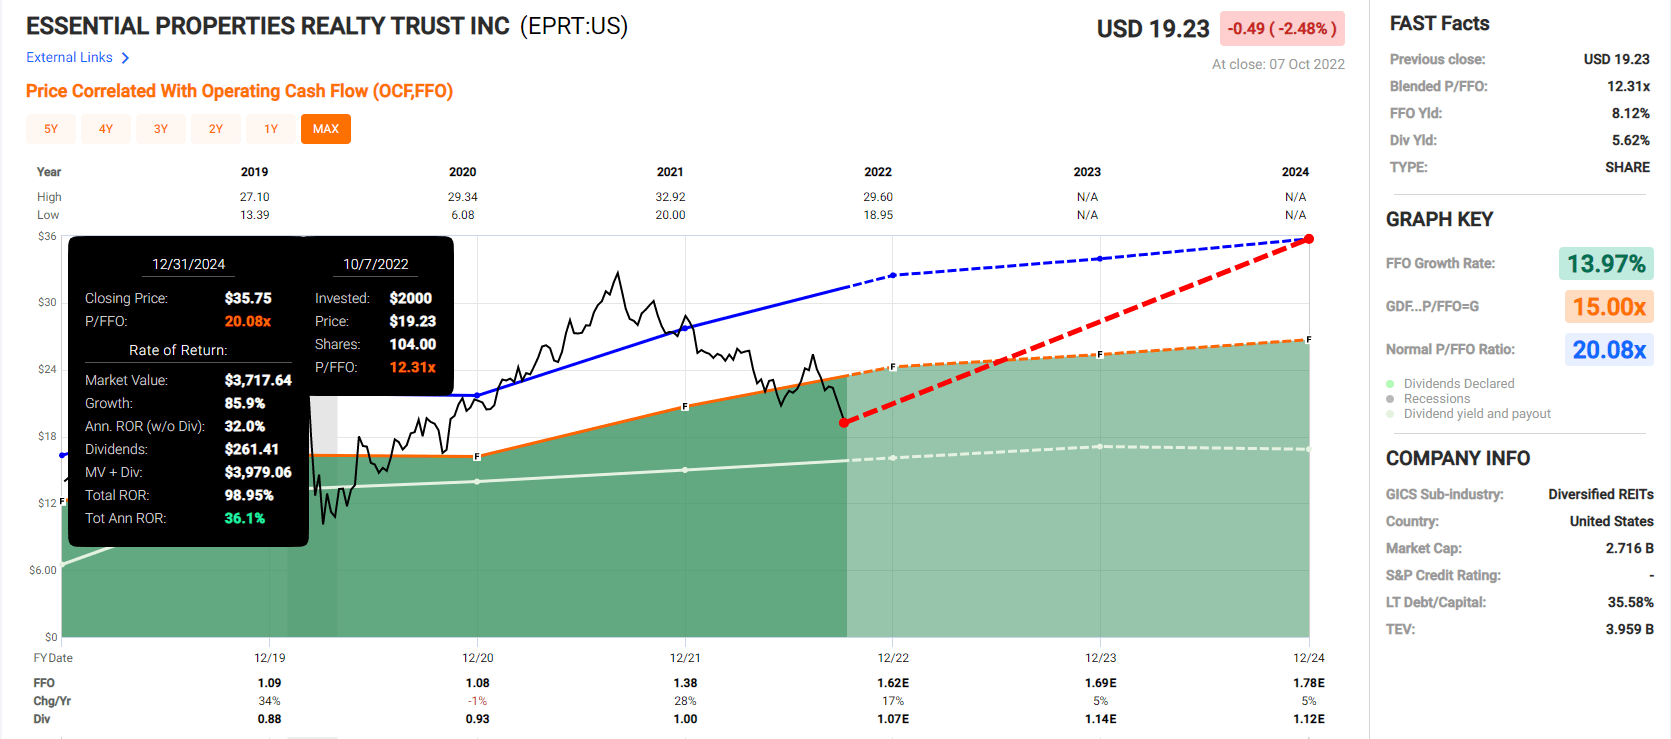
Essex Property 2024 Consensus Total Return Potential
(Source: FAST Graphs, FactSet)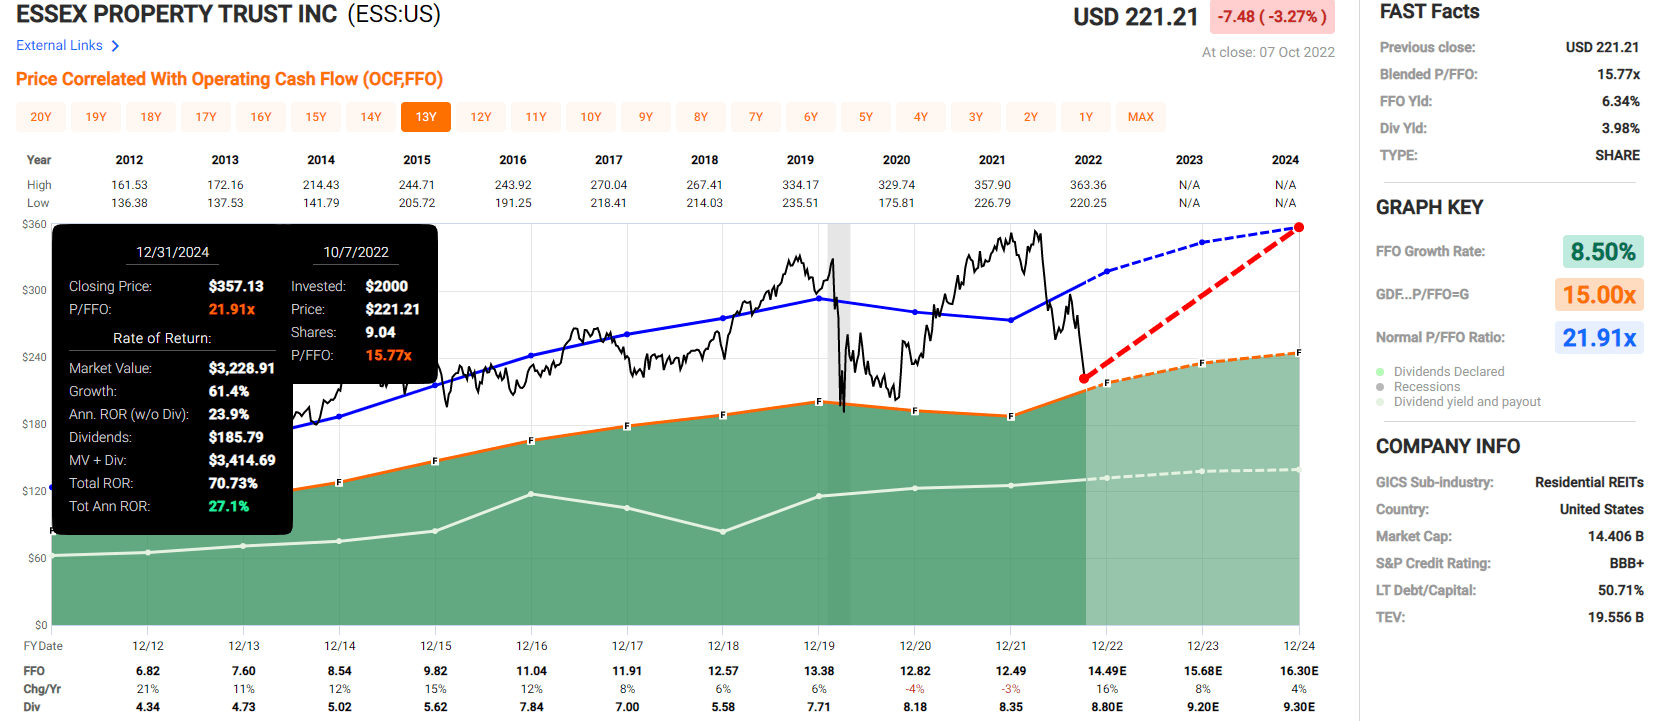
The average 2024 consensus return potential is 21.0% CAGR, or a 54% consensus total return potential over the next 2.25 years.
But I’m not just trying to help you potentially earn Buffett-like returns from America’s greatest REITs; I want to show you how the best REITs can help you achieve your rich retirement dreams in all economic conditions.
Why These Are America’s Best REITs
(Source: Dividend Kings Zen Research Terminal)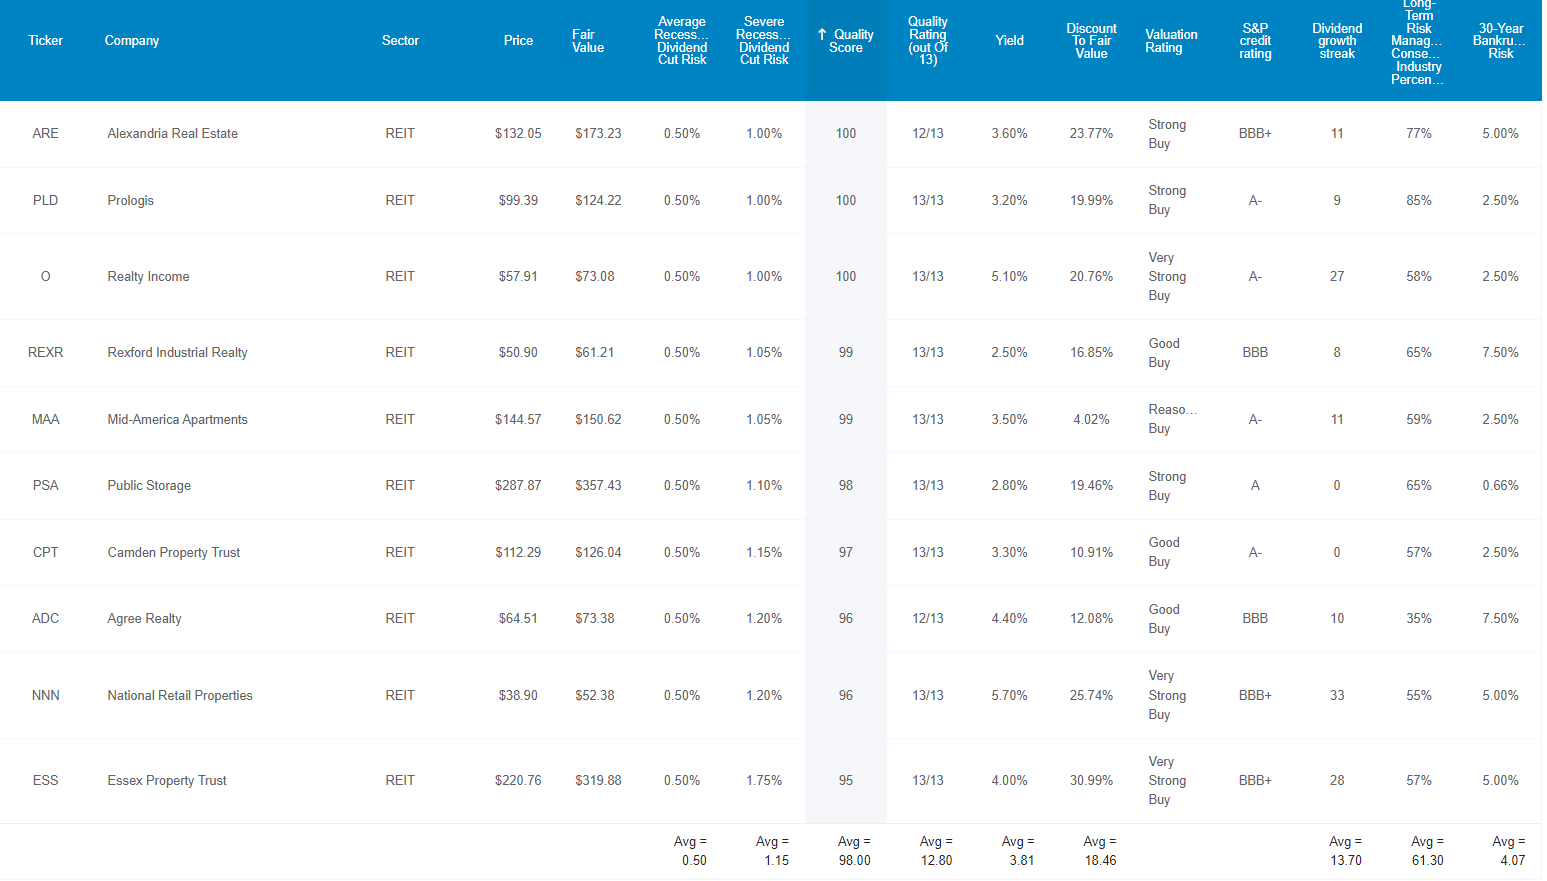
The difference between the best REITs and average REITs is the difference between Ultra SWAN (sleep well at night) quality and merely “good enough” quality.
In a recession, safety and quality are like cash; you can never have too much.
Let’s compare how these top 10 REITs compare to the average DK Master List REIT.
Safety And Quality You Can Trust In This And All Future Recessions
| Metric | 10 Best Recession REITs | Average DK Master List REIT |
Compared To DK REIT Average |
| Quality | 98% | 86% | 114% |
| Average Recession Dividend Cut Risk | 0.5% | 0.5% | 100% |
| Severe Recession Dividend Cut Risk | 1.1% | 1.7% | 65% |
| Dividend Growth Streak (Years) | 13.7 | 10.4 | 132% |
| Long-Term Risk Management Industry Percentile | 61% | 60% | 102% |
| Average Credit Rating | BBB+ Stable | BBB Stable | NA |
| Average Bankruptcy Risk | 4.07% | 7.78% | 52% |
| Forward P/FFO | 17.3 | 15.4 | 112% |
| Discount To Fair Value | 19% | 22% | 86% |
| DK Rating | Strong Buy | Strong Buy | NA |
| Yield | 3.8% | 4.9% | 78% |
| LT Growth Consensus | 7.2% | 6.9% | 105% |
| Total Return Potential | 11.0% | 11.8% | 94% |
| Risk-Adjusted Expected Return | 7.4% | 7.9% | 94% |
| Inflation & Risk-Adjusted Expected Return | 5.1% | 5.7% | 91% |
| Conservative Years To Double | 14.0 | 12.7 | 110% |
(Source: Dividend Kings Zen Research Terminal)
The Dividend Kings Master List is already curated for the highest quality REITs (and we are constantly replacing lower quality companies with higher quality ones to keep improving it).
- Our average REIT is 11.8/13 Super SWAN quality
- similar in quality to the average dividend aristocrat.
And even among the best blue-chip REITs in the country, these top 10 recession REITs stand out with:
- 14% superior quality
- 35% lower severe recession dividend cut risk
- a 32% longer dividend growth streak
- half the 30-year bankruptcy risk, according to S&P
- a similar 19% discount to historical fair value
- attractive almost 4%, very safe yield
- solid market-beating 11% CAGR long-term return potential
- low-risk above-average long-term risk management (according to 7 risk rating agencies like S&P, Moody’s, MSCI, and Morningstar).
They average a BBB+ stable average credit rating, compared to BBB for the average DK Master List REIT.
So now that you understand what makes these top 10 REITs so special, here is why you might want to buy some of them today.
Wonderful REITs At Wonderful Prices
(Source: Dividend Kings Zen Research Terminal) 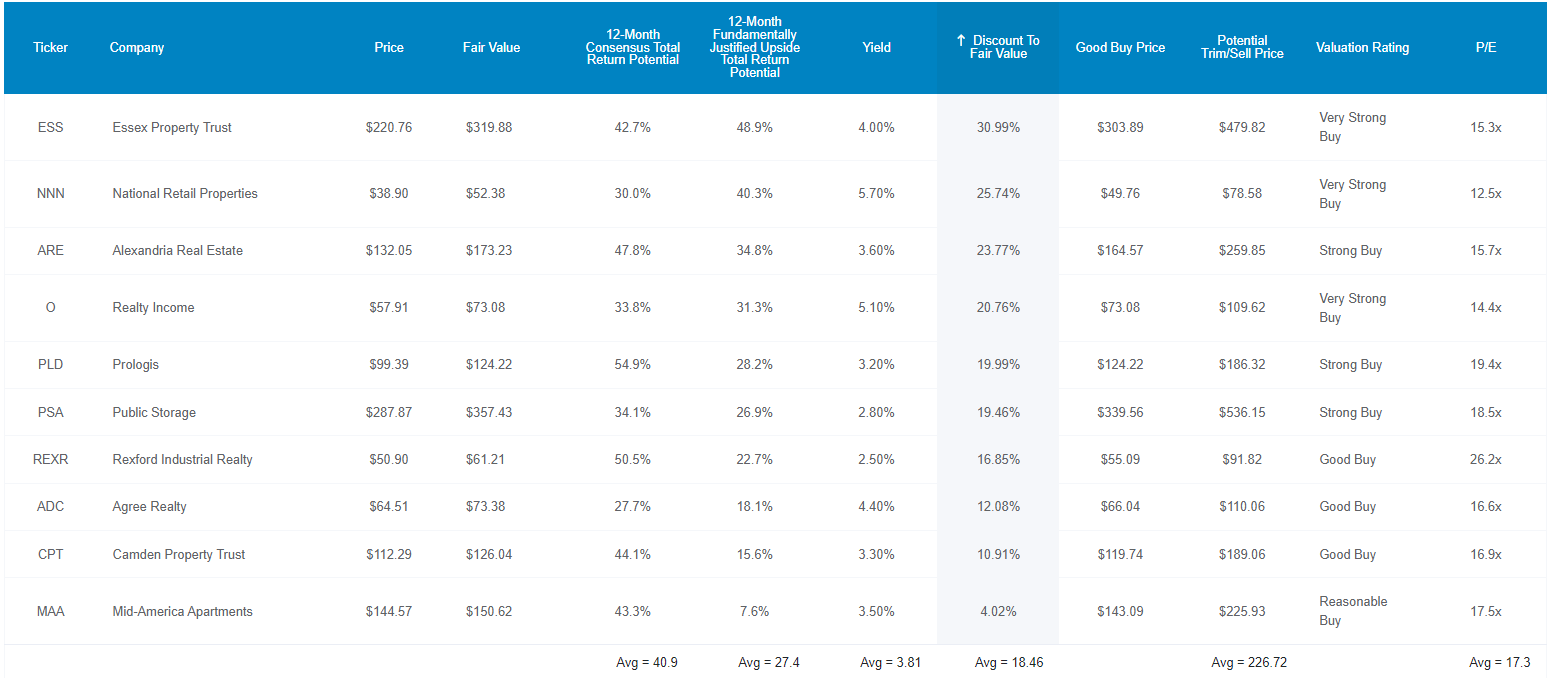
For context, the REIT sector average P/FFO is 18.9 over the last decade, and these top 10 recession REITs are trading at 17.3X right now.
The REIT Sector is 26% undervalued right now, while the top 10 highest-quality REITs are 19% historically undervalued.
Analysts expect 41% total returns within 12 months, while 27% 12-month returns would be justified by their fundamentals.
- If they all grow as expected and return to historical mid-range fair value within one year you earn 27%.
For Ultra SWAN quality REITs like these, a 19% discount isn’t just a potentially good buy; it’s a potentially strong buy.
But my goal isn’t to help you earn 27% in a year or even 41%, as analysts expect. I want to help you achieve life-changing income and wealth over decades so you can retire in safety and splendor.
REITs That Can Help You Retire Rich
(Source: Dividend Kings Zen Research Terminal)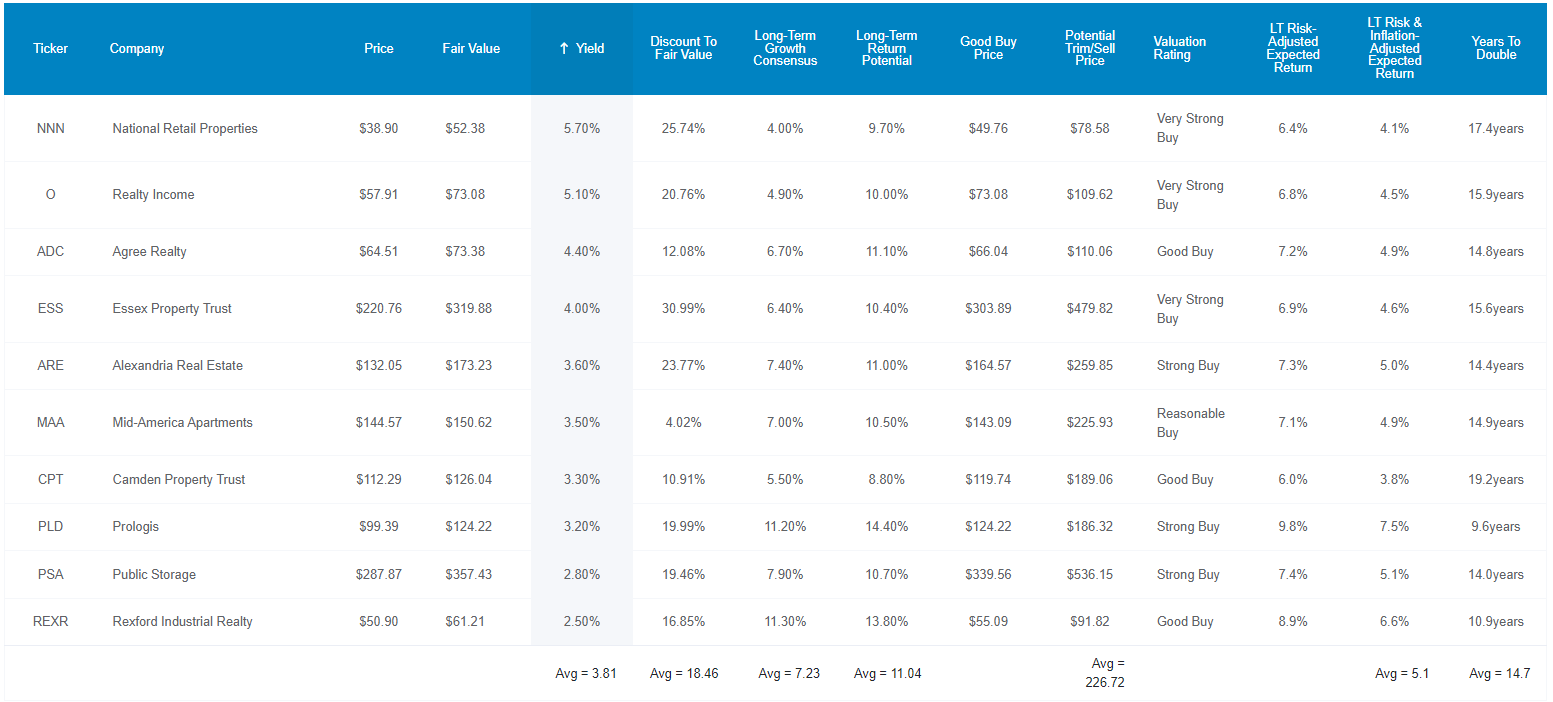
These Ultra SWAN REITs don’t just offer one of the safest 3.8% yields on earth, they are growing at a healthy 7.2% rate, and analysts expect long-term 11% annual total returns.
| Investment Strategy | Yield | LT Consensus Growth | LT Consensus Total Return Potential | Long-Term Risk-Adjusted Expected Return | Long-Term Inflation And Risk-Adjusted Expected Returns | Years To Double Your Inflation & Risk-Adjusted Wealth |
10-Year Inflation And Risk-Adjusted Expected Return |
| REITs | 3.9% | 6.1% | 10.0% | 7.0% | 4.8% | 15.1 | 1.60 |
| Top 10 Recession REITs | 3.8% | 7.2% | 11.0% | 7.7% | 5.5% | 13.1 | 1.70 |
| S&P 500 | 1.9% | 8.5% | 10.4% | 7.2% | 5.0% | 14.4 | 1.63 |
(Source: DK Research Terminal, Ycharts, Morningstar, FactSet)
The same yield as the REIT sector, but superior growth and total return potential that’s even better than the tech-heavy S&P 500.
- 2X the yield of the market
- but with slightly better long-term return potential
Inflation-Adjusted Consensus Total Return Potential: $1,000 Initial Investment
| Time Frame (Years) | 8.1% CAGR Inflation-Adjusted S&P 500 Consensus | 7.8% Inflation-Adjusted REIT Sector Consensus | 8.8% CAGR Inflation-Adjusted Top 10 Recession REIT Consensus | Difference Between Inflation-Adjusted ENB Consensus And S&P Consensus |
| 5 | $1,474.78 | $1,454.42 | $1,523.16 | $48.38 |
| 10 | $2,174.97 | $2,115.35 | $2,320.01 | $145.04 |
| 15 | $3,207.60 | $3,076.61 | $3,533.75 | $326.15 |
| 20 | $4,730.50 | $4,474.70 | $5,382.46 | $651.97 |
| 25 | $6,976.43 | $6,508.10 | $8,198.35 | $1,221.92 |
| 30 (retirement time frame) | $10,288.69 | $9,465.54 | $12,487.39 | $2,198.70 |
| 35 | $15,173.53 | $13,766.90 | $19,020.28 | $3,846.75 |
| 40 | $22,377.60 | $20,022.91 | $28,970.91 | $6,593.32 |
| 45 | $33,001.99 | $29,121.79 | $44,127.31 | $11,125.32 |
| 50 | $48,670.61 | $42,355.42 | $67,212.91 | $18,542.30 |
| 55 | $71,778.35 | $61,602.72 | $102,375.96 | $30,597.61 |
| 60 (investing lifetime) | $105,857.14 | $89,596.44 | $155,934.88 | $50,077.74 |
| 100 (institutional time frame, multi-generational wealth) | $2,368,828.40 | $1,793,981.36 | $4,517,575.80 | $2,148,747.40 |
(Source: DK Research Terminal, FactSet)
Over the next 30 years, analysts think these 10 Ultra SWAN REITs could deliver 12.5X inflation-adjusted returns, significantly more than the REIT sector.
Over an investing lifetime, they could deliver rich-retirement levels of income and wealth.
| Time Frame (Years) | Ratio Inflation-Adjusted Top 10 Recession REIT Consensus/REIT Sector Consensus | Ratio Inflation-Adjusted Top 10 Recession REIT Consensus vs. S&P consensus |
| 5 | 1.05 | 1.03 |
| 10 | 1.10 | 1.07 |
| 15 | 1.15 | 1.10 |
| 20 | 1.20 | 1.14 |
| 25 | 1.26 | 1.18 |
| 30 | 1.32 | 1.21 |
| 35 | 1.38 | 1.25 |
| 40 | 1.45 | 1.29 |
| 45 | 1.52 | 1.34 |
| 50 | 1.59 | 1.38 |
| 55 | 1.66 | 1.43 |
| 60 | 1.74 | 1.47 |
| 100 | 2.52 | 1.91 |
(Source: DK Research Terminal, FactSet)
Great yield, great returns, and given enough time, the potential to help you retire in safety and splendor.
OK, that’s great in theory; the math is beautiful and compelling. But what evidence is there that these 10 Ultra SWAN REITs can deliver double-digit long-term returns for decades?
Historical Returns Since October 2004 (Equal Weight, Annual Rebalancing)
The future doesn’t repeat, but it often rhymes. – Mark Twain
In our case, “past performance is no guarantee of future results.”
Still, studies show that blue chips with relatively stable fundamentals offer predictable returns based on yield, growth, and valuation mean reversion over time.
Bank of America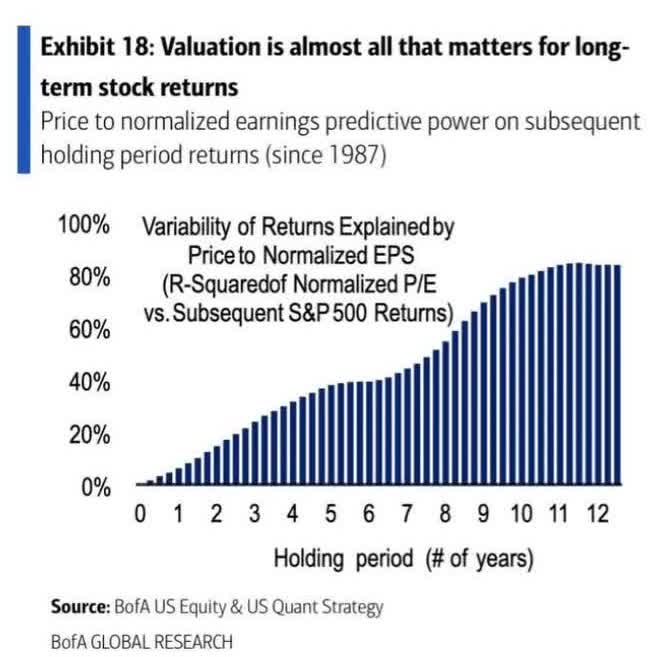
18 years is a time frame in which 91% of total returns are due to fundamentals; not luck.
(Source: Portfolio Visualizer Premium)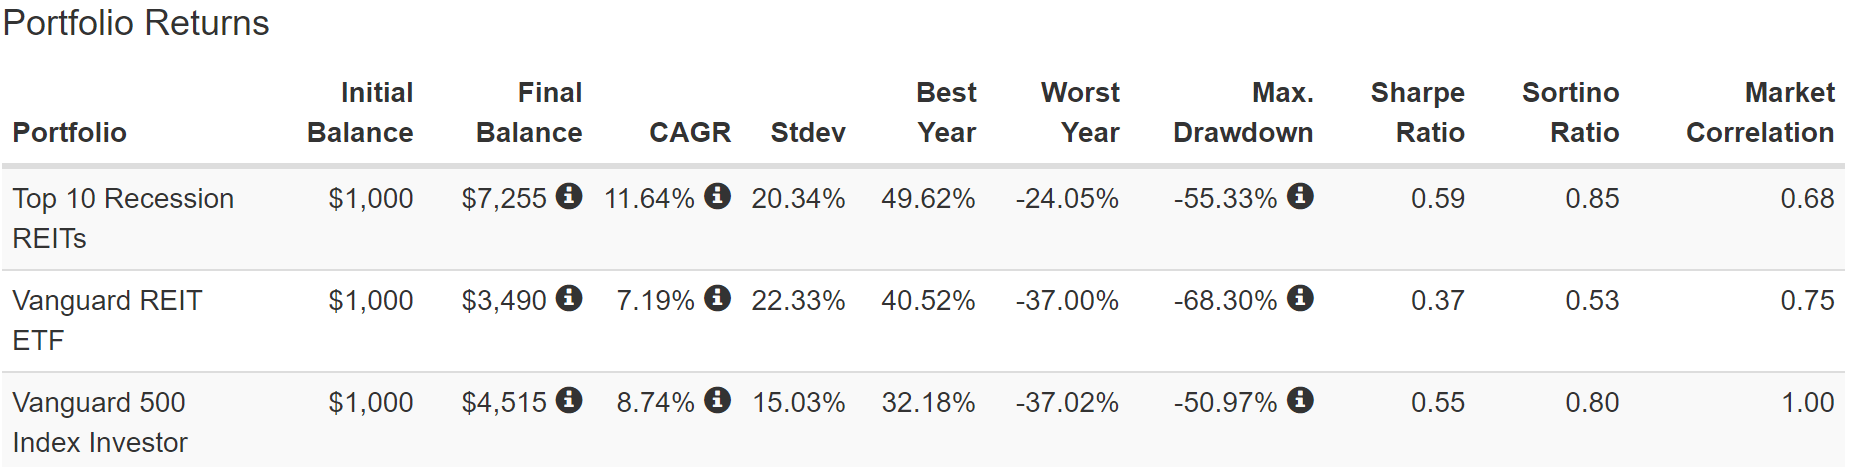
About 12% annual returns which ran circles around the REIT sector and the broader market. 60% better negative-volatility-adjusted total returns than the REIT sector (Sortino ratio).
(Source: Portfolio Visualizer Premium)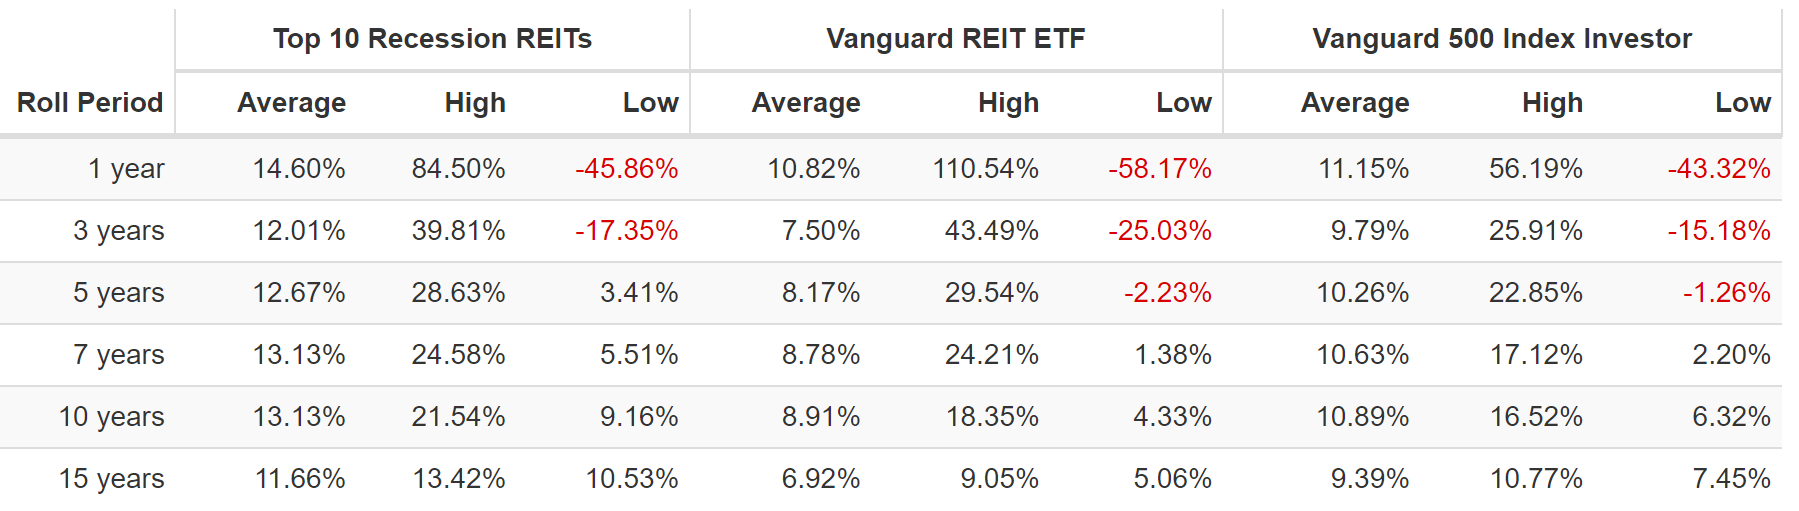
Consistently better-rolling returns than either REITs or the market.
(Source: Portfolio Visualizer Premium)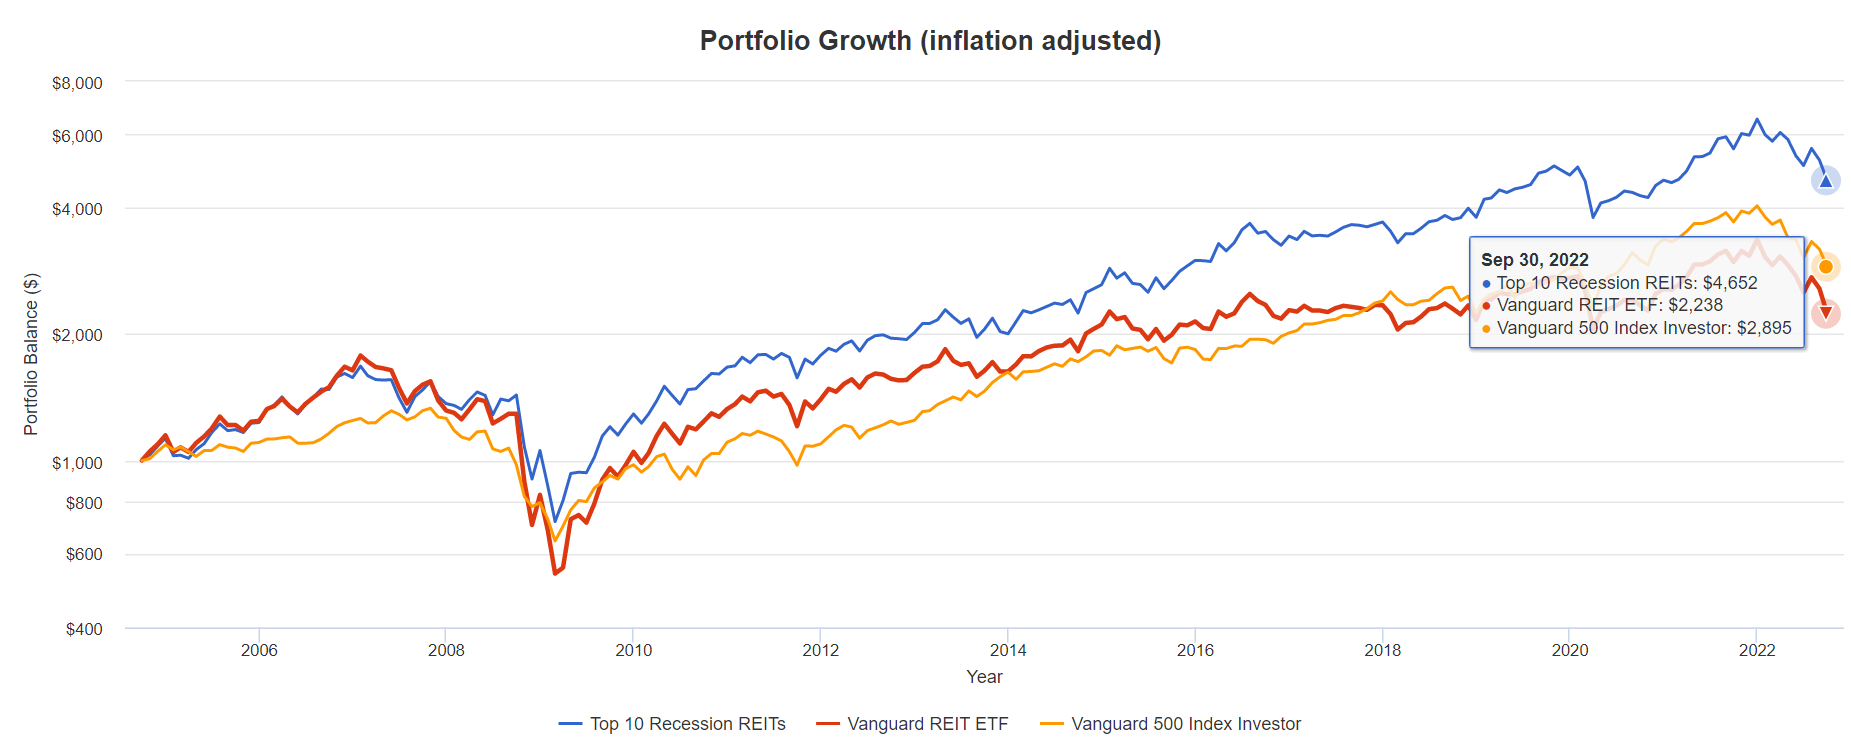
Twice the inflation-adjusted returns of the REIT sector and 66% better than the S&P 500.
Income You Can Trust In Even The Worst Recessions
(Source: Portfolio Visualizer Premium)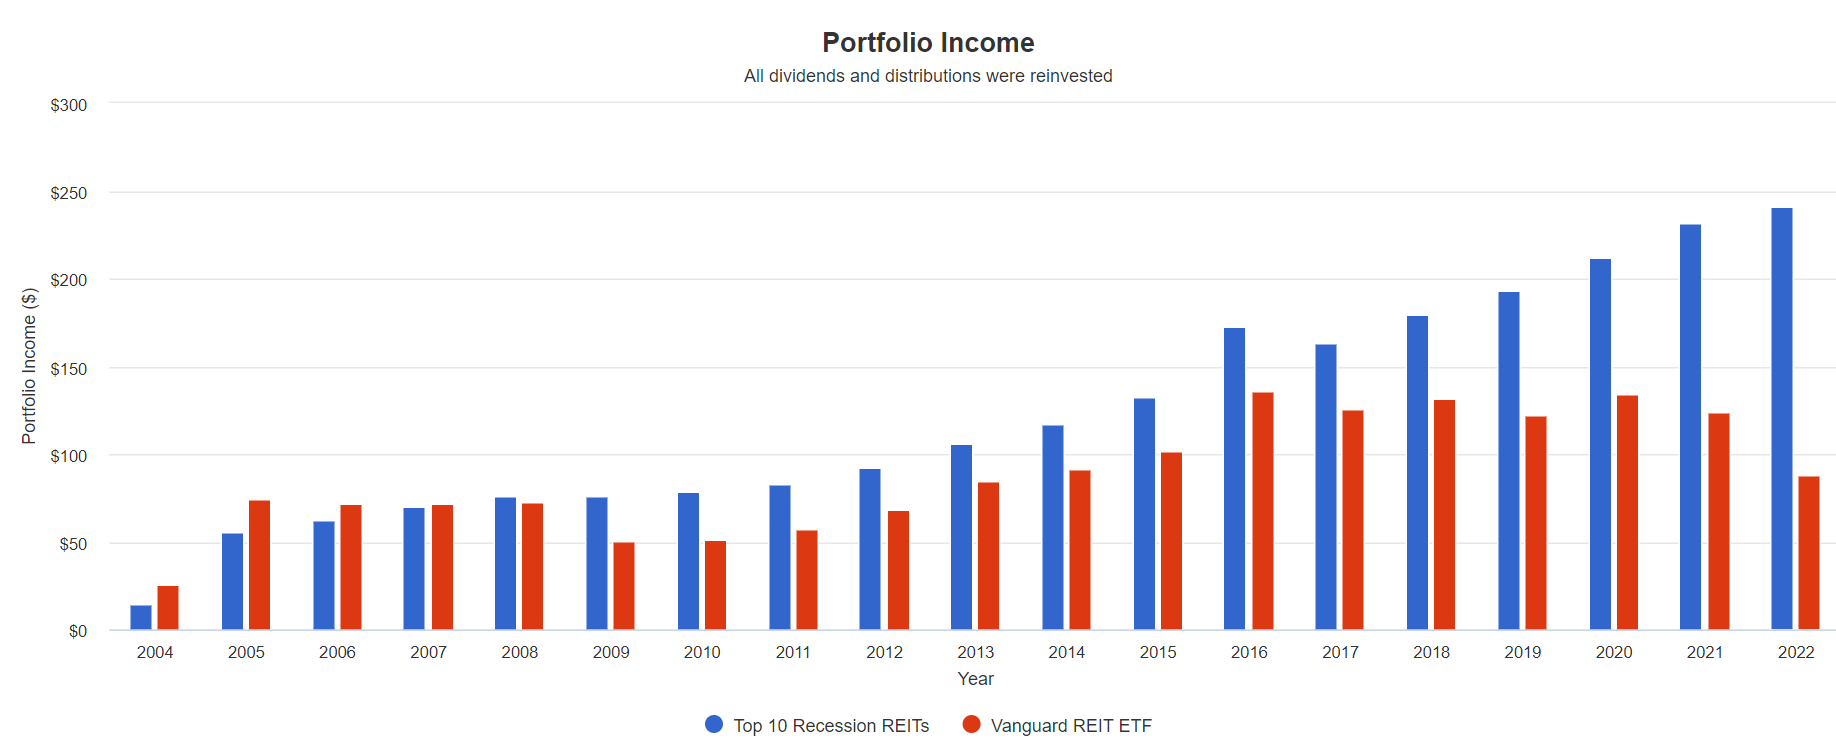
REITs cut their dividends 29% during the Great Recession, and the S&P 500 cut by 25%. But these 10 Ultra SWAN REITs kept their income stable and generated far more income over time.
Cumulative Dividends Since 2005: Per $1,000 Initial Investment
| Metric | REIT Sector | Top 10 Recession REITs |
| Total Dividends | $1,684 | $2,426 |
| Total Inflation-Adjusted Dividends | $1,052.50 | $1,516.25 |
| Annualized Income Growth Rate | 2.7% | 10.8% |
| Total Income/Initial Investment % | 1.68 | 2.43 |
| Inflation-Adjusted Income/Initial Investment % | 1.05 | 1.52 |
| More Inflation-Adjusted Income Than REIT Sector | NA | 1.44 |
| Starting Yield | 7.4% | 5.6% |
| Today’s Annual Dividend Return On Your Starting Investment (Yield On Cost) | 11.7% | 32.2% |
| 2022 Inflation-Adjusted Annual Dividend Return On Your Starting Investment (Inflation-Adjusted Yield On Cost) | 7.3% | 20.1% |
(Source: Portfolio Visualizer Premium)
Over the last 17 years, these 10 Ultra SWAN REITs delivered 11% annual income growth, 4X more than the REIT sector, thanks to not cutting during the Great Recession.
- the greatest crisis in the history of REITs and they didn’t cut
They delivered 152% of your original investment back in inflation-adjusted dividends and turned a 5.6% starting yield into a 20% inflation-adjusted yield on cost.
This is the power of the highest quality REITs in this bear market.
How To Turn These 10 Ultra SWAN REITs Into A Complete Sleep Well At Night Retirement Portfolio
No matter how high quality the blue-chip, owning a single sector is just asking for trouble.
(Source: Portfolio Visualizer Premium) (Source: Portfolio Visualizer Premium)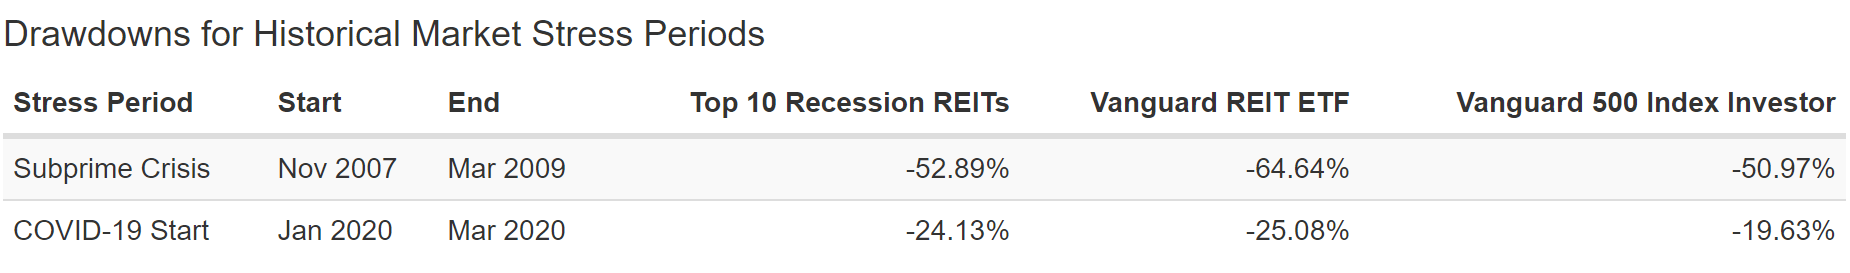
Even if the dividends are very safe, it might be hard to sleep well at night in bear markets like these.
(Source: Portfolio Visualizer Premium)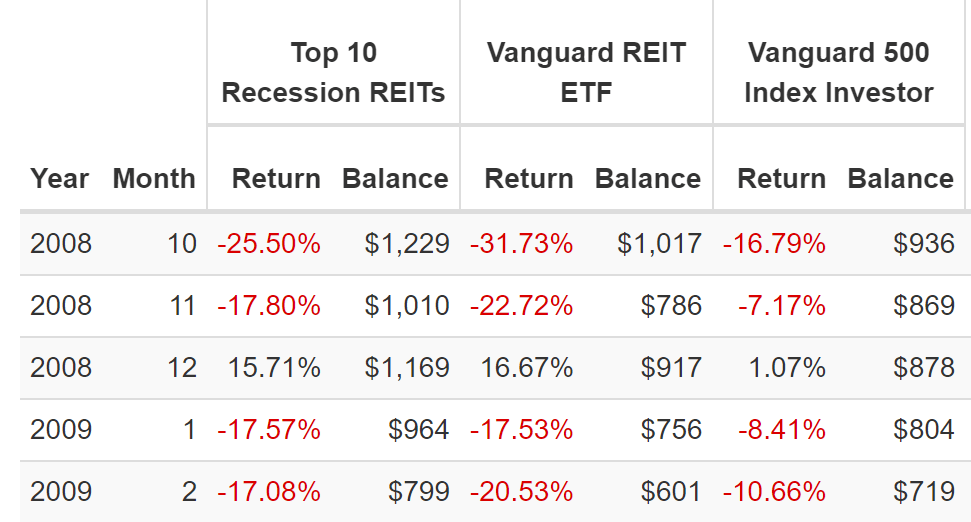
Your savings are safe, and your dividends are safe. Yet you still lost 25% in a single month and 32% in two months during the Great Recession, at least on paper.
What’s the most you should ever have in a single sector? For most people, 15% to 20% sector caps are appropriate. For those who really love a few sectors?
- The Charlie Munger risk caps rules of thumb for concentrated portfolios is at least 5 stocks in at least 3 sectors
- Schwab agrees no more than 33% in any single sector.
This is where we can apply prudent diversification and asset allocation to create a dream Ultra SWAN REIT-focused ZEUS portfolio.
- ZEUS = Zen Extraordinary Ultra SWAN portfolio
- a long-term recession-optimized portfolio construction strategy
- so you can “set and forget” your portfolio other than annual rebalancing
- and ride over even the worst market potholes in a Rolls Royce.
The basic structure of ZEUS is:
- 33% ETFs
- 33% hedges (cash, bonds, alternatives)
- 33% individual blue-chips.
In this case, I’ve constructed the following ZEUS REIT portfolio.
- 33% SCHD or VYM (gold standard high-yield blue-chip ETFs)
- 16.67% EDV or TLT (long duration US Treasuries, the most powerful recession hedging strategy according to Duke University)
- 16.67% managed futures (DBMF, AMFAX, or PQTAX) – the best stagflation hedging strategy for the last 42 years
- 33% these 10 Ultra SWAN REITs (3.3% each).
| Metric | 60/40 | ZEUS REIT Portfolio | X Better Than 60/40 |
| Yield | 2.3% | 4.8% | 2.06 |
| Growth Consensus | 5.1% | 5.2% | 1.02 |
| LT Consensus Total Return Potential | 7.4% | 10.0% | 1.35 |
| Risk-Adjusted Expected Return | 5.2% | 7.0% | 1.35 |
| Safe Withdrawal Rate (Risk And Inflation-Adjusted Expected Returns) | 2.9% | 4.7% | 1.62 |
| Conservative Time To Double (Years) | 24.7 | 15.3 | 1.62 |
(Source: DK Research Terminal, FactSet)
Compared to a 60/40 portfolio, you get twice the safe yield, 35% better long-term return potential, and a 62% higher safe withdrawal rate.
Inflation-Adjusted Consensus Return Potential: $555K Average Retired Couple’s Savings Initial Investment
| Time Frame (Years) | 5.2% CAGR Inflation-Adjusted 60/40 | 7.8% Inflation-Adjusted ZEUS REIT Consensus | Difference Between ZEUS REIT Consensus and 60/40 Consensus |
| 5 | $656,501.93 | $741,756.01 | $85,254.08 |
| 10 | $845,087.82 | $1,078,827.40 | $233,739.58 |
| 15 | $1,087,846.64 | $1,569,071.97 | $481,225.34 |
| 20 | $1,400,340.04 | $2,282,095.22 | $881,755.18 |
| 25 | $1,802,599.88 | $3,319,133.02 | $1,516,533.14 |
| 30 | $2,320,412.36 | $4,827,425.21 | $2,507,012.85 |
| 35 | $2,986,970.98 | $7,021,120.88 | $4,034,149.90 |
| 40 | $3,845,004.35 | $10,211,683.52 | $6,366,679.17 |
| 45 | $4,949,515.26 | $14,852,112.93 | $9,902,597.67 |
| 50 | $6,371,306.53 | $21,601,262.73 | $15,229,956.20 |
| 55 | $8,201,519.70 | $31,417,385.10 | $23,215,865.40 |
| 60 | $10,557,477.51 | $45,694,184.58 | $35,136,707.08 |
| 100 | $79,595,190.01 | $914,930,493.01 | $835,335,302.99 |
(Source: DK Research Terminal, FactSet)
For the average retired couple, that extra 2.8% per year in consensus return potential could translate into $2.5 million in extra inflation-adjusted wealth over 30 years.
| Time Frame (Years) |
Ratio ZEUS REIT Consensus Vs. 60/40 Consensus |
| 5 | 1.13 |
| 10 | 1.28 |
| 15 | 1.44 |
| 20 | 1.63 |
| 25 | 1.84 |
| 30 | 2.08 |
| 35 | 2.35 |
| 40 | 2.66 |
| 45 | 3.00 |
| 50 | 3.39 |
| 55 | 3.83 |
| 60 | 4.33 |
| 100 | 11.49 |
(Source: DK Research Terminal, FactSet)
That’s double the real wealth of a 60/40, and if you pass on your portfolio to your heirs, you can see how 2.8% higher returns can translate into a life-changing fortune.
Ok, this is impressive, but what about historical returns? Can we beat a 60/40 while enjoying a higher REIT-led yield AND achieving low volatility in even the market’s most extreme crashes?
Yes, we can.
Historical Returns Since June 2019 (EDV, DBMF, SCHD, and Top 10 REITs)
(Source: Portfolio Visualizer Premium)
Not just beating the Top 10 REITs and the REIT sector, but more than doubling the returns of a 60/40 and almost matching the S&P 500.
- but with a peak decline of just 14% compared to a 60/40’s 21% decline
- almost 3X better negative-volatility-adjusted returns compared to a 60/40
- 50% better than the S&P 500
- just 12% annual volatility (lower than a 60/40).
(Source: Portfolio Visualizer Premium)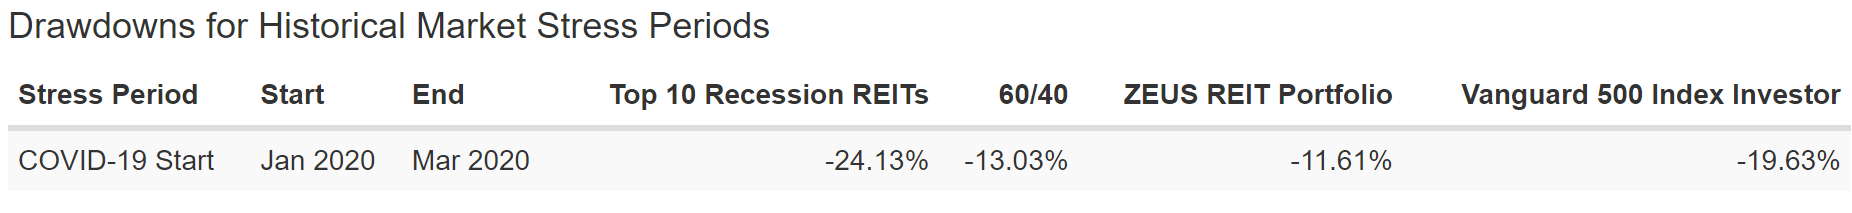
Just a 12% decline in the Pandemic, better than a 60/40 and half the decline of the Top 10 Recession REITs.
(Source: Portfolio Visualizer Premium)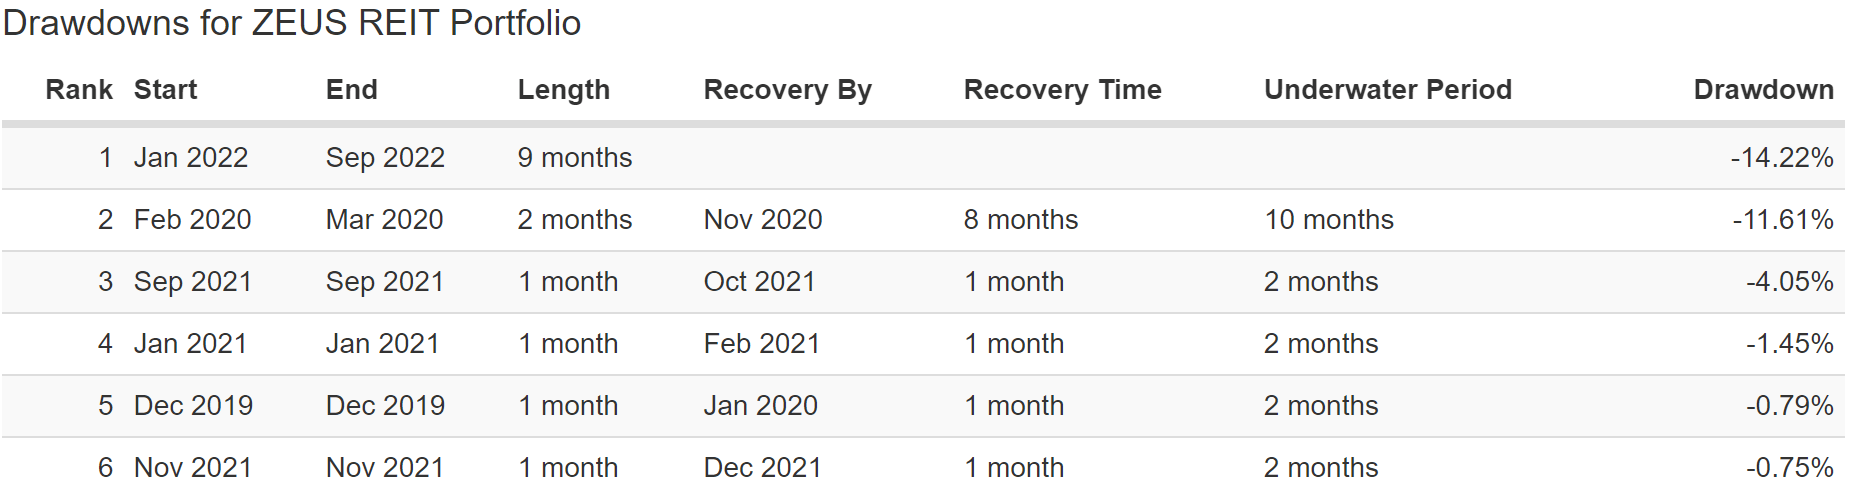
A peak decline of 14% in this bear market:
- Nasdaq -33%
- S&P -26%
- 60/40: -21%.
Historical Returns Since January 2014 (EDV, PQTAX, SCHD, and Top 10 REITs)
(Source: Portfolio Visualizer Premium)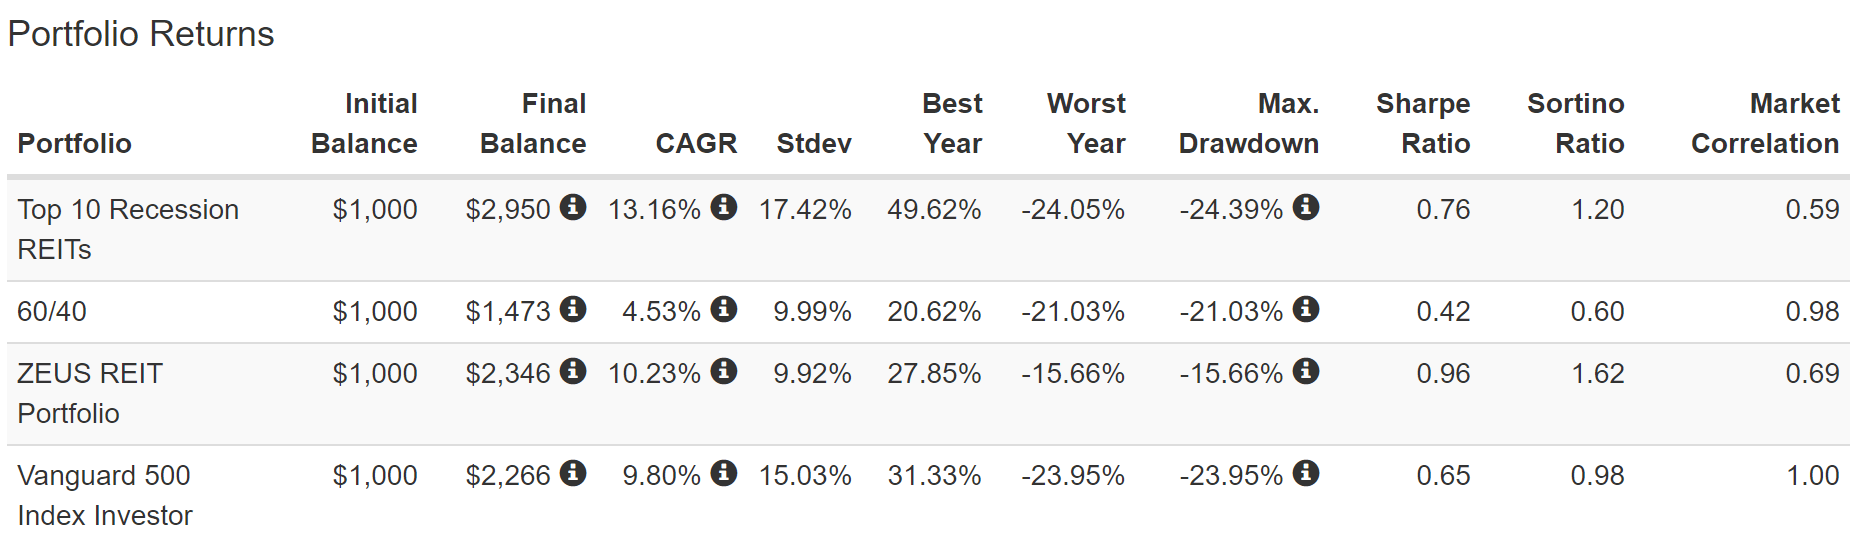
2.5X the returns of a 60/40 with sub-10 % annual volatility and slightly better returns than even the S&P 500.
A peak decline of 16% and 2.5X better negative-volatility adjusted returns than a 60/40, 60% better than the S&P 500.
(Source: Portfolio Visualizer Premium)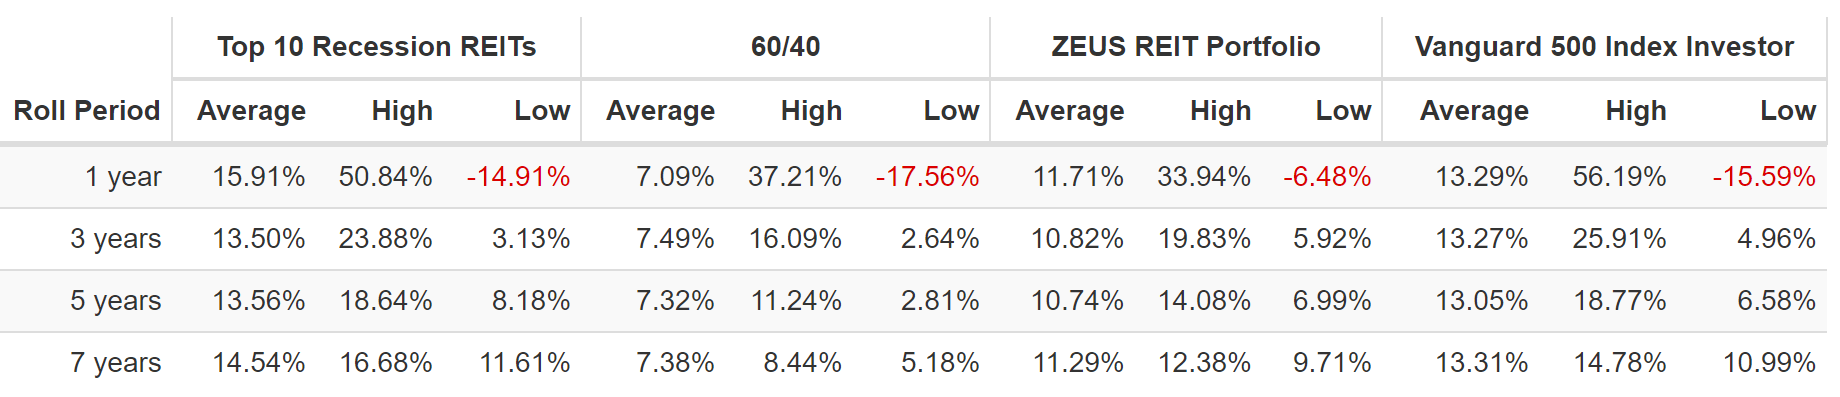
The worst 12-month return was just 6.5%, and the average rolling returns are 11%, similar to what analysts expect in the future.
(Source: Portfolio Visualizer Premium) (Source: Portfolio Visualizer Premium)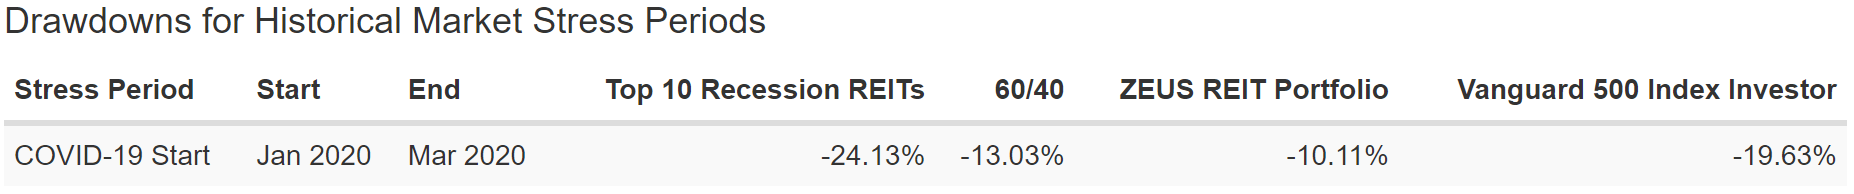
Eight years, two recessionary bear markets, and just two corrections, with no portfolio bear markets.
Historical Returns Since August 2010 (EDV, AMFAX, VYM, and Top 10 REITs)
(Source: Portfolio Visualizer Premium)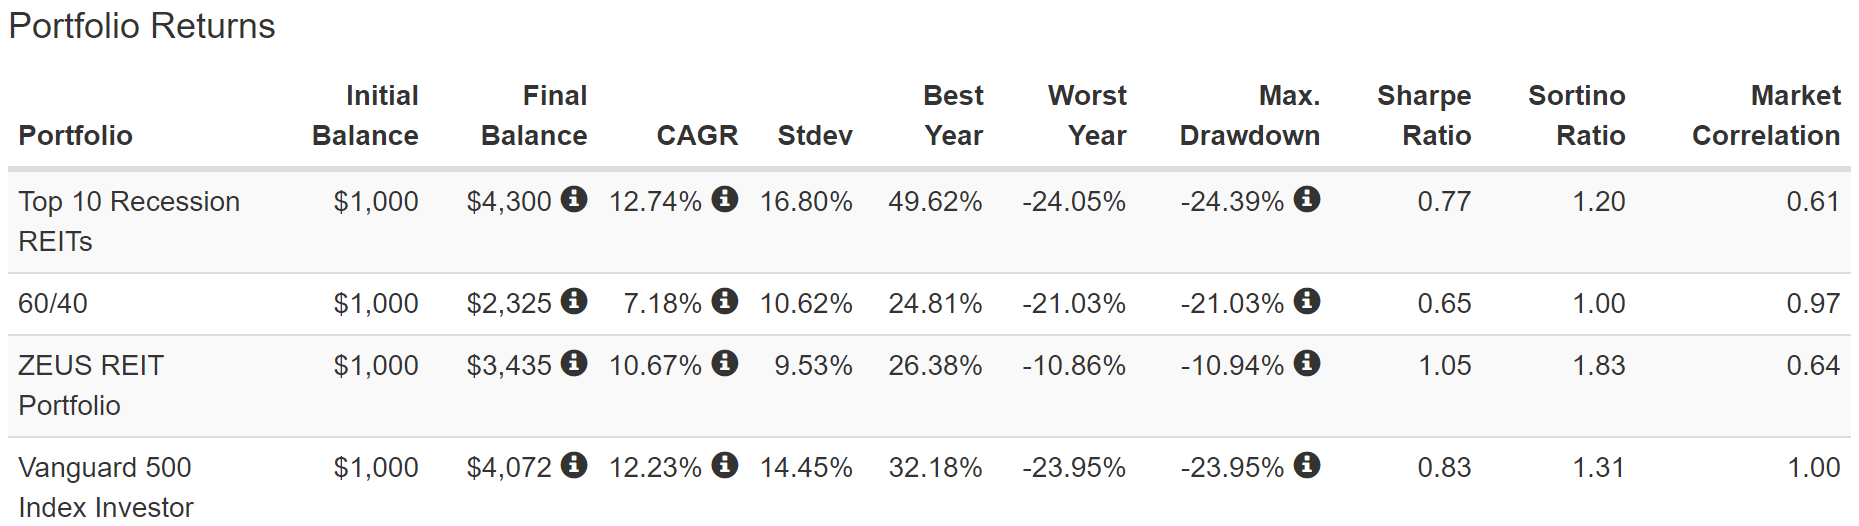
Sub 10% annual volatility, double-digit returns similar to what analysts expect in the future, and about 3% better annual returns than a 60/40. Just as it was designed to do.
(Source: Portfolio Visualizer Premium)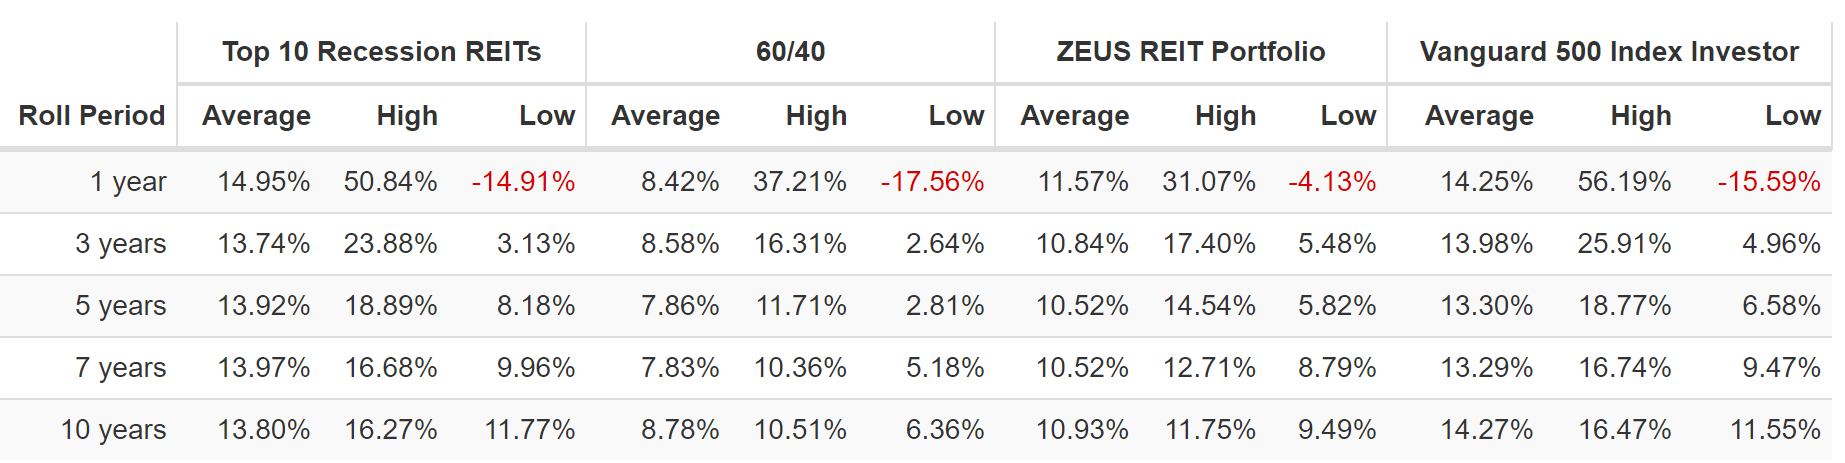
83% better negative-volatility-adjusted returns than a 60/40 and a peak decline of just 11%.
The worst 12-month return was 4%, 1/4th that of a 60/40 and the S&P 500.
(Source: Portfolio Visualizer Premium) (Source: Portfolio Visualizer Premium)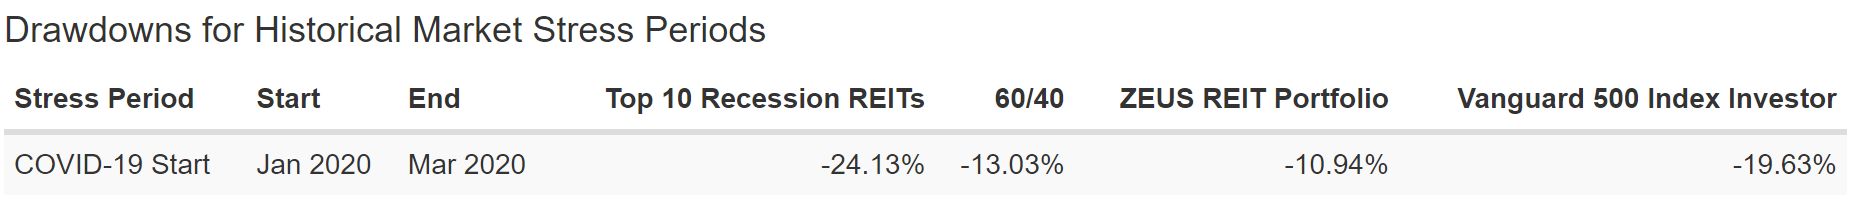
12 years, two recessionary bear markets, and the largest decline was just 11%.
- Riding over market potholes in a Rolls Royce.
Historical Returns Since March 2007 (TLT, RYMTX, VYM, and Top 10 REITs)
(Source: Portfolio Visualizer Premium)
RYMTX is a low-quality managed futures fund. DO NOT BUY IT. It just happens to be the oldest managed futures fund on Wall Street and allows us to backtest the entire Great Recession.
- the 2nd largest market crash in US history
- the ultimate trial by fire for any Ultra SWAN portfolio strategy.
Even with a low-quality managed futures fund representing half our hedging allocation, the annual volatility, even through the Great Recession, was just 11%, lower than a 60/40’s.
The peak decline was 33%, 10% lower than a 60/40, and 20% lower than the Top 10 REITs alone.
(Source: Portfolio Visualizer Premium)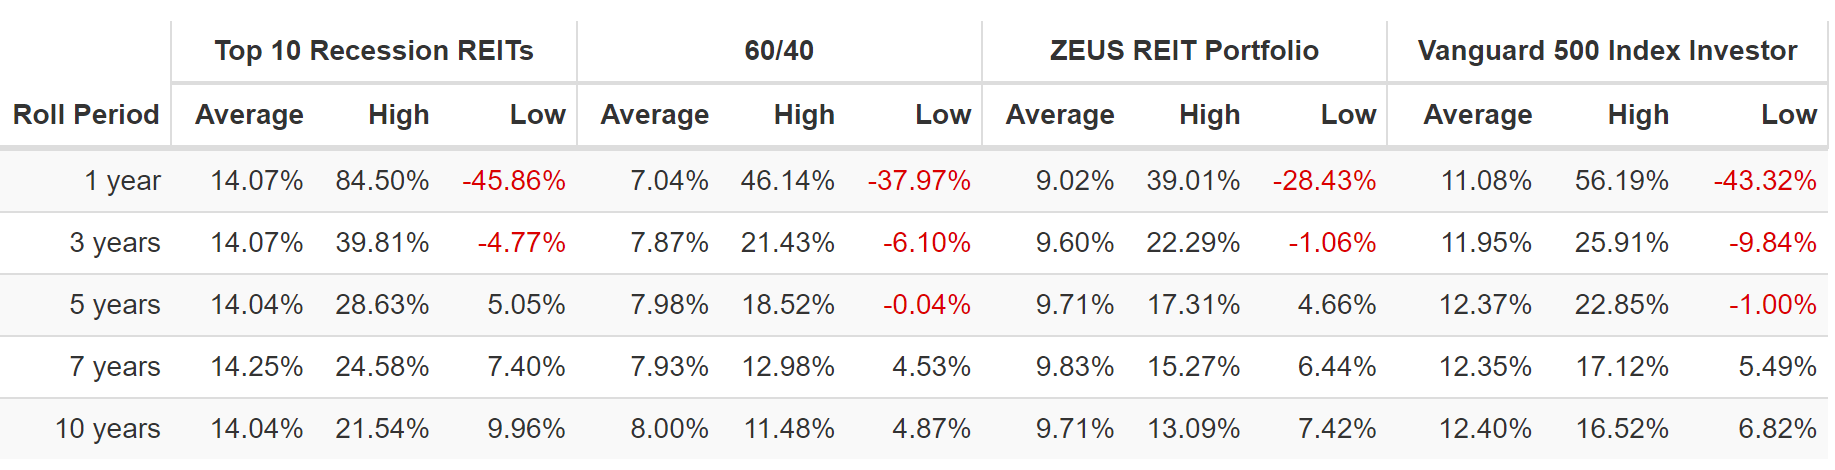
Very consistent 9% to 10% annual returns that surpassed a 60/40’s by the expected 2% to 3%.
And while a 60/40 and the market were underwater for as long as five years, this version of ZEUS REIT’s worst return was slightly negative for just three years.
(Source: Portfolio Visualizer Premium)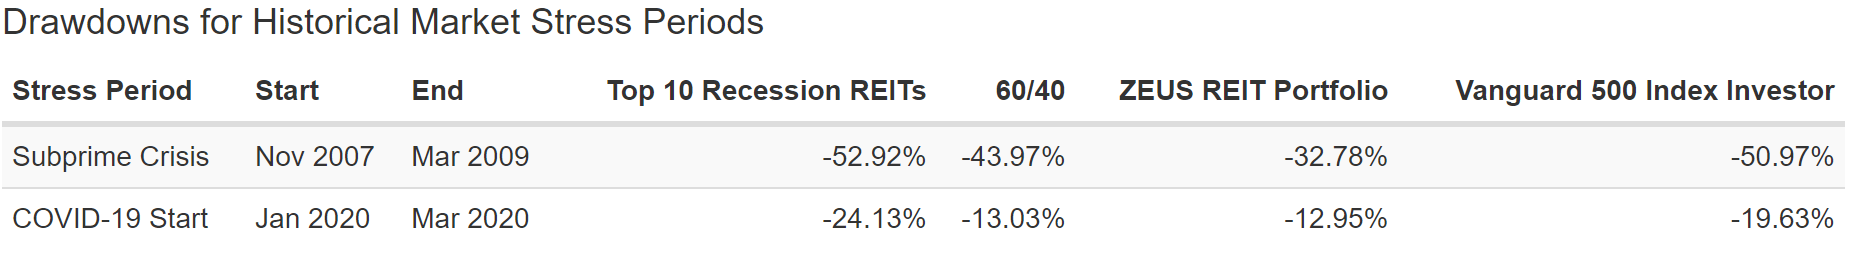
Even with REITs making up 33% of this portfolio and getting crushed in the Great Recession, thanks to the hedging power of bonds and managed futures (even a low-quality hedge fund), this portfolio still managed to deliver far smaller declines in the 2nd worst market crash in U.S. history.
And in the Pandemic? It fell 13%, the same as a 60/40.
- Higher quality hedge funds and longer duration bonds helped the other versions of ZEUS REIT fall slightly less.
(Source: Portfolio Visualizer Premium)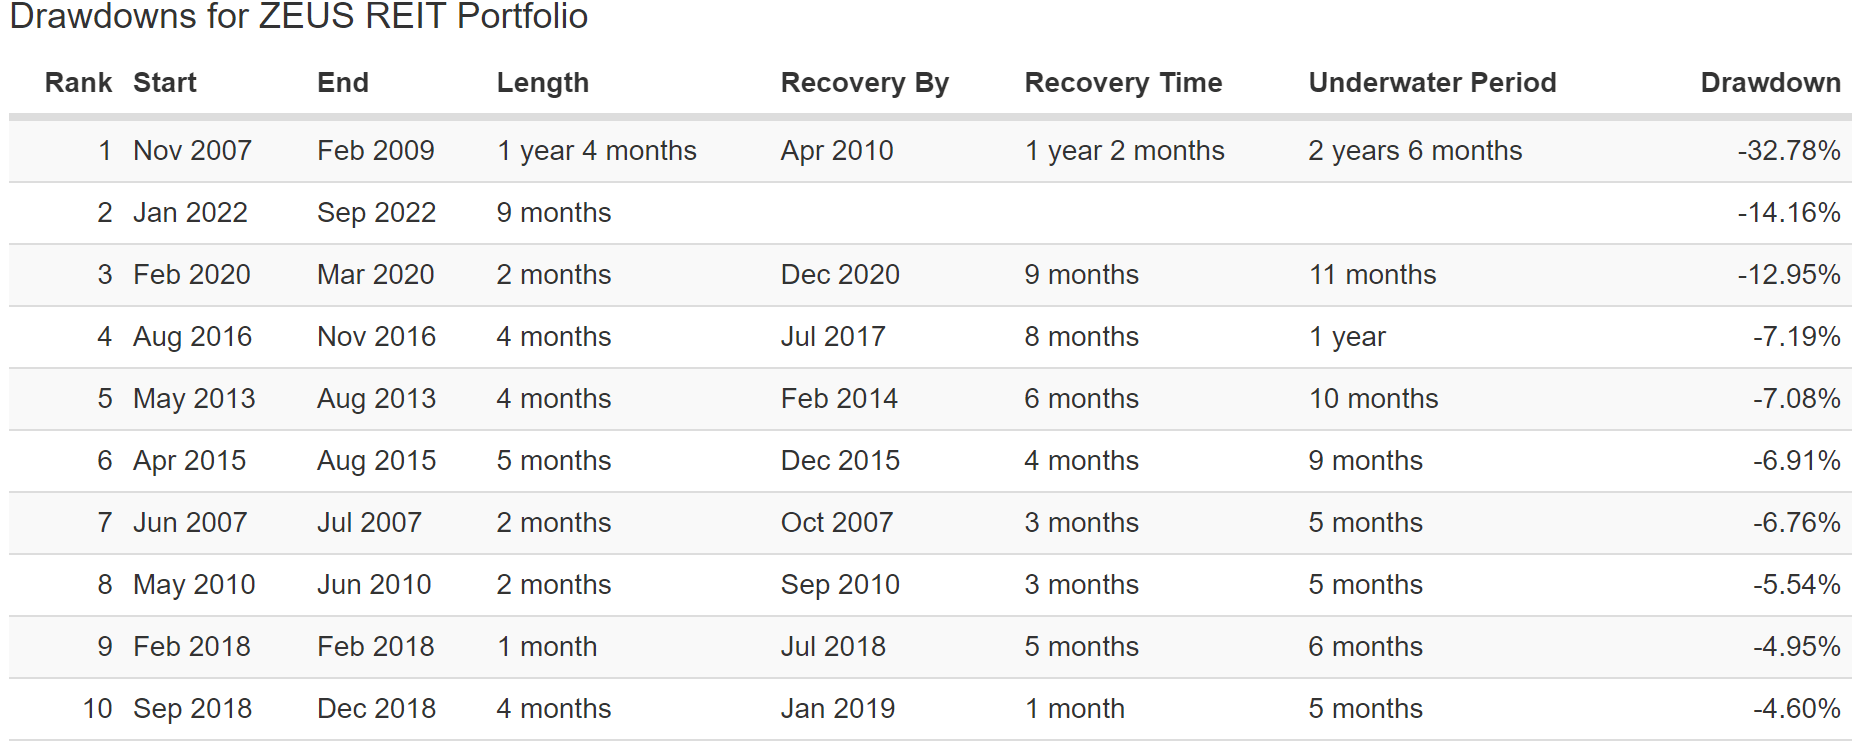
15 years, three recessionary bear markets, and two extreme market crashes. Yet just one bear market for this version of the ZEUS REIT portfolio.
- Rolling over even the largest market potholes in a Rolls Royce.
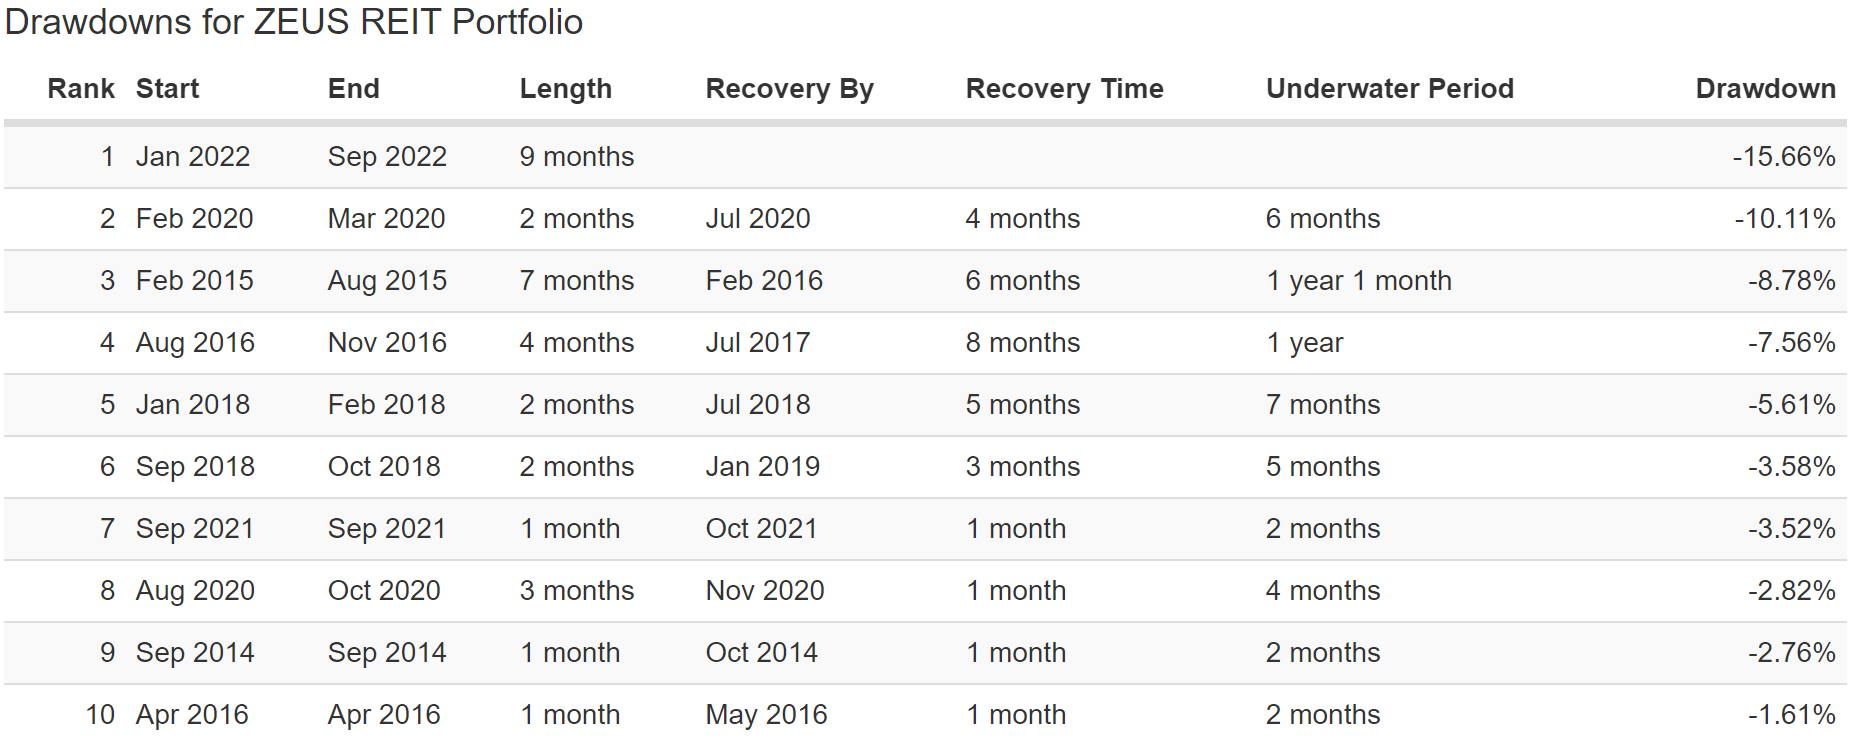
The longest period to recover new highs was just 2.5 years. Now take a look at how that compares to the Top 10 REITs, 60/40, and the S&P 500.
(Source: Portfolio Visualizer Premium)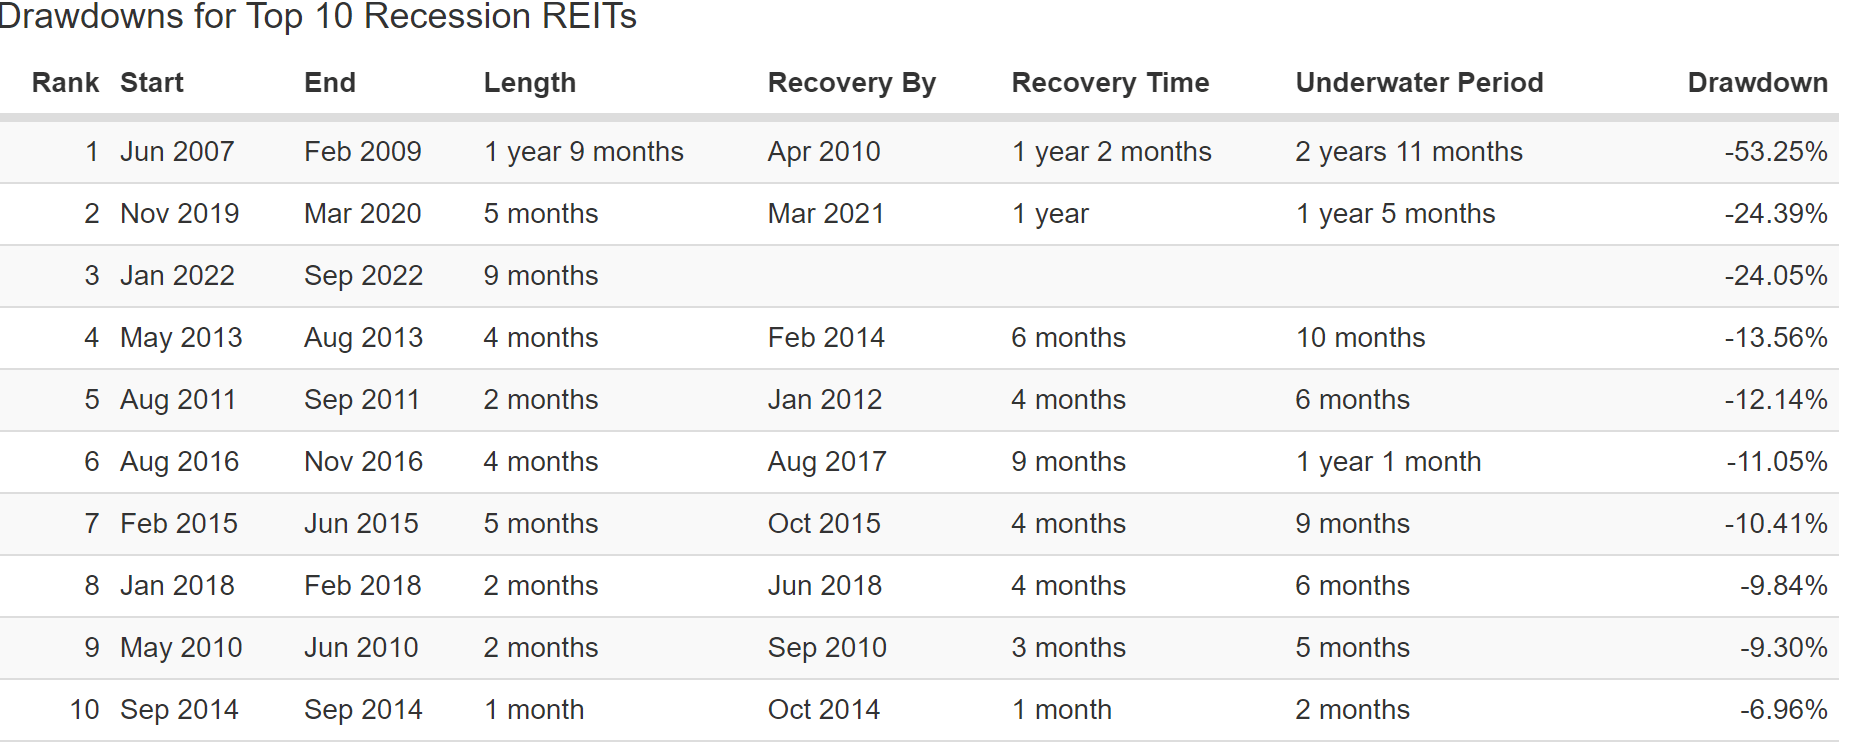
3 years to recover for the Top 10 REITs.
(Source: Portfolio Visualizer Premium)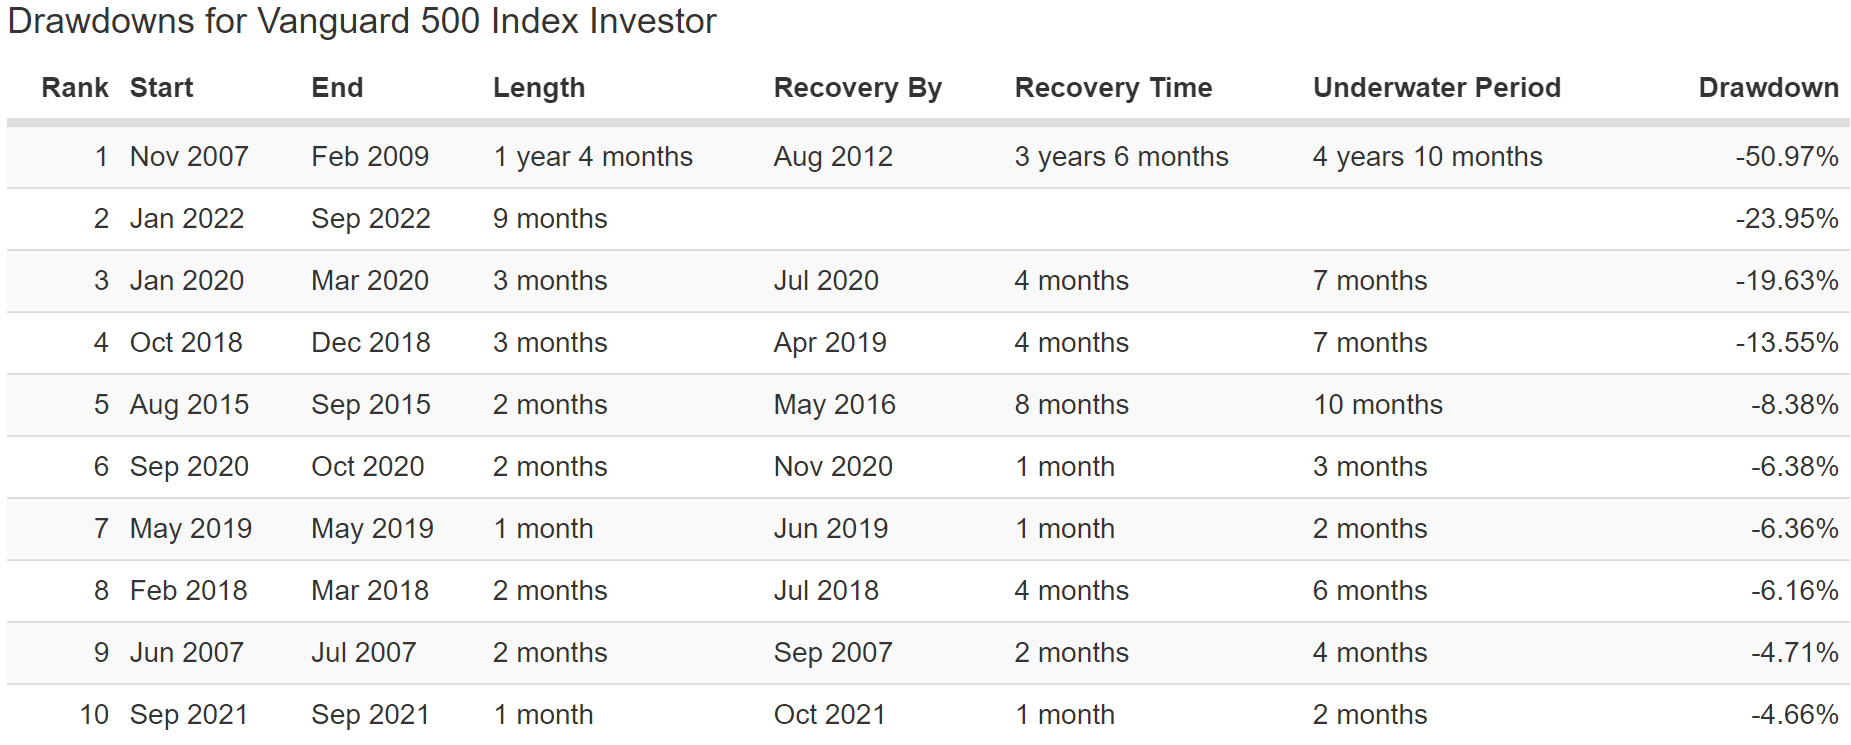
The market took as long as 5 years to recover from the Great Recession.
(Source: Portfolio Visualizer Premium)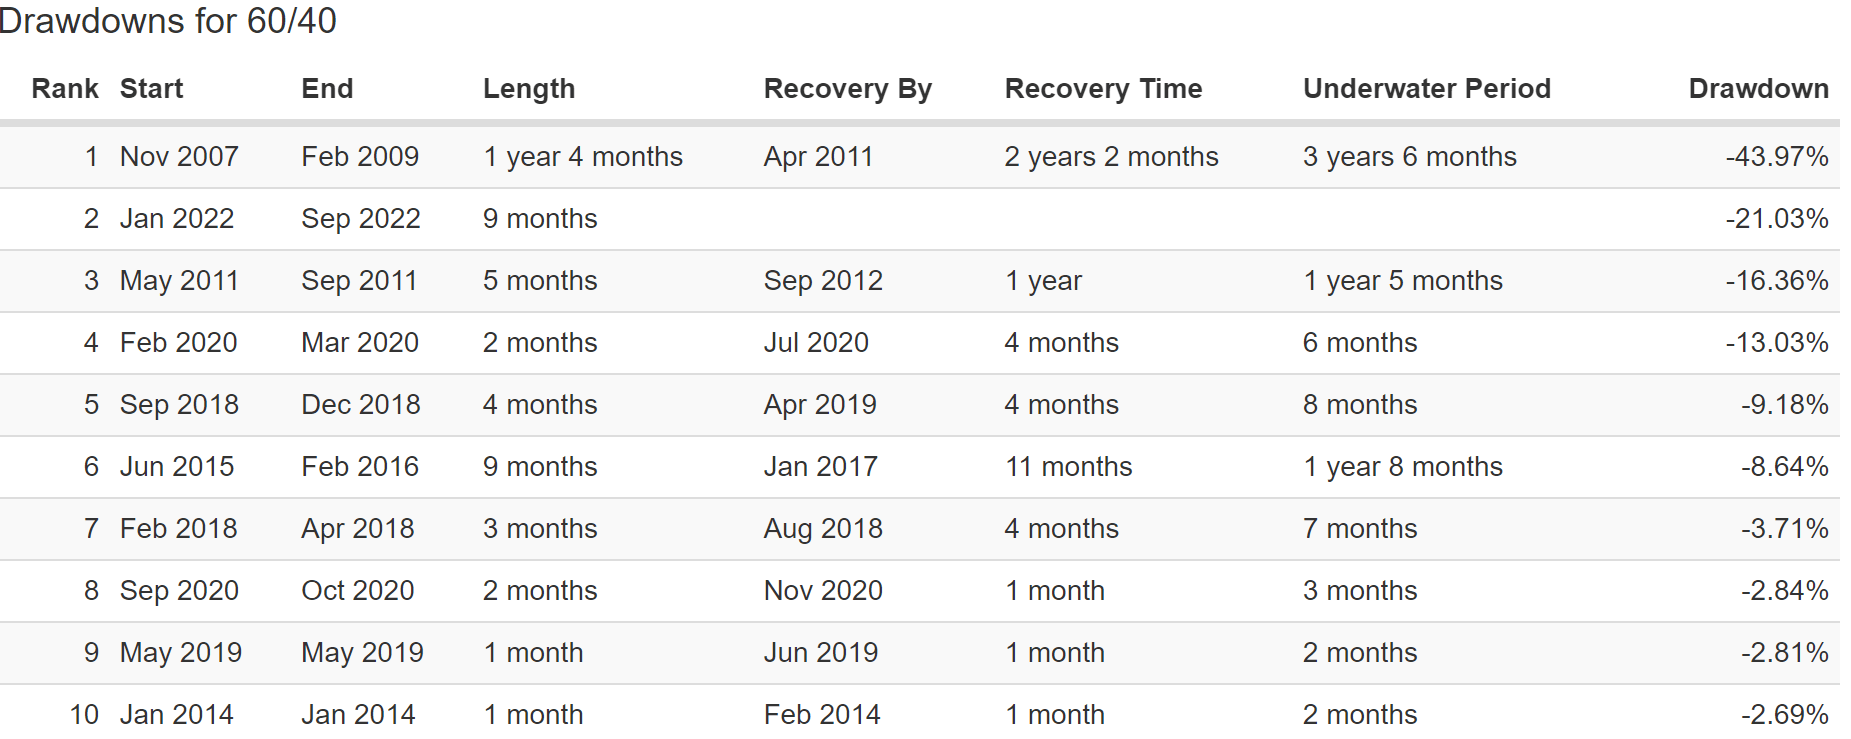
A 60/40 tool 3.5 years to recover from the Great Recession, 1 year longer than ZEUS REIT.
ZEUS REIT During The Great Recession
(Source: Portfolio Visualizer Premium)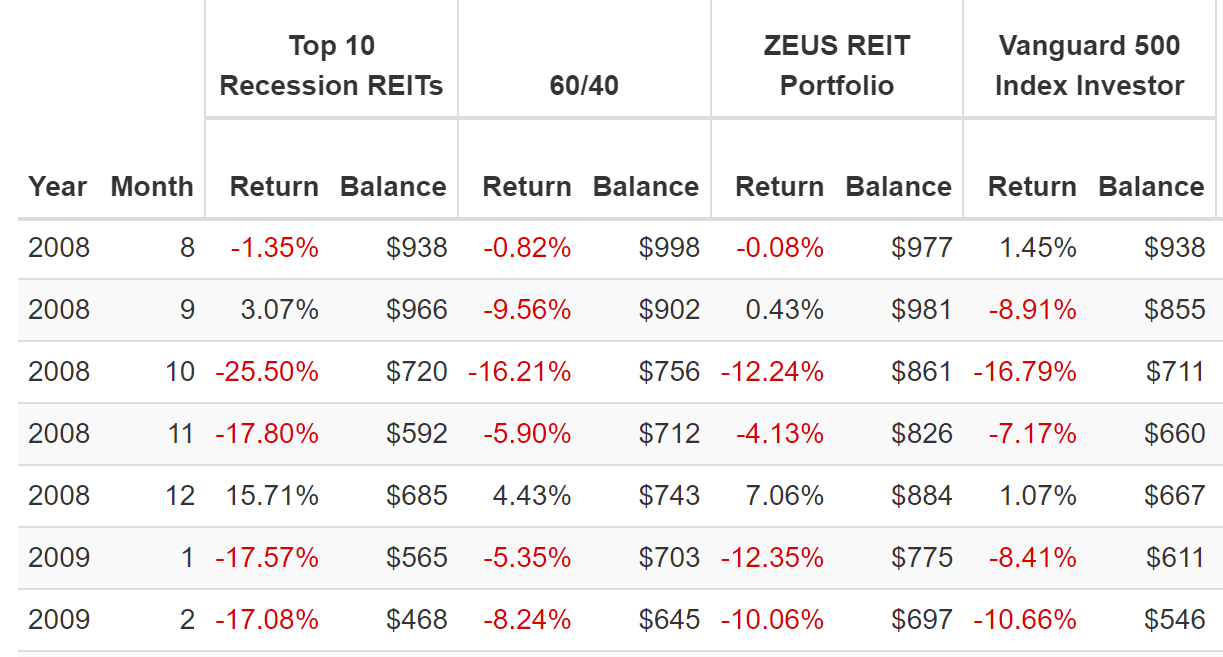
ZEUS REIT fell half as much as the top 10 REITs during the October 2008 crash.
It fell just 4% in November 2008, 1/4th as much as the top 10 REITs.
It suffered a 21% decline in the final two months of the GFC crash, compared to a 33% crash for the top 10 REITs.
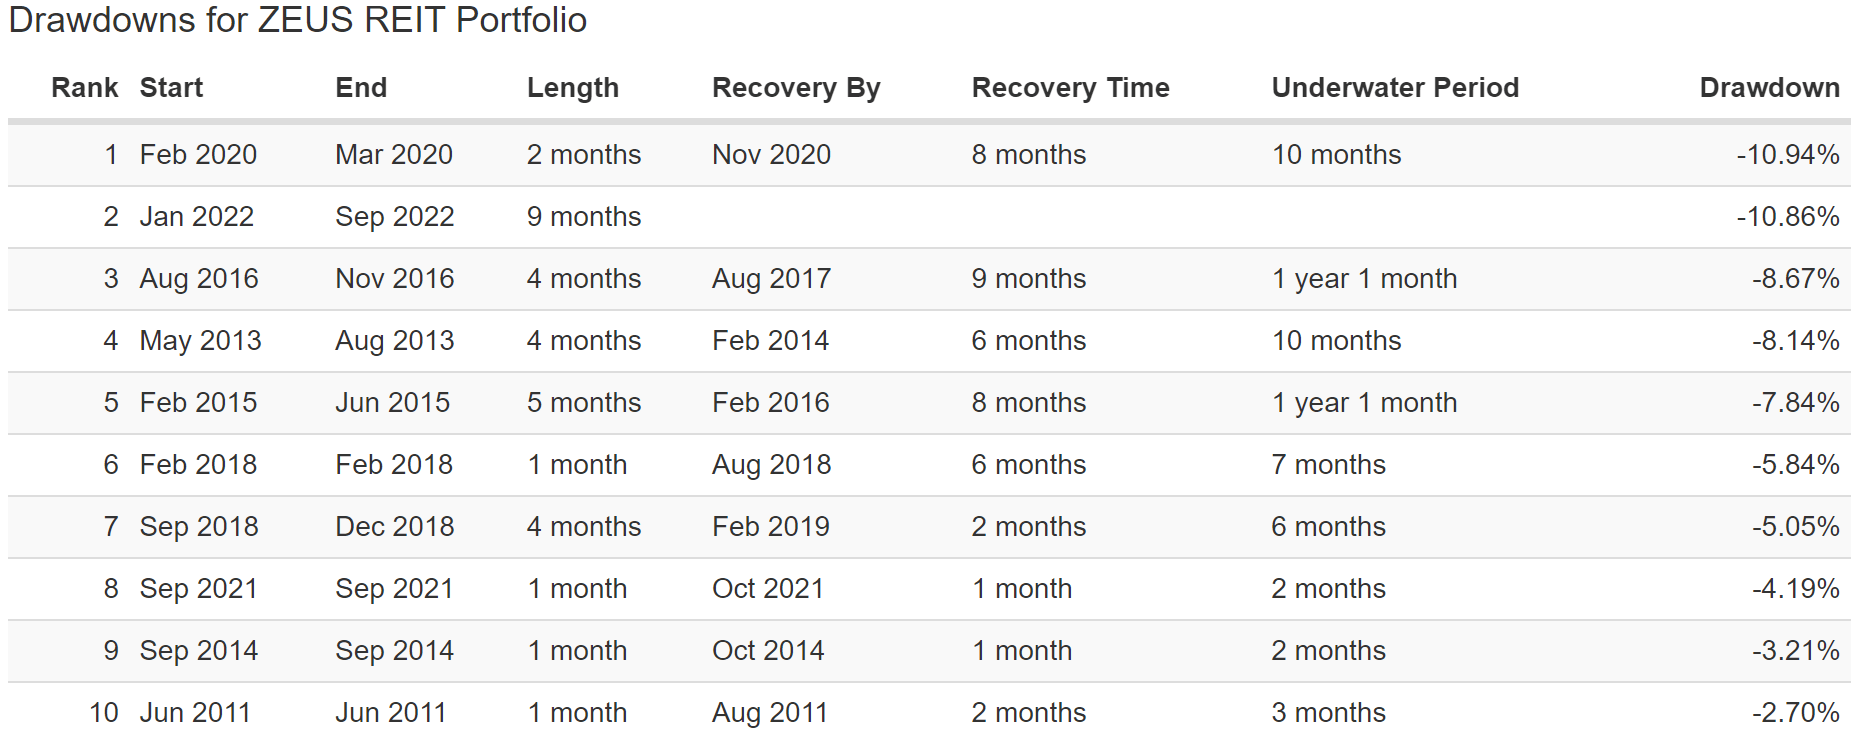
ZEUS REIT (AMFAX, VYM, EDV, And Top 10 REITs) During The 2011 Bear Market
(Source: Portfolio Visualizer Premium)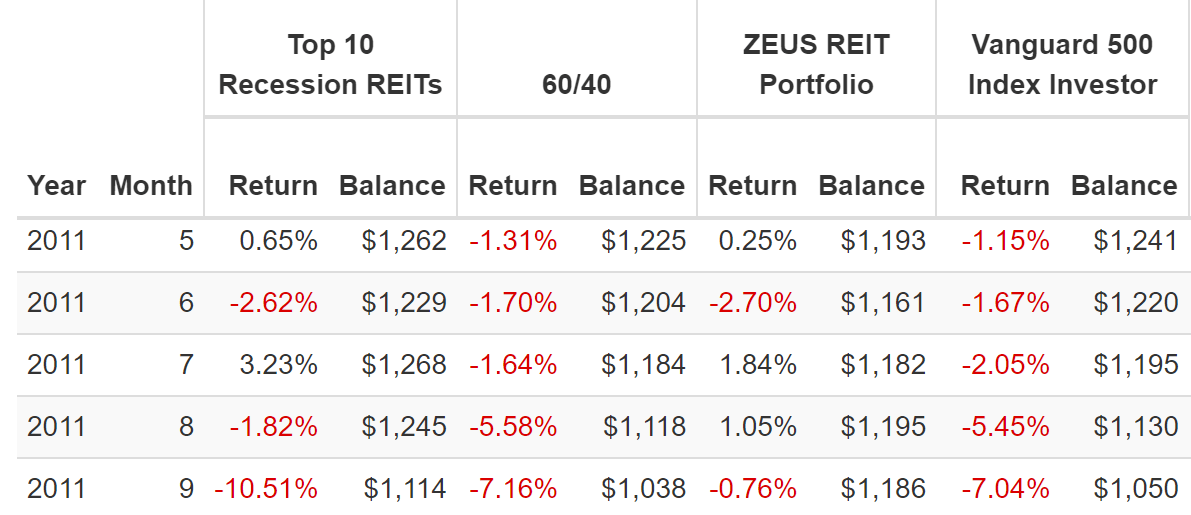
In 2011 the market suffered a five-month correction that resulted in stocks falling 20% intraday. The top 10 REITs fell 12% in this bear market, a 60/40 fell 15%, and ZEUS REIT (with higher quality AMFAX instead of RYMTX) fell just 1%.
- riding over a large market pothole on a hovercraft.
ZEUS REIT (PQTAX, SCHD, EDV, And Top 10 REITs) During The 2018 Bear Market
(Source: Portfolio Visualizer Premium)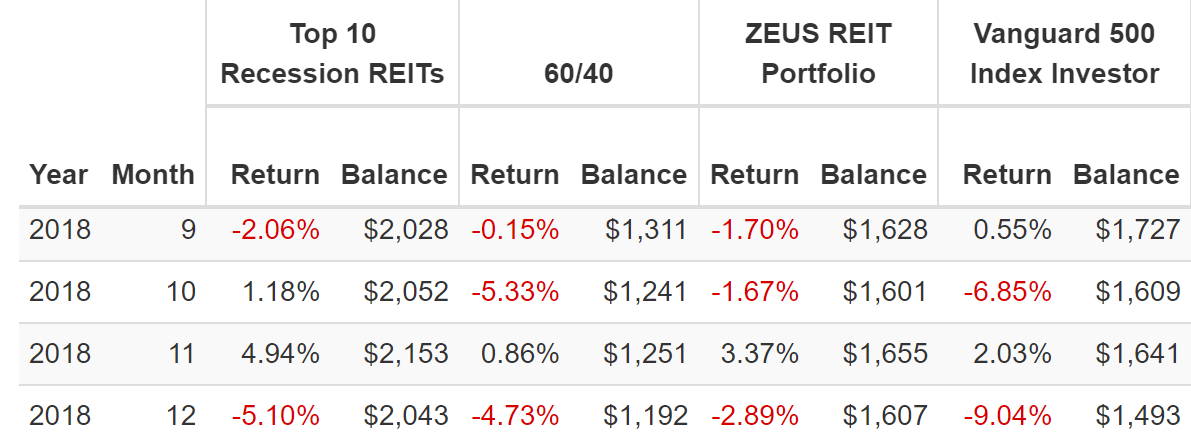
During the 2018 bear market, the S&P hit -20% intra-day on December 24th. The peak decline for the top 10 REITs? -2%. For a 60/40? -9%. ZEUS REIT? -3%.
ZEUS REIT (DBMF, SCHD, EDV, And Top 10 REITs) During The Pandemic
(Source: Portfolio Visualizer Premium)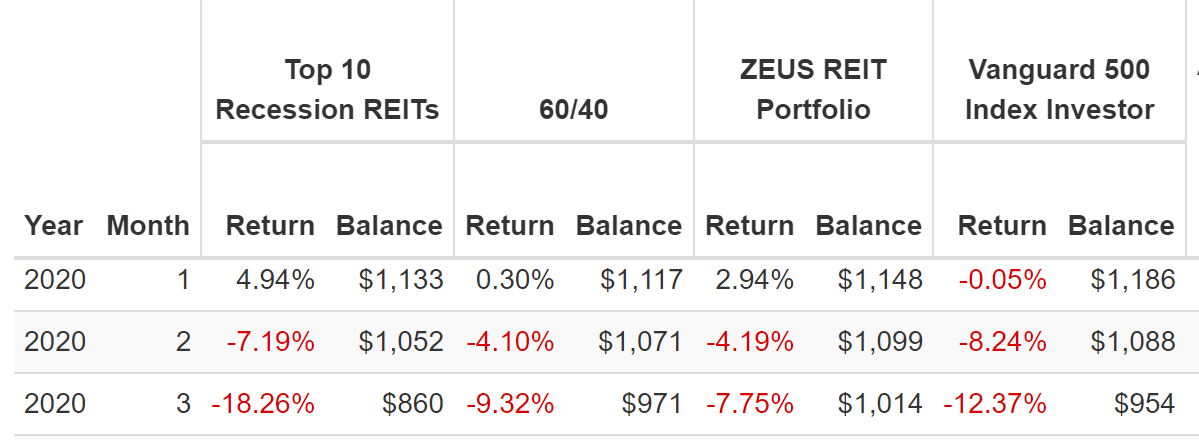
Now that’s what I call sleeping well at night in even the most extreme, once-in-a-century market crashes.
ZEUS REIT (DBMF, SCHD, EDV, And Top 10 REITs) During The 2022 Bear Market
(Source: Portfolio Visualizer Premium)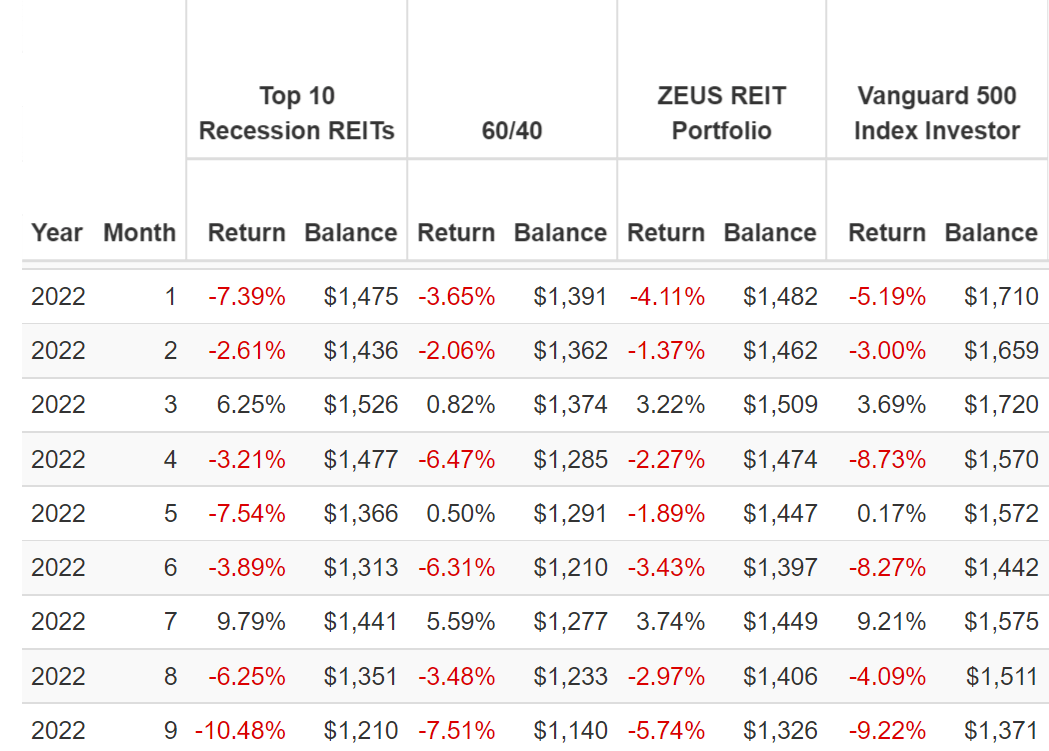
The first stagflationary bear market in 40 years, and ZEUS REIT has managed to do its job admirably, including falling far less in the April, June, and September monthly crashes.
- Even when bonds fail, ZEUS doesn’t.
This is the power of superior quality, diversification, and asset allocation to help you enjoy a generous and safe yield today, a rich retirement tomorrow, and sleep well at night in even the craziest and most extreme economic and market conditions.
Bottom Line: The 10 Best REITs In America Can Help You Survive And Thrive During This Recession And Beyond
Let me be clear: I’m NOT calling the bottom in any of these REITs (I’m not a market-timer).
Sleep Well At Night doesn’t mean “can’t fall hard in a bear market.”
Fundamentals are all that determine safety and quality, and my recommendations.
- over 30+ years, 97% of stock returns are a function of pure fundamentals, not luck
- in the short term; luck is 25X as powerful as fundamentals
- in the long term, fundamentals are 33X as powerful as luck.
While I can’t predict the market in the short term, here’s what I can tell you about these the 10 highest quality REITs in America.
- very safe 3.8% yield
- average BBB+ stable credit rating
- 7.2% CAGR long-term growth consensus
- 11.0% CAGR long-term return potential (similar to their returns since 2000)
- 21% CAGR consensus return potential through 2024
- NO DIVIDEND CUTS, not even in the Great Recession when S&P dividends fell 25% and REIT dividends 29%.
No matter how severe the recession of 2023 is likely to be, I can say with high confidence that it will be milder than the Great Recession.
That’s why I am so confident these REITs, the best in America according to iREIT and Dividend Kings, are the best REITs you can own in this recession.
And if you combine them with the world’s best high-yield dividend ETFs (SCHD or VYM) and the best hedging ETFs (EDV and DBMF), then you can truly build a complete Ultra SWAN retirement portfolio that can help you retire in safety and splendor.
- 4.8% safe yield
- 10% CAGR long-term return consensus (similar to the returns of the last 15 years)
- ultra-low-volatility (less than a 60/40)
- far smaller peak declines in even the most extreme market crashes (10% lower than a 60/40 during the Great Recession, 7% smaller in the 2022 bear market).
When you trust your savings to the world’s best blue-chip assets, you never have to time the market.
You never have to pray for luck.
The world’s best blue-chips can help you make your own luck, so that you can ride over the market’s inevitable potholes, no matter how large, in a Rolls Royce portfolio.
And that, my friends, is how you survive and thrive through this recession and retire in safety and splendor.
Be the first to comment