


PhoThoughts/iStock Editorial via Getty Images
Introduction
While everyone knows the big sporting goods brands like Nike (NKE) and Adidas (OTCQX:ADDYY) (OTCQX:ADDDF), Puma (OTCPK:PMMAF) (OTCPK:PUMSY) is often forgotten as this smaller player only has a total revenue of just under 6B EUR. The company is making good progress in the Americas as the revenue increased by almost 50% in 2021, which is a much larger revenue increase than any of the other regions Puma is active in. This pushed the contribution from the Americas to the consolidated revenue mix to almost 39% (up from just under 34% in 2020). 2021 also was the first year in the company’s history its revenue in the Americas was higher than its core EMEA markets.
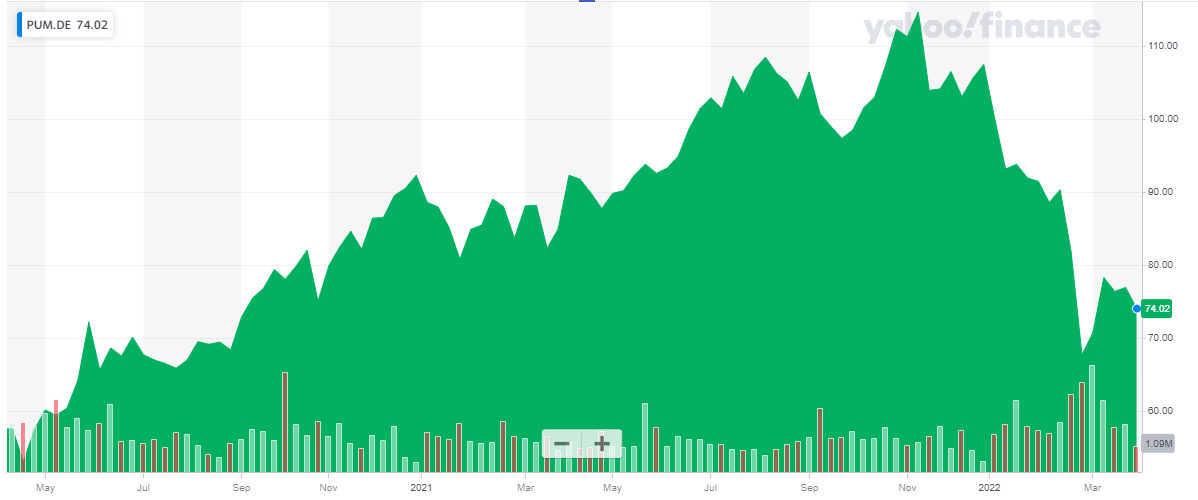
Yahoo Finance
As Puma’s listing in the US is rather illiquid, I’d strongly recommend to trade in Puma’s shares using its primary listing on the Deutsche Boerse stock exchange. The ticker symbol in Germany is PUM and the average daily volume of 500,000 shares represents a monetary value of 37MEUR. And since last year, Puma is a member of the Dax 40 index.
Unfortunately, the Puma website mainly contains download-only links, but you can find all relevant information here.
Puma is aggressively investing in its expansion, and that weighs on the free cash flow result
2021 wasn’t an easy year for Puma as in the first half of the year the company had to deal with COVID-related measures like store closings while in the second half of the year Puma had to deal with supply chain issues. The logistical difficulties are persisting but I hope to see the majority of the issues to be resolved by the end of this year as the acute shortage of shipping containers should be over while port congestion levels should improve.
Puma’s financial results recovered nicely from the disappointing performance in 2020. The revenue increased by about 30% to 6.8B EUR while the gross profit increased at a slightly faster pace. As you can see in the image below, the “other operating expenses” increased by about 20% which is a rather strong increase but this was obviously totally absorbed by the higher revenue and gross profit and the EBIT almost tripled on a YoY basis.
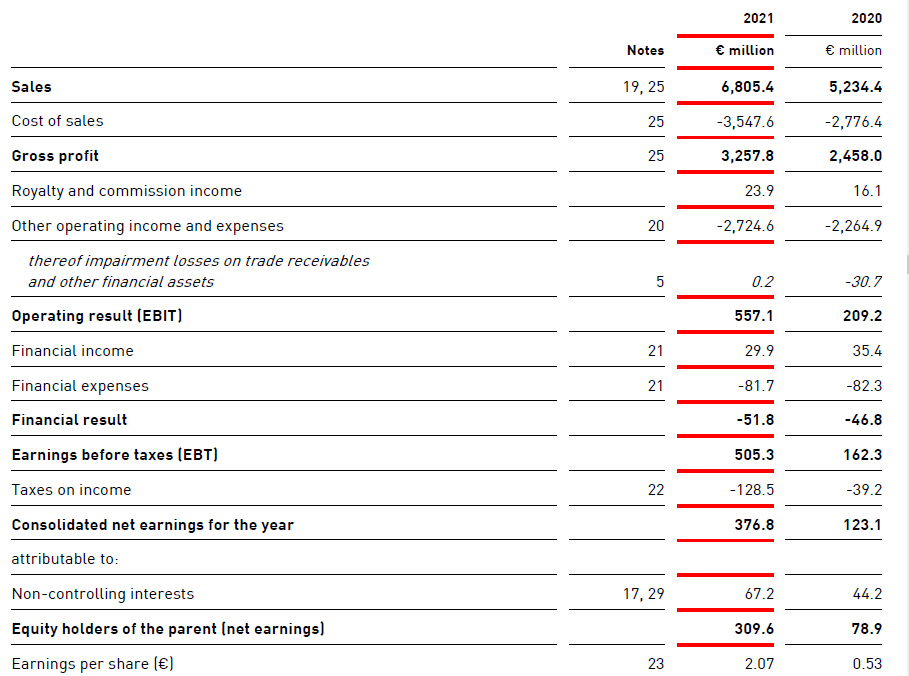
Puma Investor Relations
With a net income of 377M EUR of which just under 310M EUR was attributable to the shareholders of Puma, the EPS came in at approximately 2.07 EUR per share. That’s almost four times higher than in 2020.
As Puma is running a clean balance sheet with little debt, the total finance expenses may appear to be high but as the image below shows, the net interest expenses on the financial debt were close to zero. The interest related to the lease liabilities exceeded 31M EUR (up from 29.3M EUR in 2020) and another substantial portion of the net finance expenses was related to “other” expenses: These are derivatives on currencies.
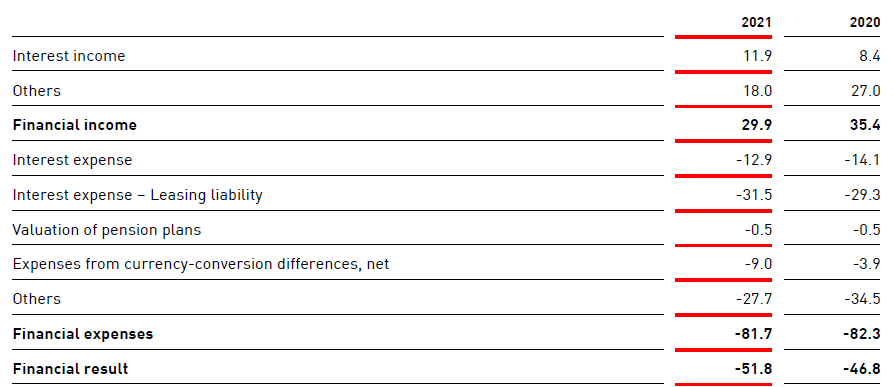
Puma Investor Relations
As Puma is currently trading at 35 times its earnings, I was hoping the free cash flow result would outpace the reported net income. Unfortunately, Puma has shifted its growth investments into a higher gear and the reported free cash flow is actually lower than the reported net income due to those investments in growth.
The company published an operating cash flow of 460.1M EUR, but as you can see below, this includes an investment in the working capital position to the tune of 214.3M EUR. We also see Puma paid 146.9M EUR in taxes although the income statement indicates about 129M EUR was due based on the FY2021 pre-tax result. On an adjusted basis, the operating cash flow was approximately 692M EUR.
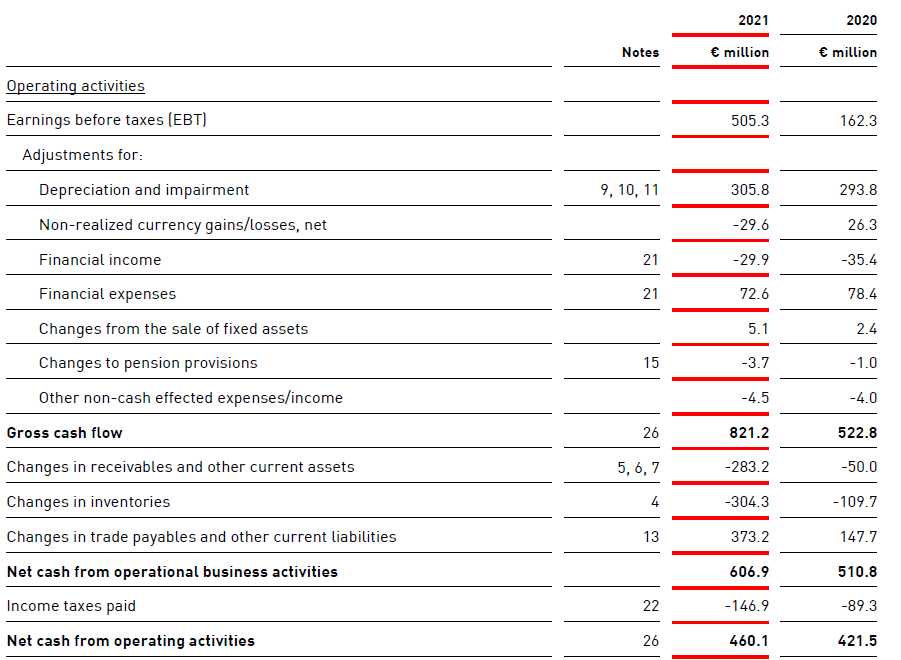
Puma Investor Relations
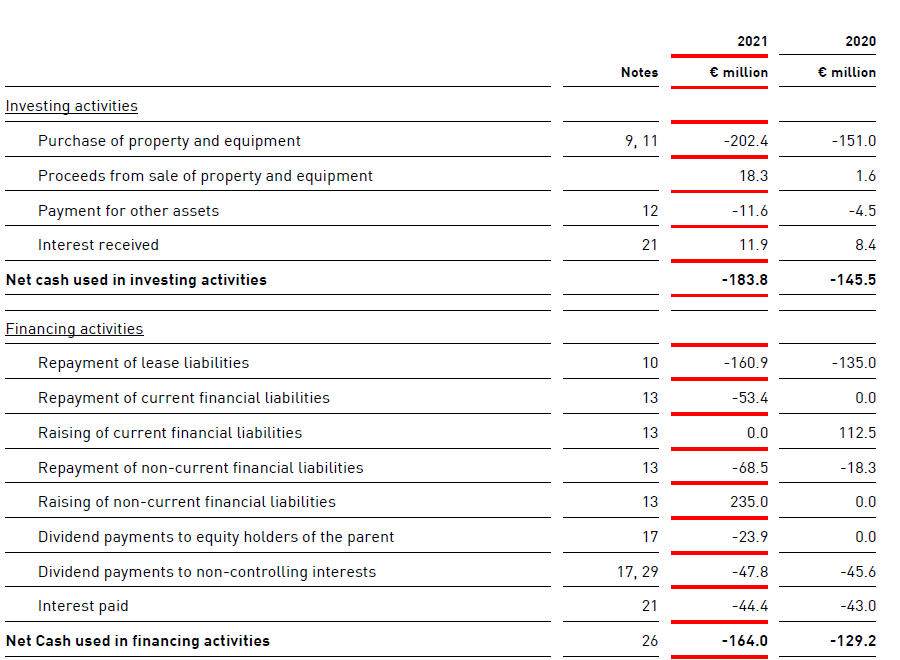
However, there are some other adjustments we still need to make. We should deduct the 48M EUR paid to the non-controlling interests while we also should deduct the 161M EUR in lease payments as well as the 44.4M EUR in interest payments (consisting of the interest payments on both the financial debt as well as the lease liabilities). And to be consistent, we should also add the 11.9M EUR in received interest payments into account.
Puma Investor Relations
That would result in an adjusted operating cash flow of 451M EUR. The total capex was approximately 202M EUR which means Puma generated a free cash flow result of 249M EUR which is just under 1.70 EUR per share. Disappointing? Yes. But we clearly see the combination of capex (202M EUR) and lease payments (161M EUR) for a total of 363M EUR is quite a bit higher than the 306M EUR in depreciation and amortization expenses for the year.
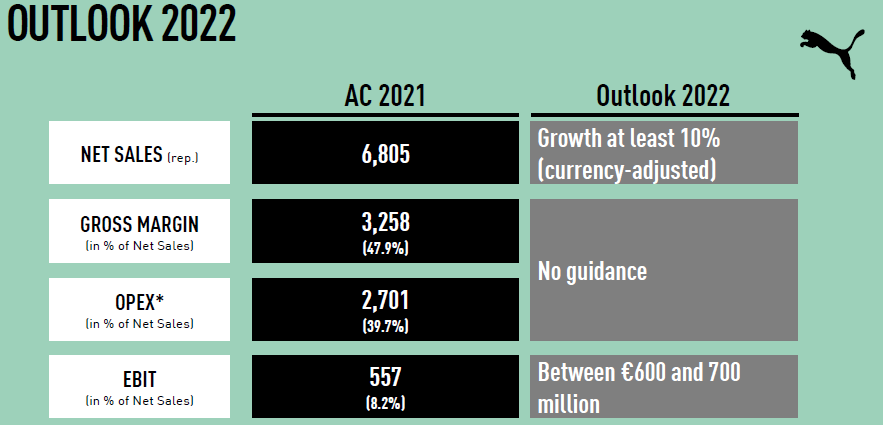
For 2022, Puma expects to report a double digit revenue growth which should trickle down to the net income level as well. Whereas the EBIT in 2021 was approximately 557M EUR, Puma is now guiding for a full-year EBIT of 600-700M EUR which would be an increase of 8%-26%. Given the current situation in Europe and how inflation is making its way through all supply chains and as it will likely rattle consumer confidence levels, perhaps we should aim for the lower end of the official EBIT guidance.
Puma will continue to invest in itself in 2022 and the total capex will once again be substantially higher than in 2021. Puma expects to invest 220M EUR in “fixed assets” this year as the company continues to build out its infrastructure to support the long-term growth plans.
Puma Investor Relations
Investment thesis
Puma has digested the weak performance in 2020 and despite being impacted by supply chain issues and temporary store closures, Puma saw its net income and free cash flow increase by a triple-digit percentage. That’s great but that still doesn’t make the stock cheap.
Puma is currently trading at about 35 times its 2021 earnings, but we can likely expect an EPS increase of about 10% in 2022 if the company is indeed able to hike its revenue and EBIT as expected. Considering Puma has a positive net cash position of approximately 375M EUR (excluding lease liabilities) and generated an EBITDA of approximately 700M EUR (again, excluding lease related liabilities and depreciation expenses), the stock is trading at an EV/EBITDA ratio of 15.
As Puma is a growth story, perhaps we give more weight to the future. The analyst consensus estimate calls for an EBITDA of 1.37B EUR in 2024. If I would assume about 190M EUR will be lease-related, the underlying EBITDA excluding leases would be around 1.18B EUR and that would reduce the forward EV/EBITDA to less than 9, making Puma a whole lot more appealing as an investment and trading in line with European competitor Adidas.
I currently have no position in Puma but I will keep an eye on how the company performs in the near future.
Be the first to comment