

Thinkhubstudio/iStock via Getty Images
THB International (ex-USA) Micro Cap Fund ─ Class W Quarterly Report – Q3 2022
|
Fund details |
|
|
Benchmark |
MSCI World ex USA Small Cap Total Return Index (AUD)2 |
|
Inception date |
23 August 2018 |
|
Fund size |
A$81.7 million |
|
Net performance – 30 September 2022 |
|||
|
Fund1 |
MSCI World ex USA Small Cap®2 |
MSCI World ex USA Micro Cap®3 |
|
|
1 month |
(5.7%) |
(5.5%) |
(5.8%) |
|
3 months |
(3.9%) |
(3.2%) |
(3.4%) |
|
1 year |
(31.3%) |
(22.3%) |
(21.9%) |
|
2 years p.a. |
(5.7%) |
0.2% |
2.6% |
|
3 years p.a. |
0.2% |
0.3% |
3.8% |
|
Since inception |
(0.5%) |
0.8% |
2.2% |
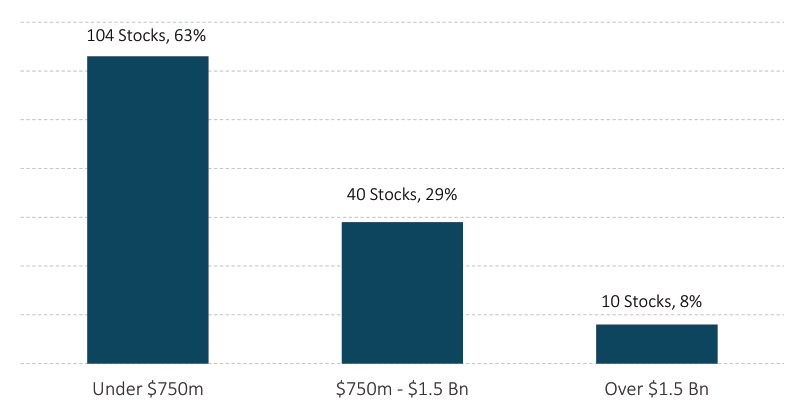
Companies by market capitalization
|
Source: THB Asset Management
|
Market commentary
The MSCI World ex USA Small Cap® Index ((Index)) returned-3.2% in Q3 2022.
Energy (-1.4%) was the best performing sector, followed by Materials (-5.5%) and Financials (-8.5%). Communication Services (-15.2%) was the worst performing sector, followed by Real Estate (-13.3%) and Consumer Staples (-11.4%).
Israel (-1.9%) was the best performing country, followed by New Zealand (-4.4%) and Japan (-4.6%). Germany (-19.1%), Hong Kong (-16.8%), and United Kingdom (-16.5%) were the worst performing countries in the Index.
International Equities ended the quarter broadly lower despite a very strong start in July. September was the worst month in Q3 driven by a number of factors including the rise in global interest rates, energy security in Europe and increasing investor fears going into the Q3 earnings season despite easing inflationary pressures and supply chain dynamics. September also saw the dollar strengthening to the highest level in over 20 years.
Although the Fed rate hike was followed by ECB, BoE and other central banks, they failed to keep up with Fed’s pace. The BoJ intervened to keep the yen from weakening past 145 per dollar, while the BoE announced it would purchase gilts in an effort to support sterling after hitting a record low of 1.03 per dollar.
Both opportunities and risks are emerging real time creating an ideal time for active management and some of these are discussed below.
Semiconductor capacity expansion in multi-year investment cycle
The unprecedented supply chain challenges over the past two years revealed the global dependence on semiconductor-enabled technologies. The chip shortage, which led to forced factory closures in a large number of sectors from car manufacturers to healthcare equipment manufacturing, increased awareness of the supply chain vulnerabilities and the strategic value of having localised production.
The future chip demand across industrial ecosystems is expected to double between 2022 and 2030, alongside a significant increase in demand for wafers according to the European Chips Survey report published in July this year.
While utilisation rates are above historical levels and construction plans are underway for new semiconductor fabs to address the current microchip shortage, governments around the world are also focusing their policies on increasing investments in chip production and development to prevent future supply crisis.
Government policies have played a major role in the strong growth of manufacturing technology and capacity in Asia. At the same time, the US has fallen behind Asia in manufacturing technology particularly for logic. In fact, according to a recent SIA/BCG report, there is currently no cutting-edge logic capacity below 10 nanometers being done in the US, Europe or Japan. Currently, most 7nm and 5nm semiconductors are produced in Taiwan and South Korea but reliance on these countries carries significant risk.
The US government is fostering a shift toward domestic production capacity through policies such as the CHIPS Act of 2022, which passed in August 2022, providing $52.7 billion in subsidies for US semiconductor production and research to boost competitiveness with China. This includes $39 billion in manufacturing incentives and also provides a 25 percent investment tax credit for capital expenses for manufacturing of semiconductors and related equipment.
Similarly, the EU Chips Act aims to address semiconductor supply shortages and years of decline in semiconductor investment in the EU, aiming to increase the Europe’s share of global chip production capacity to 20% from its current level of about 10%. The total EU investment from the EU Chips Act consists of an identified $43 billion, which is anticipated to spur additional private-sector investments of an equal amount, bringing the total to some $86 billion. The Act is expected to be adopted in the first half of 2023 and has already had an impact on major semiconductor companies’ investment decisions.
For both Japan, once the world’s largest chip maker, and the United States, the birthplace of the semiconductor, a decades-long erosion of their chip-making capacities has left them playing catch-up. The Japanese government has renewed its efforts to encourage the nation’s semiconductor industry towards a more globally competitive business model. In 2021, the Japanese government approved 774 billion yen (~$6.8 billion) in funding for domestic semiconductor investment.
In July this year, Japan announced it will provide a subsidy up to 92.9 billion yen ($680 million) to Kioxia Corp. and Western Digital Corp. (WDC) for a semiconductor production facility as part of efforts to secure stable domestic chip production. In a break with its past economic nationalism, it is also seeking to form a coalition with allies such as the US and the European Union to build a semiconductor supply chain that is less geographically concentrated and so better insulated from disasters and geopolitical instability.
Beyond providing inputs to nearly every industry, the semiconductor industry is generating value for the economy, stimulating jobs, and paying high- income to workers. Oxford Economics estimate a $50 billion federal investment program to incentivise domestic semiconductor manufacturing would add $24.6 billion annually to the US economy and would create an average of 185,000 temporary jobs annually throughout the US economy from 2021 to 2026.
The spillover impact of the economies of Europe, Japan and US are yet to be seen but the announced investments give hope that these policies will drive economic growth and jobs in the developed regions. Smaller companies are also to benefit providing components and services and getting access to more reliable supply chain.
Portfolio commentary
The THB International (ex-USA) Micro Cap Fund returned -3.9% (net of fees) in Q3 2022.
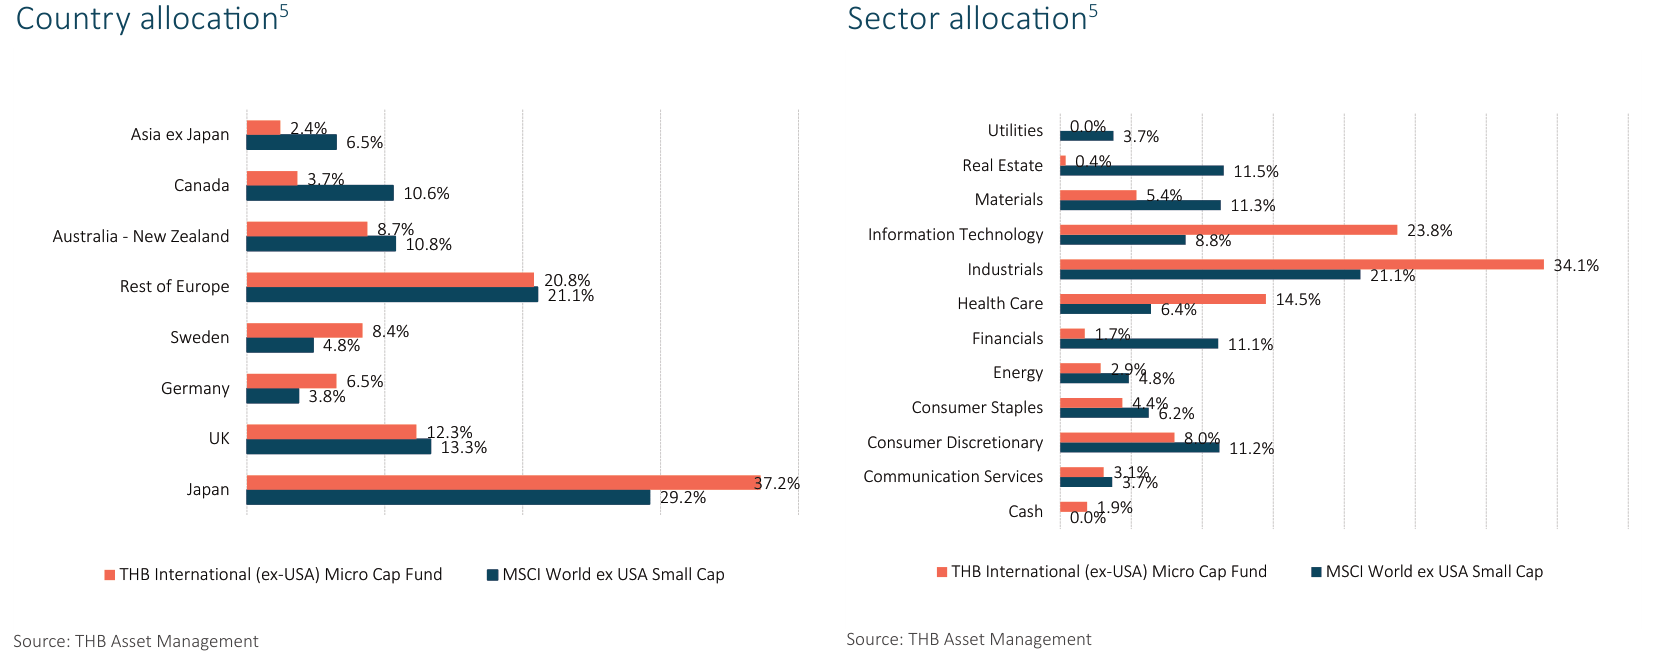
Contributors to the portfolio’s performance were stock selection in United Kingdom and Australia as well as under allocation to Canada. Detractors from performance included stock selection in Canada and Japan as well as overallocation to Sweden.
From a sector perspective, primary contributors to performance mainly came from under allocation to Real Estate, stock selection in Consumer Discretionary, and overallocation to Information Technology. Stock selection in Real Estate and Materials as well as overallocation to Health Care were primary detractors to performance this quarter.
THB’s top five performing stocks (from a contribution standpoint) were Basler AG (BSLAF, Germany, Information Technology, +1.00%); u-blox Holding AG (UBLXF, Switzerland, Information Technology, +0.30%); Lovisa Holdings Ltd. (Australia, Consumer Discretionary, +0.30%); Hexatronic Group AB (HTROF, Sweden, Industrials, +0.22%), and PWR Holdings Ltd. (PWRHF, Australia, Consumer Discretionary, +0.17%).
The bottom five performing stocks (from a contribution standpoint) were Swedencare AB (SWDCF, Sweden, Health Care, -0.37%), Focusrite PLC (United Kingdom, Consumer Discretionary -0.35%), secunet Security Networks AG (Germany, Information Technology, -0.33%), Xvivo Perfusion AB (XVIPF, Sweden, Health Care, -0.28%), and Wesdome Gold Mines (WDOFF, Canada, Materials, -0.26%).
The strategy’s companies continue to deploy capital with the goal of increasing shareholder value. They announced 17 share repurchase authorisations and 28 acquisitions in the third quarter.
Stocks in focus
AEM Holdings (OTCPK:AEMFF)
THB initiated a position in AEM Holdings during Q3. AEM Holdings is a Singapore-based company which is the leading global designer and manufacturer of High-Density Modular Testers for the semiconductor industry. AEM Holdings is uniquely positioned to benefit from increased investment of Intel in Europe and US chip manufacturing.
AEM Holdings is critical to the supply chain of Intel, the largest chip manufacturer in the United States. Their machines are used to test the function of computer chips at the factory to ensure that they can be relied upon for mission critical tasks. Chip manufacturers are significantly increasing their budgets towards test equipment because chip designs are becoming highly complex due to newer advanced packaging designs and thermal containment challenges.
The government subsidies will allow Intel to invest into and expand their domestic production facilities, which will require higher spend on their testing equipment and create increased demand for AEM Holding’s High Density Modular Testers.
Further, the company has grown sales from almost USD 51M to USD 421M last year and plans to supplement their growth by acquiring defensible businesses which give them access to new products and customers.
LANDIS+GYR (OTCPK:LDGYY)
A portfolio company which is directly addressing the current energy issues in Europe is Landis+Gyr. Founded in 1896, L+G is a Swiss company that is one of global leaders of energy management solutions. The firm offers a full range of products from hardware (electricity and grid meters, residential and industrial meters) and software for grid management and analytics which integrates in the existing utility infrastructure.
In addition, energy management systems play an essential role as companies all over the world increasingly focus on sustainable development. Key European projects the company participates in include:
- UK Smart Metering Implantation Programme, an energy industry led programme rolling-out approximately 53 million smart electricity and gas meters in Great Britain.
- In France 35 million residential meter upgrade by Enedis, public service company that manages the public electricity distribution network for 95% of continental France.
- In Belgium, program by Fluvius System Operator to roll out up to 3.36 million smart meters.
Europe has offset the sharp falls in Russian gas supplies through LNG imports, as well as alternative pipeline supplies from Norway and elsewhere. Europe is driving demand for LNG – more than doubled in first nine months of 2022 from a year earlier. The IEA forecasts that Europe’s LNG imports will increase by over 60 billion cubic meters (BCM) this year.
Portfolio statistics4
|
As at 30 September 2022 |
||
|
Fund |
Benchmark |
|
|
Weighted avg market cap |
US$733m |
US$2,155m |
|
Price/sales |
1.4x |
0.9x |
|
Price/Book |
2.6x |
1.2x |
|
Dividend yield |
1.9% |
3.2% |
|
Number of securities |
154 |
2,563 |
|
Standard deviation |
19.9% |
17.2% |
|
Sharpe ratio |
0.4 |
|
|
Beta |
1.1 |
|
|
Tracking error |
6.6 |
|
|
Information ratio |
0.8 |
|
Source: THB Asset Management |
Top 10 holdings5
|
Stock |
Sector/Country |
Weight |
|
u-blox Holding AG (OTCPK:UBLXF) |
Technology/Switzerland |
1.7% |
|
Judges Scientific plc |
Industrials/UK |
1.5% |
|
Johns Lyng Group Ltd |
Industrials/Australia |
1.3% |
|
PWR Holdings Ltd (OTCPK:PWRHF) |
Consumer Disc/Australia |
1.3% |
|
Shoei Co Ltd (OTCPK:SHOFF) |
Consumer Disc/Japan |
1.3% |
|
Kainos Group PLC (OTCPK:KNNNF) |
Technology/UK |
1.2% |
|
El.En S.p.A. (OTCPK:ELEAF) |
Health Care/Italy |
1.2% |
|
NEXUS AG |
Health Care/Germany |
1.2% |
|
Hexatronic Group AB (OTCPK:HTROF) |
Industrials/Sweden |
1.1% |
|
SeSa S.p.A. (OTCPK:SESPF) |
Technology/Italy |
1.1% |
|
Source: THB Asset Management |
| 1. Performance figures are presented in AUD on a net, pre-tax basis and assume the reinvestment of distributions. Past performance is not an indicator of future performance. Fund inception date was 23 August 2018 however inception performance for this class is calculated from 7 September 2018.2. The MSCI World ex-USA Small Cap Total Return Index (AUD) captures small cap representation across 22 of 23 Developed Markets (DM) countries (excluding the United States). With ~2,496 constituents, the Index covers approximately 14% of the free float-adjusted market capitalisation in each country. Source: MSCI3. The MSCI World ex USA Micro Cap Index captures micro cap representation across 22 of 23 Developed Markets (DM) countries (excluding the United States). With ~4,735 constituents, the index covers approximately 1% of the free float-adjusted market capitalisation in each country.4.Portfolio statistics are reported in USD.5. Portfolio holdings and allocations are subject to change and should not be considered as investment recommendations to trade individual securities. The securities identified and described do not represent all of the securities purchased, sold or recommended for client accounts. The reader should not assume that an investment in the securities identified were or will be profitable. There is no assurance that any securities discussed herein will remain in the portfolio at the time you receive this report, or that securities sold have not been repurchased. There can be no assurance that investment objectives will be achieved. A full list showing every holding’s contribution to the overall account’s performance during the measurement period and calculation methodology is available upon request. |
Investment strategyTHB Asset Management (THB), an investment franchise of Victory Capital Management Inc., is a dedicated micro and small cap specialist investment franchise based in Connecticut, USA. Founded in 1982, THB Asset Management has 39 years’ experience investing in micro and small cap companies. THB’s International Opportunities strategy is based on the belief that there are inefficiencies in the micro cap segment of the market due to lack of analyst coverage, limited investable options, resource constraints and difficulty in identifying value. THB utilises a disciplined, fundamental approach that blends both qualitative and quantitative methods to construct a well-diversified, low risk portfolio of companies that possess attractive operating metrics, yet with comparable valuation to the MSCI World ex USA Small Cap® Index. This document has been prepared and issued by Victory Capital Management Inc.(Victory) (AFSL 528472) and is intended for the general information of ‘wholesale clients’ (as defined in the Corporations Act 2001) only. Victory is not licensed to provide financial services to retail clients in Australia.. Victory is regulated by the Securities and Exchange Commission of the United States of America under US laws, which differ from Australian laws. Equity Trustees Limited (Equity Trustees) (ABN 46 004 031 298, AFSL 240975) is a subsidiary of EQT Holdings Limited (ABN 22607 797 615), a publicly listed company on the Australian Securities Exchange ([(ASX:EQT)) . Equity Trustees is the Responsible Entity of the THB International (ex-USA) Micro Cap Fund (ARSN 623 620 744). This document is neither an offer to sell or a solicitation of any offer to acquire interests in any investment. The information contained in this document is of a general nature only. Accordingly, reliance should not be placed on this information as the basis for making an investment, financial or other decision. In preparing this document, Victory has not taken into account the investment objectives, financial situation and needs of any particular person. Before making any investment decision, you should consider whether the investment is appropriate in light of those matters. Whilst every effort is taken to ensure the information in this document is accurate, Victory and Equity Trustees provides no warranty as to the accuracy, reliability and completeness of the information in this document and you rely on this information at your own risk. To the extent permitted by law, Victory and Equity Trustees disclaims all liability to any person relying on the information contained in this document in respect of any loss or damage (including consequential loss or damage) however caused, which may be suffered or arise directly or indirectly in respect of such information. Past performance is not a reliable indicator of future performance. The return of capital or any particular rate of return from the Fund is not guaranteed. You should obtain and consider the Fund’s Product Disclosure Statement (PDS) before deciding whether to acquire, or continue to hold, an interest in the Fund. Applications can only be accepted on an application form attached to a current Product Disclosure Statement. Neither Victory, Equity Trustees nor any of its related parties, their employees or directors, provide and warranty of accuracy or reliability in relation to such information or accepts any liability to any person who relies on it. THB International (ex-USA) MIcro Cap Fund’s Target Market Determination available here. A Target Market Determination is a document which is required to be made available from 5 October 2021. It describes who this financial product is likely to be appropriate for (i.e. the target market), and any conditions around how the product can be distributed to investors. It also describes the events or circumstances where the Target Market Determination for this financial product may need to be reviewed. |
Editor’s Note: The summary bullets for this article were chosen by Seeking Alpha editors.
Be the first to comment