

piranka
This dividend ETF article series aims at evaluating products regarding the relative past performance of their strategies and quality metrics of their current portfolios. As holdings and weights change over time, updated reviews are posted when necessary.
TDIV strategy and portfolio
The First Trust NASDAQ Technology Dividend Index Fund (NASDAQ:TDIV) has been tracking the NASDAQ Technology Dividend Index since 8/13/2012. It has 95 holdings, a distribution yield of 2.81% and a total expense ratio of 0.5%. It pays quarterly distributions.
As described on NASDAQ website, the index “includes up to 100 Technology and Telecommunications companies that pay a regular or common dividend”.
To be eligible, stocks must have at least $500 million in market capitalization, $1 million in 3-month average daily traded value, 0.5% in dividend yield, be listed on a US stock exchange and be classified in Technology or Telecommunications by the Industry Classification Benchmark. Companies are excluded if they have decreased the dividend per share in the past 12 months, entered into a definitive M/A agreement or filed for bankruptcy or similar protection. A maximum of 100 companies passing these rules are included in the Index: those with the highest dividend per share over the last 12 months. The index is reconstituted twice a year and rebalanced quarterly based on a modified dividend value-weighted methodology with weight limits and sector constraints (80% in technology, 20% in telecommunications).
The fund invests mostly in U.S. companies (about 85%), and in large and mega caps (84%). The top 10 holdings, listed below, weigh 57% of asset value. Exposure to the top 5 names is quite high (over 7% each). Other holdings are below 5%.
|
Ticker |
Name |
Weight |
EPS growth %TTM |
P/E TTM |
P/E fwd |
Yield% |
|
International Business Machines Corp. |
8.39% |
3.84 |
19.13 |
12.67 |
5.61 |
|
|
Apple Inc. |
8.17% |
18.52 |
23.20 |
23.02 |
0.66 |
|
|
Broadcom Inc. |
8.02% |
70.17 |
19.07 |
11.66 |
3.75 |
|
|
Microsoft Corp. |
8.02% |
19.73 |
23.77 |
22.68 |
1.19 |
|
|
Intel Corp. |
7.22% |
3.70 |
5.40 |
11.36 |
5.79 |
|
|
Texas Instruments Incorporated |
4.34% |
27.50 |
17.15 |
16.62 |
3.16 |
|
|
QUALCOMM Inc. |
3.96% |
41.01 |
10.16 |
9.13 |
2.62 |
|
|
Oracle Corp. |
3.86% |
-55.28 |
29.72 |
12.63 |
2.05 |
|
|
Taiwan Semiconductor Manufacturing Co. Ltd. |
2.90% |
37.98 |
13.02 |
11.25 |
2.73 |
|
|
Analog Devices, Inc. |
2.42% |
-20.97 |
39.02 |
14.93 |
2.16 |
The heaviest industries are semiconductors (37.3%), followed by software (14.8%) and hardware (12.9%). Compared to the Technology Select Sector SPDR Fund (XLK), TDIV massively overweights semiconductors.
TDIV industry breakdown (chart: author; data: ftportfolios.com and Fidelity)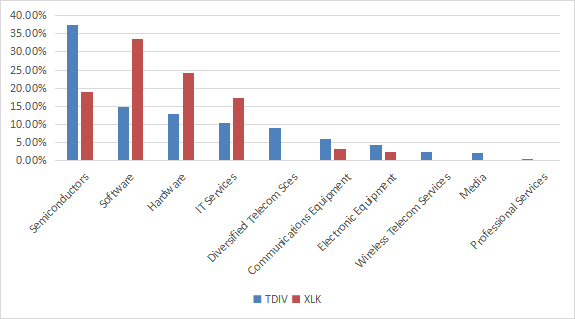
Regarding valuation ratios (table below), TDIV is significantly cheaper than the S&P 500 (SPY) and the sector benchmark (XLK).
|
TDIV |
XLK |
SPY |
|
|
Price/Earnings TTM |
12.93 |
21.83 |
17.98 |
|
Price/Book |
2.87 |
6.79 |
3.38 |
|
Price/Sales |
1.96 |
4.93 |
2.18 |
|
Price/Cash Flow |
8.59 |
17.03 |
13.63 |
Data: Fidelity
TDIV past performance
Since September 2012, TDIV has underperformed the S&P 500 by about one percentage point in annualized return. It is farther behind the sector benchmark, by 5.4 percentage points annualized. The next table provides detailed performance and risk metrics. The chart below compares the 3 funds in 2022 to date. TDIV is slightly ahead of XLK this year.
|
since 9/1/2012 |
Total Return |
Annual.Return |
Drawdown |
Sharpe ratio |
Volatility |
|
TDIV |
181.86% |
10.80% |
-31.50% |
0.69 |
16.11% |
|
SPY |
209.76% |
11.84% |
-32.05% |
0.8 |
14.41% |
|
XLK |
354.41% |
16.17% |
-32.44% |
0.9 |
17.75% |
TDIV vs. XLK and SPY in 2022 (Portfolio123)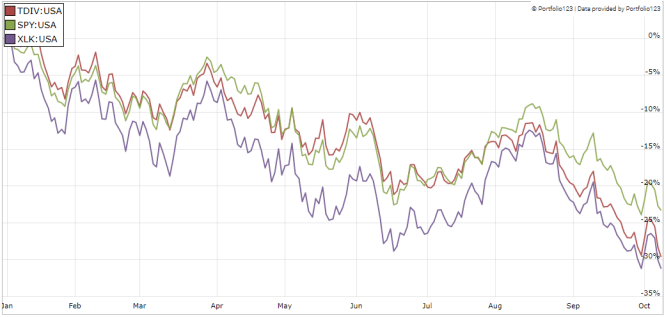
In previous articles, I have shown how three factors may help cut the risk in a dividend portfolio: Return on Assets, Piotroski F-score, and Altman Z-score.
The next table compares TDIV since inception with a subset of the S&P 500: stocks with a dividend yield above the average of their respective indexes, an above-average ROA, a good Altman Z-score, a good Piotroski F-score, and a sustainable payout ratio. It is rebalanced annually to make it comparable with a passive index.
|
since 9/1/2012 |
Total Return |
Annual.Return |
Drawdown |
Sharpe ratio |
Volatility |
|
TDIV |
181.86% |
10.80% |
-31.50% |
0.69 |
16.11% |
|
Dividend & quality subset |
261.49% |
13.56% |
-37.34% |
0.88 |
14.66% |
Past performance is not a guarantee of future returns. Data Source: Portfolio123
TDIV underperforms the dividend and quality subset. However, TDIV return is real, whereas the subset performance is hypothetical. My core portfolio holds 14 stocks selected in this subset (more info at the end of this post).
Scanning TDIV with quality metrics
Among the 93 stocks held by the fund, 11 are risky regarding my metrics. In my ETF reviews, risky stocks are companies with at least 2 red flags: bad Piotroski score, negative ROA, unsustainable payout ratio, bad or dubious Altman Z-score, excluding financials and real estate where these metrics are less relevant. Here, risky stocks weigh 9.4% of asset value, which is rather a good point.
The weighted Piotroski F-score of the portfolio is similar to the S&P 500, but the ROA is much better, and the Altman Z-score is good too. In summary, the portfolio’s quality is superior to the benchmark.
|
TDIV |
SPY |
|
|
Altman Z-score |
4.3 |
3.3 |
|
Piotroski F-score |
6.0 |
5.9 |
|
ROA% TTM |
14.62 |
7.49 |
Takeaway
TDIV has a portfolio of dividend stocks in technology and telecommunication. Asset value is quite concentrated in semiconductors (37%) and in the top 5 holdings. Regarding valuation metrics, TDIV looks more attractive than the sector benchmark and the S&P 500. It is superior to the S&P 500 also in quality metrics. However, total return since inception is underwhelming relative to the sector and the broad market. For transparency, a dividend-oriented part of my equity investments is split between a passive ETF allocation (TDIV is not part of it) and my actively managed Stability portfolio (14 stocks), disclosed and updated in Quantitative Risk & Value.
Be the first to comment