

stevecoleimages
A Bear of a Market
With the first half of 2022 behind us, the best that can be said about the current market is “good riddance.” As shown in the bar chart, the currency hedged developed international market was the top performer with a –9.9% return. The second–best performing asset class was the 10–year U.S. Treasury Bond with a loss of 12.1%. The S&P 500 Index finished the first half down 20.0% and entered bear market territory in June.
H1 2022 Asset Class Performance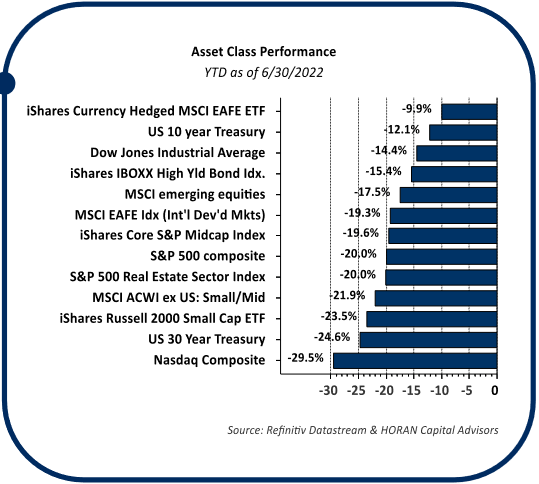
It is likely not a surprise to investors the S&P 500 Index Energy sector is leading the pack in return this year, up 31.8%. The next best sectors are Utilities and Consumer Staples with declines of 0.6% and 5.6% respectively. As of June 30th, the worst-performing sectors for the year are Discretionary, Communication Services and Technology. These sectors have a cyclical bias to them, and thus, the slowing economy served as a headwind in the first half.
2022 Midway Market Overview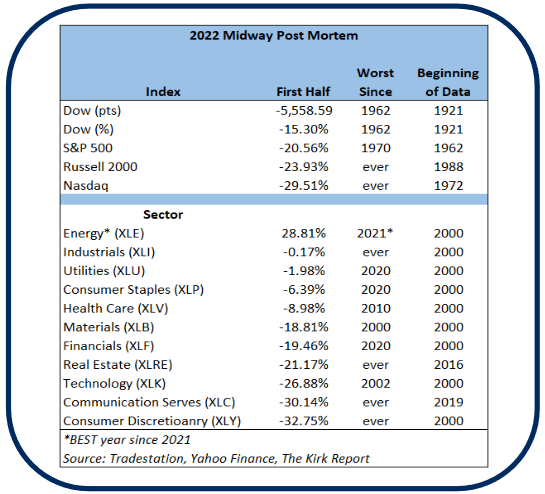
As seen in the bar chart, investors had few areas to invest in that generated a positive return. With inflation running at an annual rate of 8.5%, commodities broadly and gold specifically generated positive year-to-date returns. Cash held its value, but not in real terms after factoring in the effects of inflation. In summary, this year has been one for the record books. Inflation is at a level last seen in 1982, the S&P 500 return this year is its worst start to a year since 1970, and it is the worst start for the Dow Jones Industrial Average Index since 1962.
Anatomy of a Slowdown
After a negative GDP growth rate in the first quarter, a focus will be on results for second-quarter GDP. The first quarter’s final real GDP growth rate was reported at a negative 1.6%. The Atlanta Federal Reserve Bank tracks the economic growth rate as data is reported in a measure known as GDPNow.
The most recent GDPNow reading estimates second-quarter GDP will be reported at negative 1.2%. If accurate, this means the economy will have two quarters of negative real GDP growth, which is some economists’ definition of a recession.
The image below provides a framework for the order of progression in which economic data typically weakens as the economy moves toward a recession. Housing is the first area of the economy that begins to weaken, followed by manufacturing new orders, then corporate profits, and finally, the employment portion of the economy weakens. To date, housing and new orders data have both weakened. May new home sales of 696 thousand are down from over 1 million units in August 2020. Existing home sales are down over 18% from January 2021. June’s ISM Manufacturing New Orders Index was reported at 49.2, and readings below 50 are contractionary readings. Companies are beginning to report their latest quarterly earnings, so more insight will be provided on corporate profits over the next month and a half. To date, earnings have held up reasonably well, but analysts are beginning to lower earnings growth expectations. If earnings growth expectations continue to be reduced, the fourth leg of the chair – employment – could begin to see weakness as well.
Earliest Indicators To Turn As Economy Moves Towards Recession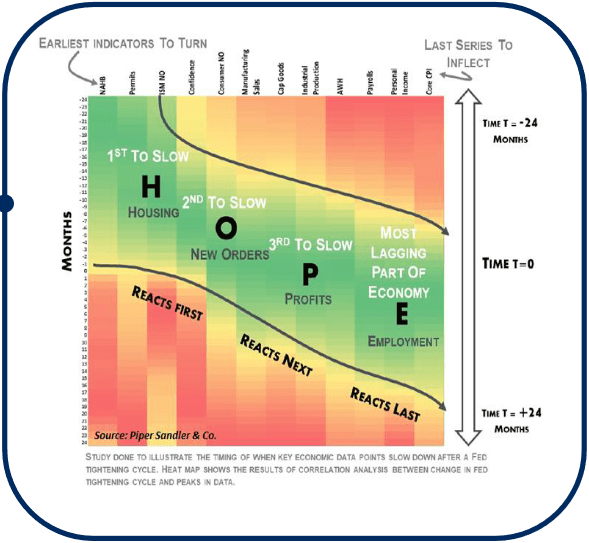
Weak consumer confidence has an influence on the new orders and manufacturing data. As consumer confidence weakens, this typically leads to lower spending levels. The following chart shows a record-low reading in the University of Michigan’s June Consumer Sentiment Index. Despite the current weak sentiment reading, actual consumer spending activity has remained strong, with May retail sales equaling $672 billion as illustrated by the maroon line in the chart.
Retail Sales Vs. Sentiment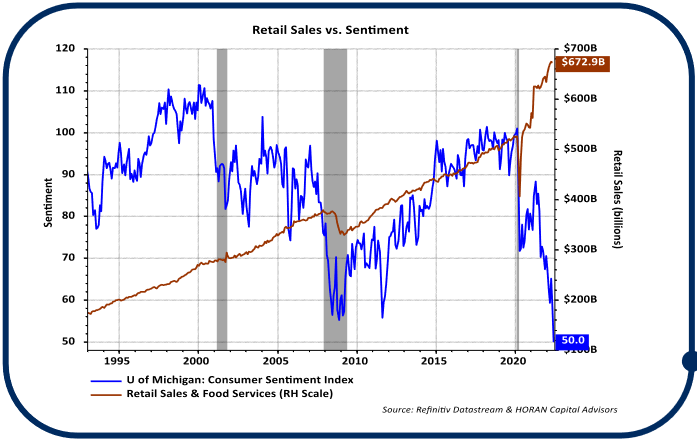
Inflation and Oil
Oil prices have risen since the end of the pandemic, and more so since the beginning of the year. Several of our prior Investor Letters discussed rising energy prices broadly and its influence on higher levels of inflation. Higher oil prices are a direct cost to consumers, as oil is refined into motor fuels/gasoline. Oil is also the principal component of many manufacturing and chemical products like plastics and fertilizers. The increased input costs are getting passed on to the consumer in the form of product price increases. The May CPI reading was 8.6% on a year-over-year basis, and the CPI energy category saw an increase of 34.6% –the largest of any category. As the chart below shows, oil prices rose significantly coming out of the pandemic and remain elevated with a year-over-year price increase of 59%. Energy prices can be volatile, and we have recently seen the price of a barrel of West Texas Intermediate crude oil briefly fall below $100, down from over $120 per barrel at the beginning of June.
Recessions And Oil Price Rise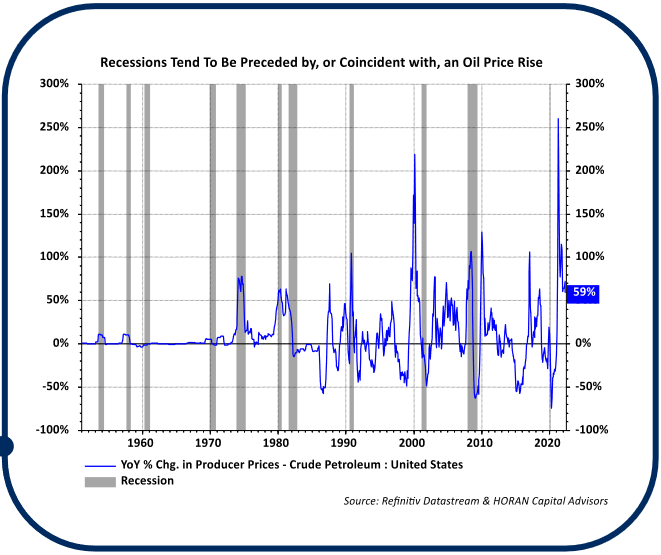
The Fed Remains a Factor
With elevated energy prices and higher levels of inflation, the Fed is expressing their intent to continue raising short-term interest rates in an effort to reduce demand pressure on prices. The current FOMC rate projection is for the Federal Reserve to raise the Federal Funds rate to 3.4% by the end of 2022, which would represent over 6 additional 25-basis point rate increases from where rates are today. However, Fed Chairman Jerome Powell has made comments that many factors impacting inflation now may be outside of the Fed’s control. For example, the Fed has virtually no control over supply chain issues. Along with raising interest rates, the Fed is determined to shrink its balance sheet. Instead of reinvesting proceeds of maturing securities, monthly, the Fed will allow up to $95 billion in Treasury and mortgage–backed securities to mature and run off of its balance sheet. If bond maturities are less than the stated $95 billion, the Fed would sell existing bonds to make up the difference. This action reduces liquidity in the monetary system and further tightens financial conditions. The Fed will need to carefully balance tighter monetary policy and the concurrent offset to economic growth to achieve the“soft landing” it is targeting.
A Second-Half Market Recovery
As noted at the outset of the Investor Letter, investors have been challenged, as a significant percentage of asset classes generated negative returns in the first half of the year. The equity market tends to be a leading indicator, and its performance can be an indication of future economic activity. As such, might much of the anticipated weaker economic environment already be priced into stocks?
The table below shows future stock market returns after quarters experiencing declines of 15%+ and two quarters seeing declines over 20%+, both of which have occurred this year. With equity markets, nothing seems absolute, so further downside is not out of the question; however, many stocks have experienced declines greater than the overall market. We believe recession odds are greater than 50%, but do not believe a recession would be severe and protracted given there do not seem to be a lot of excesses in the economy currently.
Future Stock Market Returns After Quarterly Declines Of 15%+ And Two Quarters With Declines Of 20%+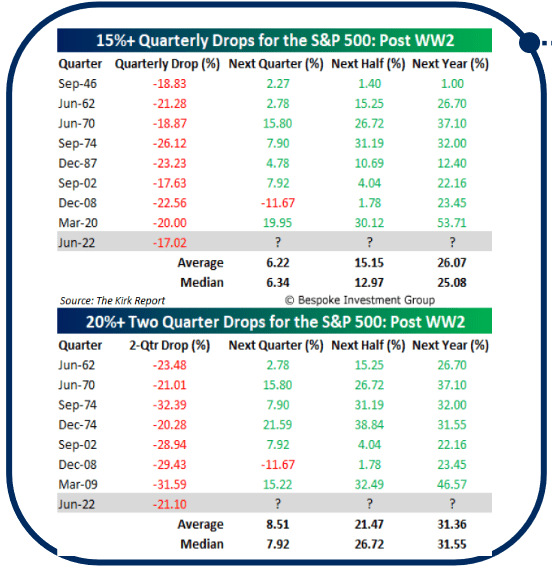
Another potential catalyst for a second-half market rally could be the midterm elections set to take place in November this year. As the chart below shows, the S&P 500 has historically produced strong positive results in the 12 months following the election. The average one–year return after a midterm election for the S&P 500 is 15.1%. One reason for this market rally is the response to the removal of the uncertainty of the election outcome. Importantly, this is independent of which political party may retain or gain control of the House and Senate.
Market Returns After Midterm Elections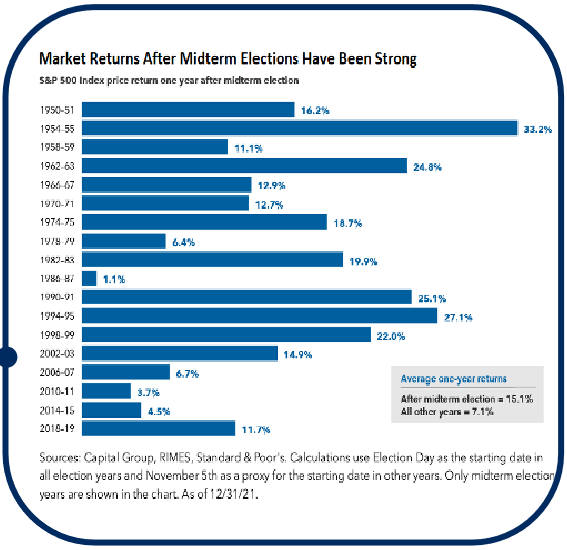
Thank you for your continued confidence and support in HORAN Capital Advisors.
Editor’s Note: The summary bullets for this article were chosen by Seeking Alpha editors.
Be the first to comment