

Jacob Wackerhausen/iStock via Getty Images
The Strategy Shares Nasdaq 7 HANDL Index ETF (NASDAQ:HNDL) has an interesting concept: pairing a momentum-based yield portfolio with core bond and equity funds. However, in reality, the complex investment strategy underperforms a simple balanced fund like the Vanguard Balanced Index Fund Admiral Shares (VBIAX). The HNDL ETF does pay a high distribution yield of 7% of NAV. But with low investment returns, investors are just being paid their own capital. I would stay away from HNDL.
Fund Overview
The Strategy Shares Nasdaq 7HANDL Index ETF aims to target a 7% distribution yield. The fund has attracted $1.18 billion in assets.
Strategy
The HNDL ETF seeks to track the investment results of the Nasdaq 7HANDL Index. The index is split into two sleeves: 50% is allocated to a ‘core portfolio’ that is invested in ‘core’ fixed income and equity ETFs in a 70/30 ratio. Another 50% is allocated to a ‘Dorsey Wright Explore Portfolio’, a tactical allocation portfolio that invests in a variety of asset classes that have historically provided high levels of income.
The core fixed income portfolio (35% of total assets) is split equal weight between the 3 lowest-cost aggregate bond ETFs in the market. Half of the core equity portfolio (7.5% of total) is split equal weight between the 3 lowest-cost U.S. large cap equity ETF, while the remaining half of the core equity portfolio (7.5%) is allocated to the largest ETF that tracks the Nadaq-100 Index.
The Explore portfolio is a rules-based momentum portfolio that provides exposure to non-levered ETFs across 12 asset categories: Dividend Equity, Option Overlay, High-Yield Bonds, Investment Grade Bonds, MLPs, Mortgage-Backed Securities, Active Fixed Income, Preferred Securities, REITs, Growth & Income, and Utilities. Each asset category is represented by a single ETF that is typically the largest ETF by assets in that category, unless there is an ETF with significantly lower costs (20%) than the largest ETF.
The index also employs leverage (30% gross leverage) to enhance returns.
The HNDL ETF has adopted a policy to pay monthly distributions that target an annualized 7% of the fund’s NAV.
Portfolio Holdings
The fund’s top 10 holdings are shown in Figure 1. The top 10 holdings comprise 76% of the fund. However, note that these are all broadly diversified ETFs in their respective asset classes, so by extension, the HNDL ETF is broadly diversified.
Figure 1 – HNDL top 10 positions (strategysharesetfs.com)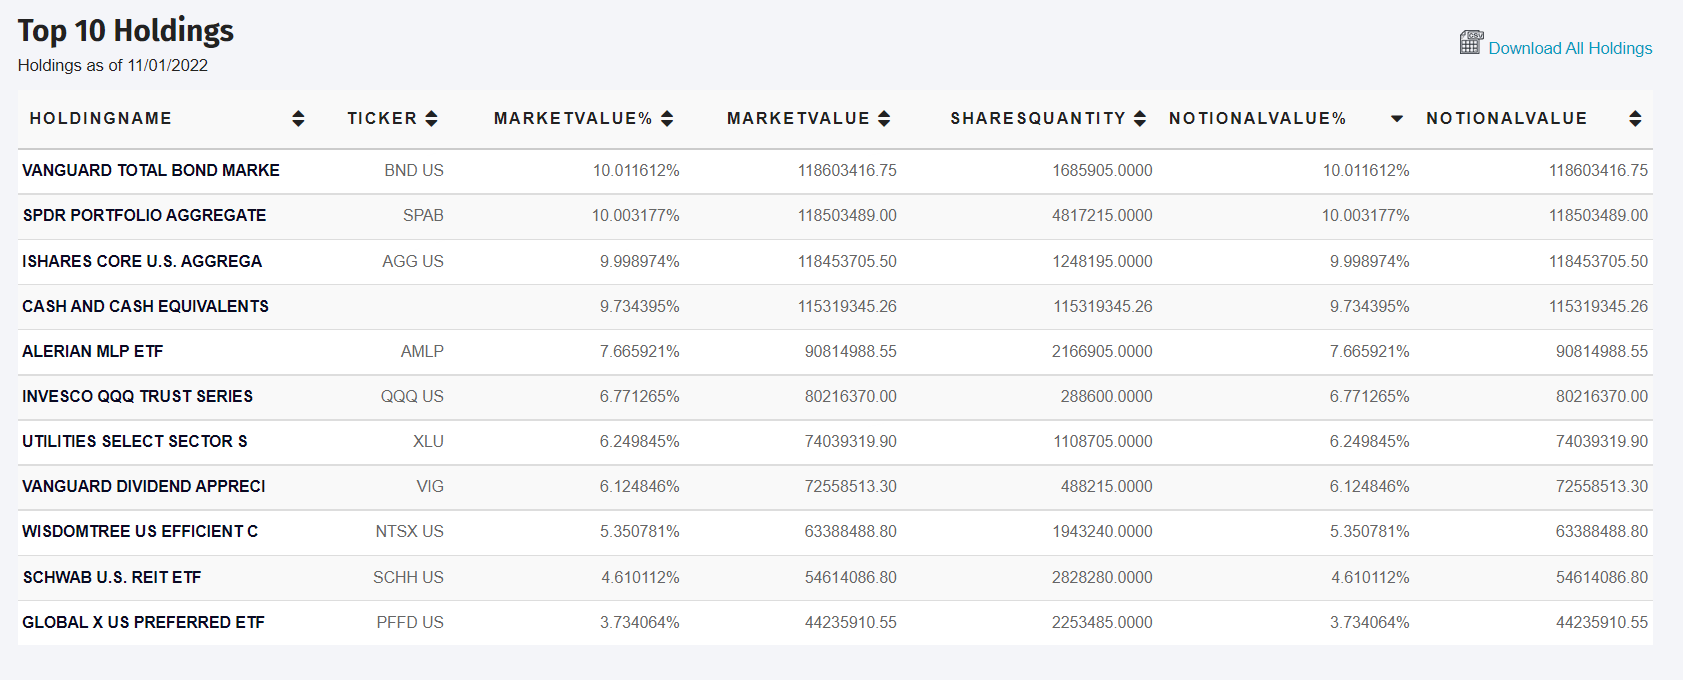
Going through the holdings report in detail, we see that the fund currently has a high cash weighting of 9.7%. 43.7% of the fund is allocated to the ‘core’ portfolio (30% in bond ETFs, 13.7% in equity ETFs), while the Explore portfolio has 46.6% exposure. Within the Explore portfolio, exposures are broadly diversified with MLPs, Utilities and Divided stocks having the biggest weights (Figure 2).
Figure 2 – HNDL portfolio details (Author created from portfolio holdings file dated November 1, 2022)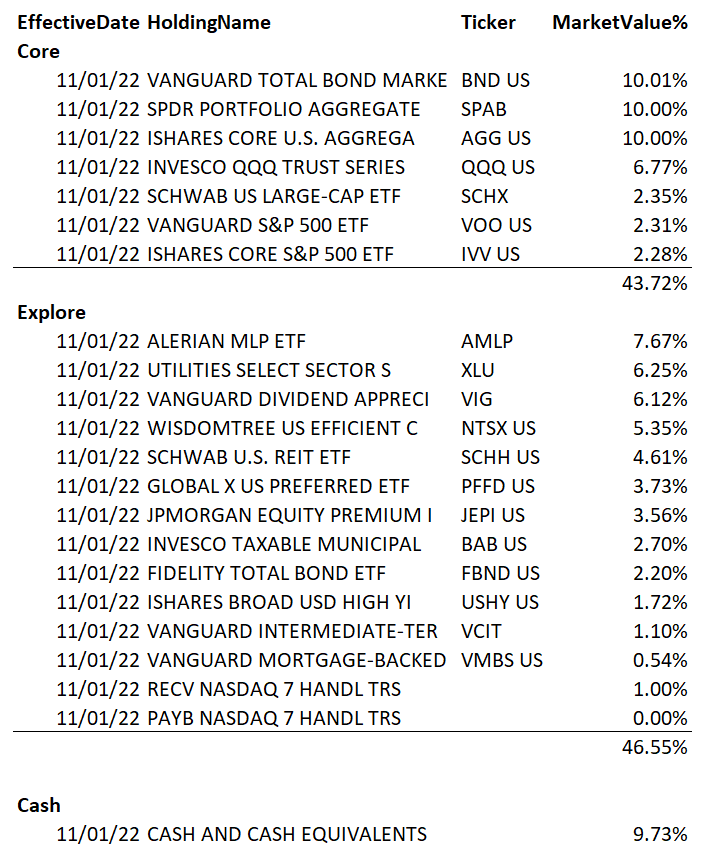
Returns
The HNDL ETF’s historical performance has been poor, with 1Yr and 3Yr average annual returns of -17.5% and -0.7% respectively, as of September 30, 2022 (Figure 3).
Figure 3 – HNDL fund returns (strategysharesetfs.com)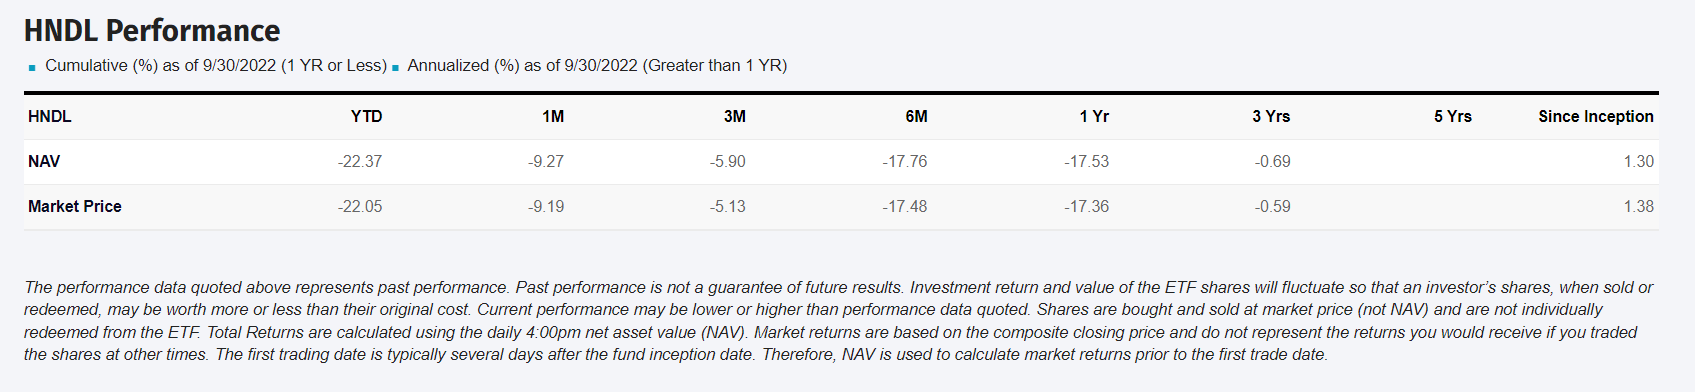
For comparison, the VBIAX has 1Yr and 3Yr average annual returns of -16.4% and 3.5% respectively in the same time frames.
Distribution & Yield
As designed, the HNDL ETF pays a high distribution yield. The LTM distribution was $1.61 / share, which equates to a trailing 8.2% distribution yield. The distribution is paid monthly and is variable.
Note that the trailing distribution is a little misleading, as the fund is designed to pay an annualized 7% rate on NAV. As NAV has been declining due to poor investment performance, the distribution amount YTD has also been in decline, from $0.1493 in January to $0.1105 in October (Figure 4).
Figure 4 – HNDL 2022 distribution (Seeking Alpha)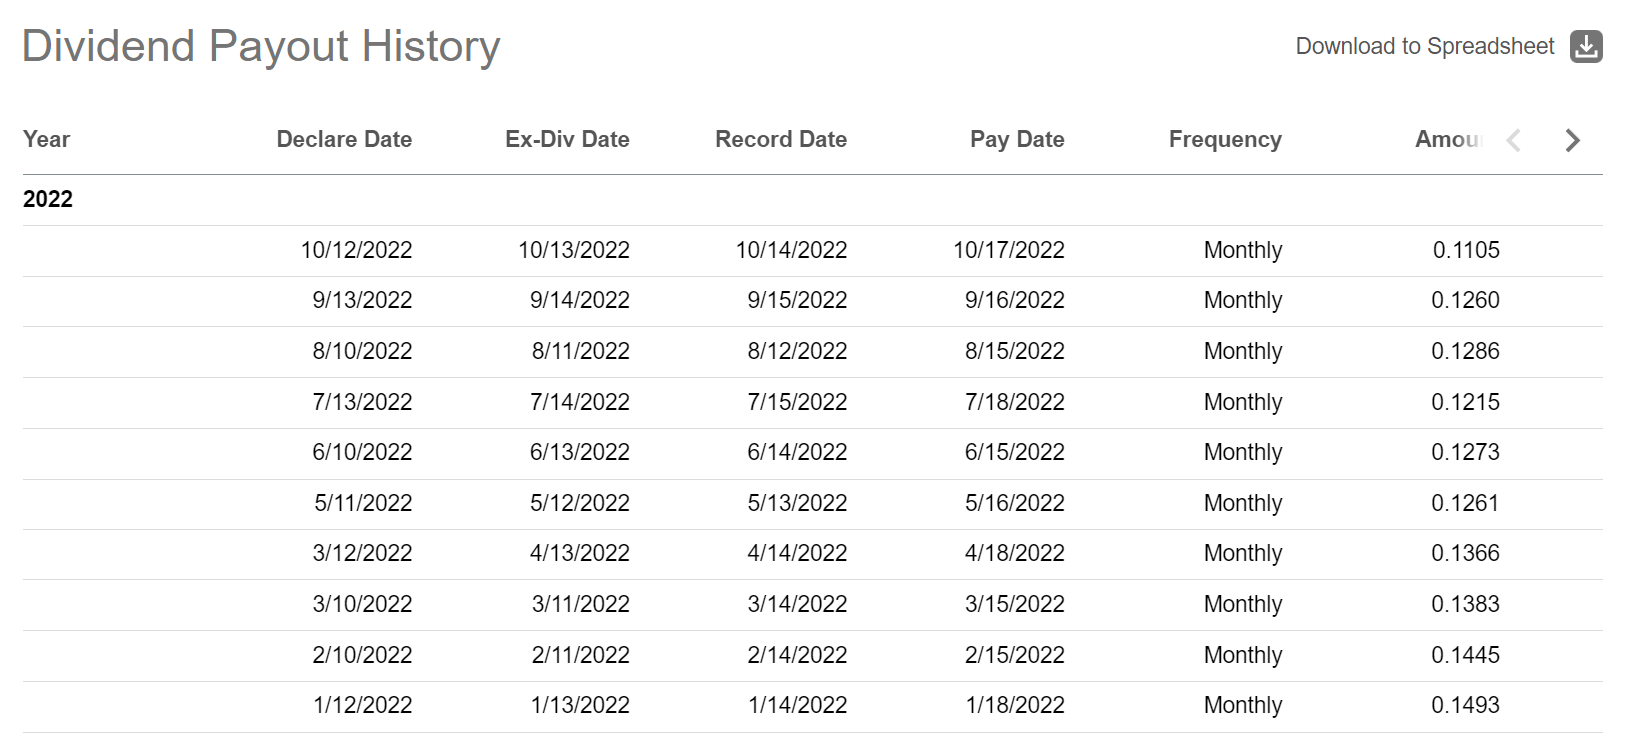
Fees
For its proprietary investment process, the HNDL ETF charges a high 0.98% expense ratio. Note that this is on top of the implicit fees paid on the underlying ETFs the fund holds. Also, investors should be mindful that half of the portfolio are ‘core’ bond and equity funds set in a 70/30 ratio that does not require any ‘expertise’. So investors are really paying ~2% on the ‘Dorsey Wright Explore Portfolio’.
Complex Investment Strategy That Underperforms Low Cost VBIAX
Although the HNDL ETF does not have sufficiently long historical performance through a cycle for me to make a definitive judgment, with 3-Yr returns of -0.7% per year, I cannot help but think this is another example of a complex investment strategy that ends up underperforming.
For example, if we compare the HNDL ETF to the VBIAX Mutual Fund using Portfolio Visualizer, we can see that HNDL underperforms in almost every metric except for the distribution yield. HNDL has a lower CAGR return of 2.0% vs. 5.1% in the period analyzed (February 2018 to October 2022). It has a larger max drawdown of 22.1% vs. 20.8% (note both drawdowns are ongoing). The HNDL has underperformed the low-cost VBIAX in bull markets (2019 to 2021) and bear markets (2022). It charges a 0.98% expense ratio vs. 0.07%.
Figure 5 – HNDL ETF underperforms simple VBIAX (Author created using Portfolio Visualizer)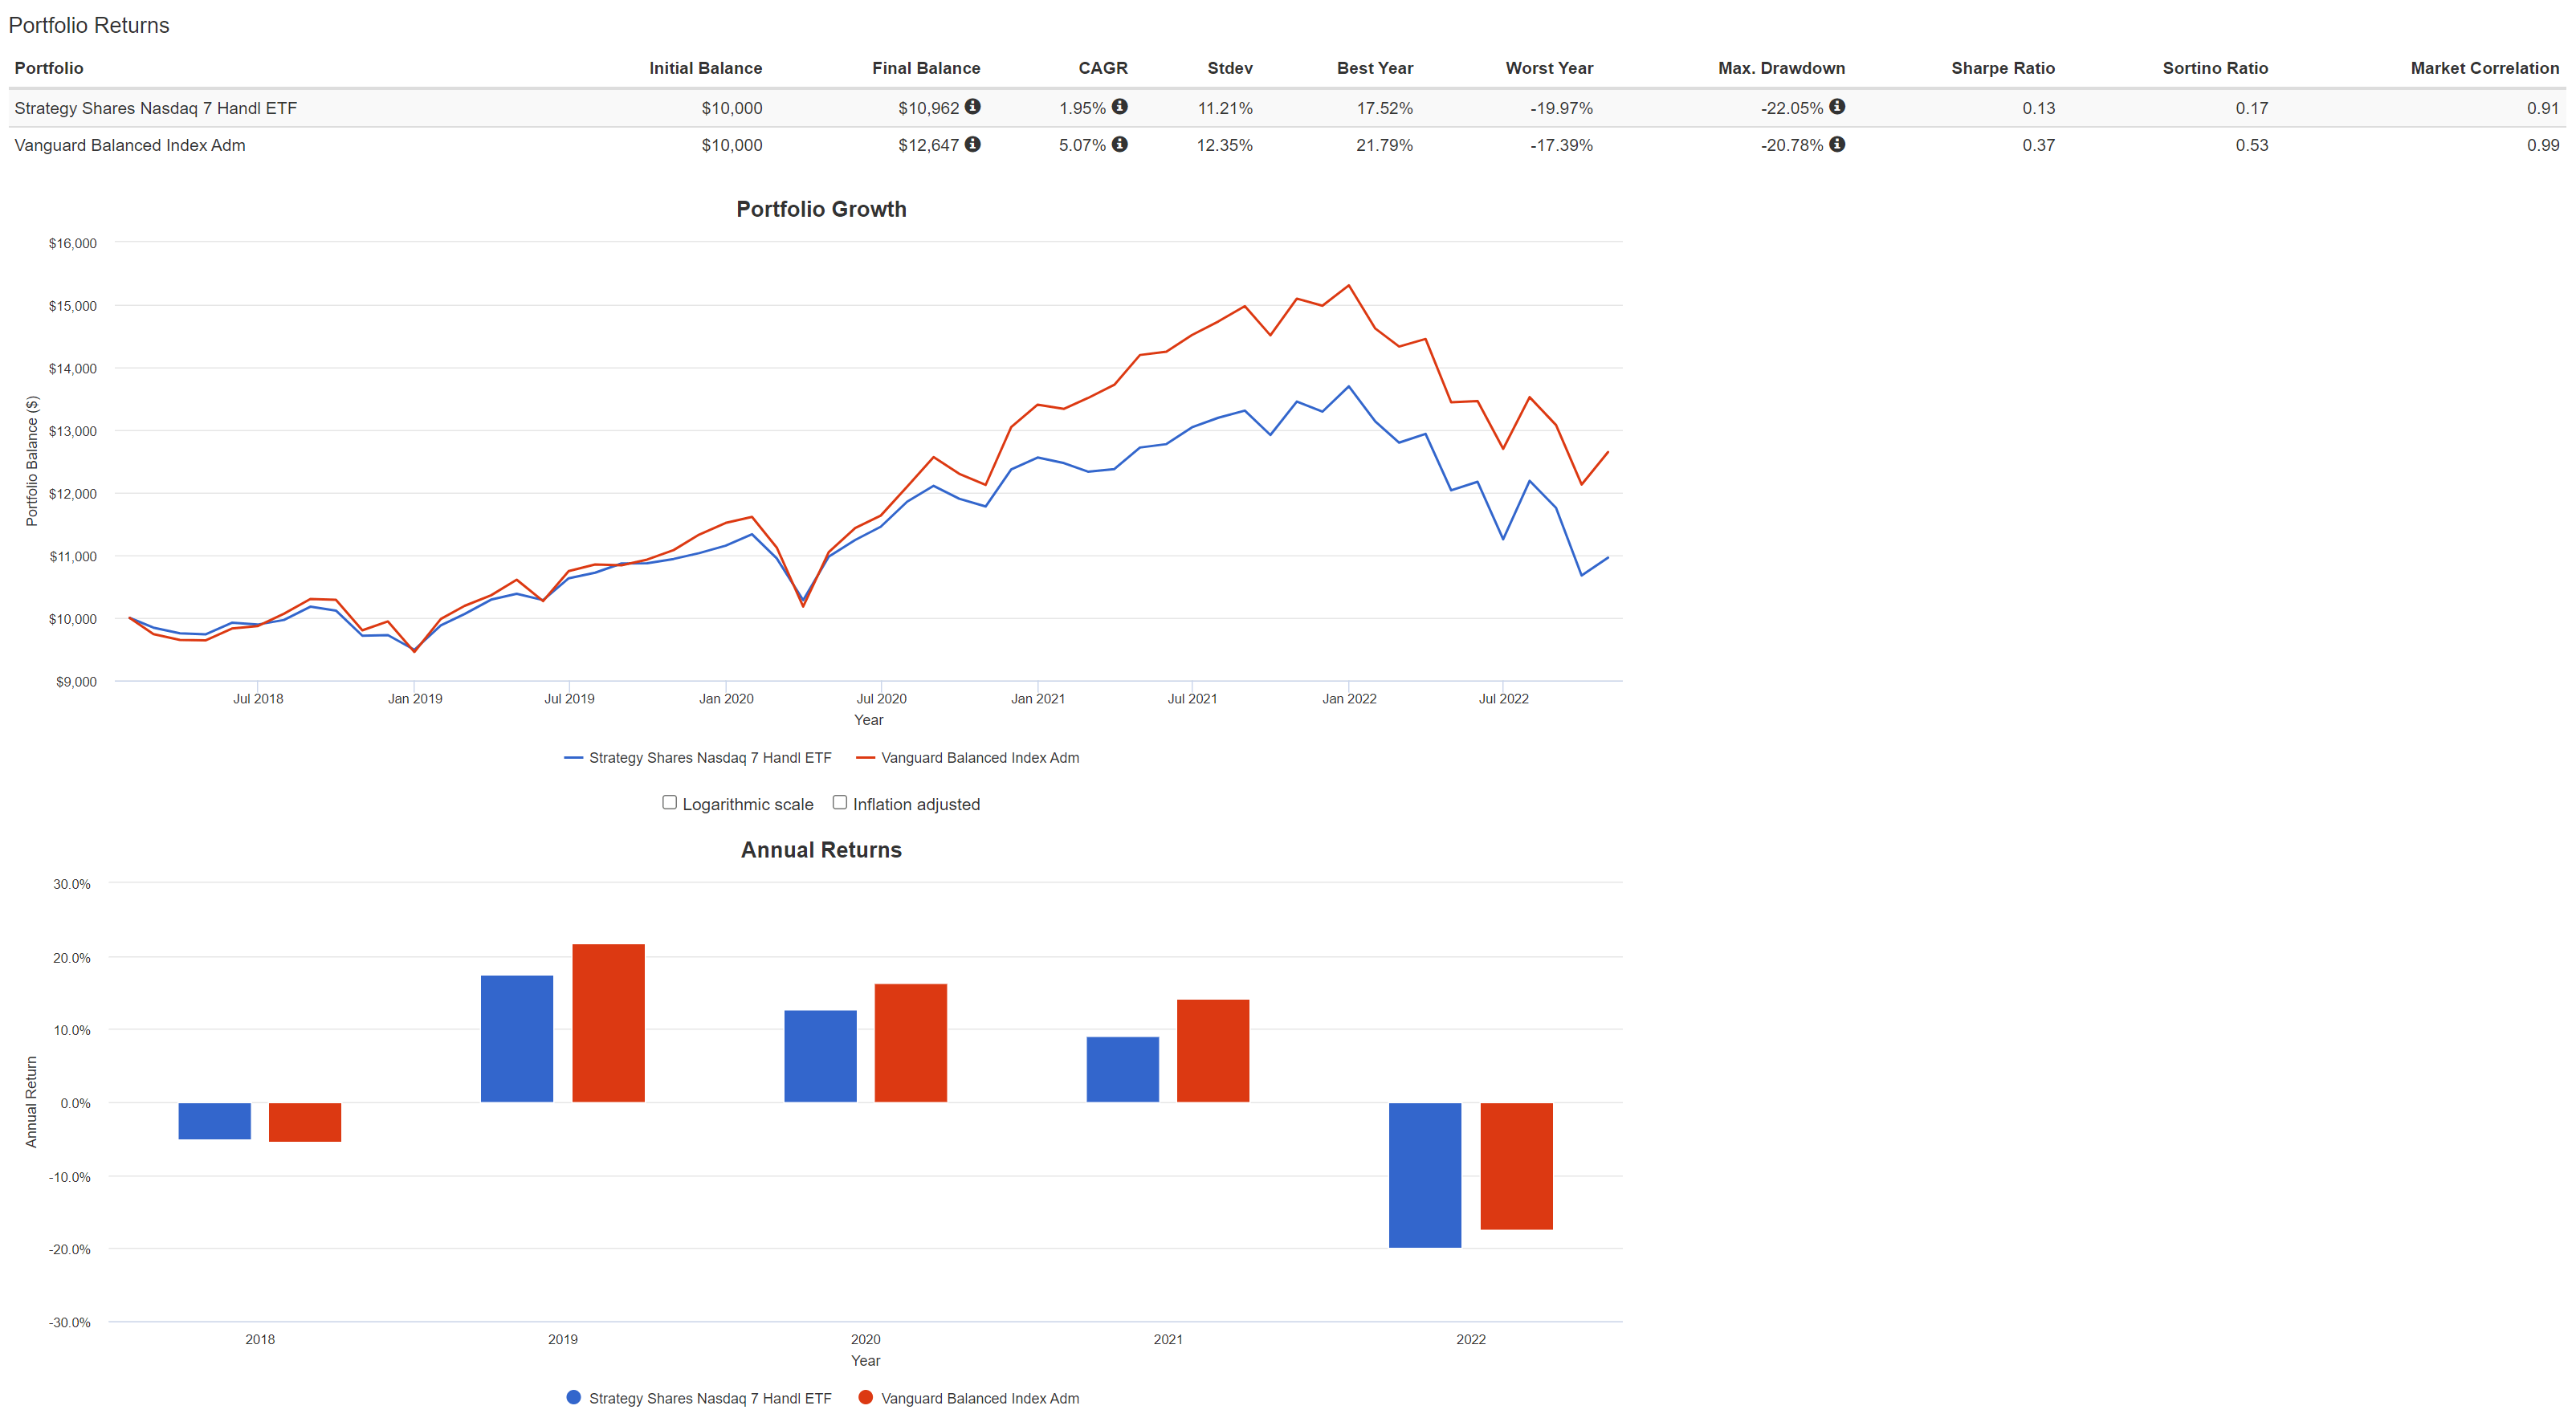
Conclusion
Although the idea of a momentum-based tactical asset allocation portfolio paired with core fixed income and equity holdings sound wonderful (notice the author has purposely thrown in a lot of industry jargon to describe the HNDL fund), in reality, it underperforms a simple low cost balanced fund offered by Vanguard. The only redeeming factor for the HNDL ETF is its high distribution yield, but with annual returns substantially below the distribution yield, investors are just being repaid their own capital. I would stay away from HNDL.
Be the first to comment