

ipopba
SoFi Q3 Report: Great Quarter, Period
On 1st November 2022, SoFi Technologies (NASDAQ:SOFI) released a robust set of financial numbers for Q3:
- Adj. net GAAP revenues of $424M (up 56% y/y) [vs. est. $392M]
- Adj. EBITDA of $44M (up 332% y/y) [vs. est. $29.1M]
- Diluted EPS -0.09 [vs. est. -0.10]
- Members: 4.743M [424K added in Q3] (up 61% y/y)
While the macroeconomic environment remains challenging, Q3 results showed that SoFi is performing exceptionally well right now. The strength in SoFi’s Q3 financial performance stemmed from robust originations in the Personal Loans segment and a mild recovery in the Student Loans segment coupled with a significant uptick in the financial services segment, partially offset by weakness in the Home Loans segment. Overall, SoFi delivered record revenues of $419M (non-GAAP) (up 51% y/y) with a contribution profit of ~$147.5M. While SoFi remains unprofitable on a net income basis, SoFi is delivering rapid growth at scale and marching toward profitability.
SoFi Q3 Earnings Presentation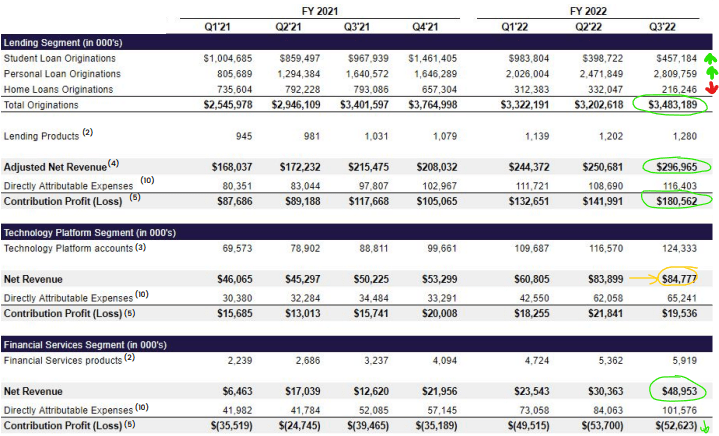
For FY-2022, SoFi increased its revenue guidance from $1.508-1.513B to $1.517-1.522B and lifted the adj. EBITDA guide from $104-109M to $115-120M [8% adj. EBITDA margin]. Considering the challenging macroeconomic environment, SoFi’s Q4 guidance is a thing of beauty.
SoFi Q3 Earnings Presentation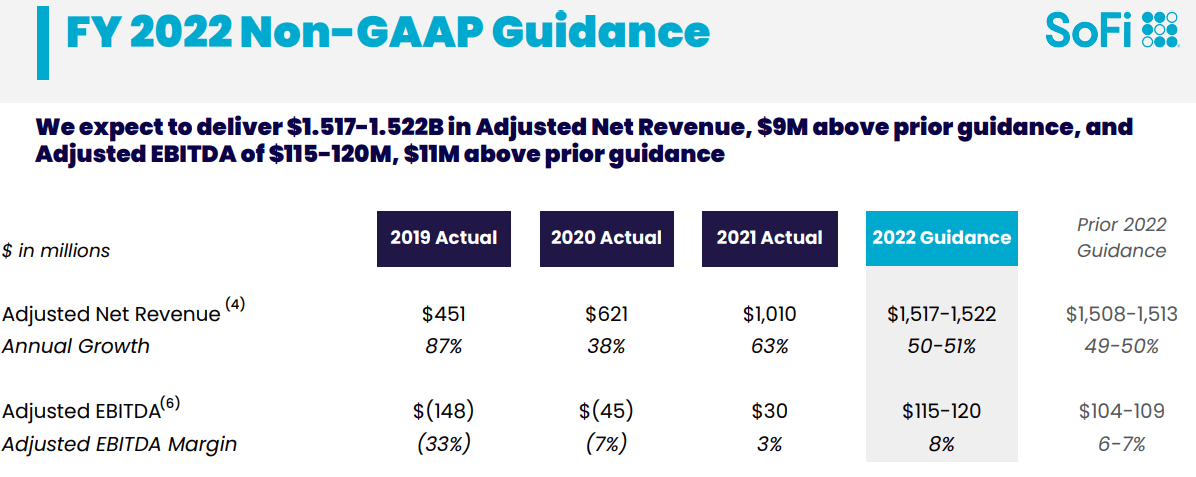
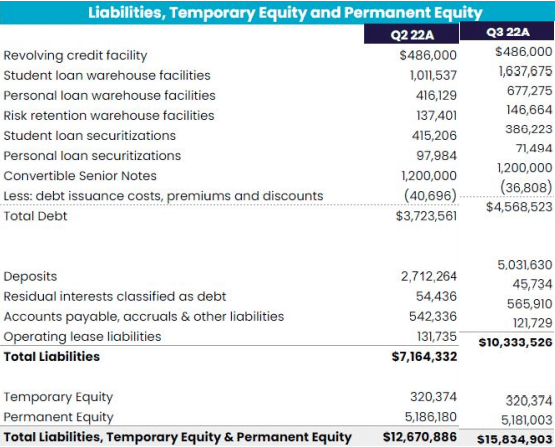
The structural driver behind SoFi’s strength is its national bank charter, which has allowed the fintech company to raise deposits at low-interest rates [reducing capital costs for its lending activity]. As of Q3, SoFi’s deposit base rose to $5B, and this capital is providing SoFi the flexibility for holding loans on its balance sheet for a longer duration (as necessitated by a freeze-up in credit markets due to rapid changes in interest rates). Interestingly, SoFi’s Personal Loans originations were ~$2.8B in Q3, which is nearly the same amount by which its Personal Loan balances shot up during the quarter. This data tells us that SoFi decided to hold these loans on its balance sheet for longer or it was unable to offload (sell) them [big negative for Upstart (UPST) if the latter is true].
Fortunately, SoFi has the balance sheet strength to hold onto these loans (and earn interest income). Also, the strict credit standards at SoFi (Personal loan: Avg. FICO score is ~770, Annual Income >$170K) should ensure that the default (delinquency) risk remains low in the future. As per SoFi’s management, the delinquency rates on its loan book are still below pre-pandemic levels.
SoFi Q2 & Q3 ER Presentation SoFi Q2 & Q3 ER Presentation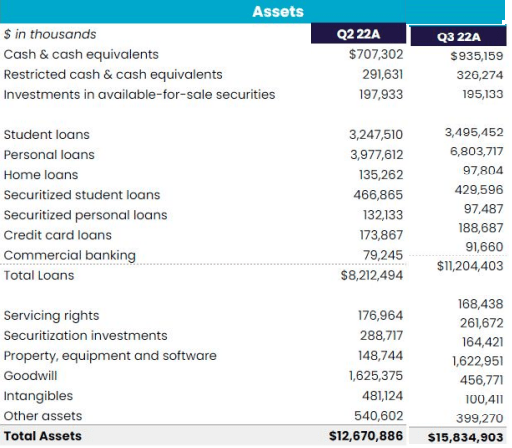
In my view, SoFi’s business momentum is incredible, and 2023 could be even better as the Student loan moratorium is lifted and Net Interest Income from originations in the second half of 2022 take-off (management disclosed that it takes 6-7 months to fully realize NII from loans originated by SoFi). Looking at SoFi’s momentum, I could see the company reaching breakeven profitability next year (despite rising fears of a recession). We discussed SoFi’s investment thesis in the following note; please read it (if you haven’t done so already):
In a nutshell, SoFi’s Q3 report was a conviction booster, and the stock remains a strong buy for the long run. We will continue accumulating more shares in this company over the coming weeks and months within TQI’s Moonshot Growth Portfolio. The early morning bounce in SoFi has faded to a large extent, but that is good news for long-term investors.
SoFi’s Fair Value And Expected Return
I recommended SoFi as a “Strong Buy” at $5.06 on October 17th in our marketplace service, and after these results, I am upgrading my valuation for the company. To determine the fair value and expected return of SoFi, we will use TQI’s Valuation model with the following assumptions:
TQI Valuation Model (TQIG.org) TQI Valuation Model (TQIG.org)

According to TQI’s valuation model, SoFi is worth $11.40 per share (up from my previous estimate of $10.37 per share), i.e., it is still trading at a significant discount to its fair value. By 2027, SoFi’s stock could be trading at $22.29 per share, which would imply a ~31% CAGR return from current levels. Since these projected returns are well above our investment hurdle rate of 20% for high-growth stocks, SoFi is a strong buy at $5.7 per share.
SoFi’s Quant Factor Grades And Technicals
Now, we shall analyze SoFi’s quant factor grades and technical chart.
According to SA’s quant rating system, SoFi is rated as a ‘Hold’ with a score of 2.94/5 with strong factor grades for ‘Valuation’ [B-] and ‘Growth’ [A-], a neutral factor grade for ‘Revisions’ (earnings) [C], and poor factor grades for ‘Profitability’ [F] and ‘Momentum’ [D]. None of these grades are surprising, and I think they are a fair reflection of the current state of affairs at SoFi.
Seeking Alpha Quant Ratings
Overall, SoFi quantitative factor grades are neutral. However, SoFi is making good progress on the profitability front, and I see that grade improving over the coming quarters. Before we make an investment decision, let’s also analyze SoFi’s technicals.
As you can see below, SoFi’s stock chart is a disaster. After going public through a SPAC in late 2020, SoFi stock surged from $10 to $25 and has since crashed to ~$5-6 per share. While SoFi’s technical chart history is not deep enough to suggest any floor on the stock, we can see a base formation in SoFi in the $5-9 range over the last few months.
WeBull Desktop
Now, a breakdown of this base could send the stock plunging down to the $3.5-4 level, I think this buying in at (or near) the bottom end of this base formation is a fine idea for long-term investors.
SoFi’s quant factor grades and technical charts do not support an immediate run-up in the stock, and so I do not view it as a viable near-term trade. However, SoFi’s business fundamentals are looking robust. Overall, SoFi is a strong long-term buy, but weak quantitative and technical data warrant buying via slow accumulation.
Final Thoughts
In a nutshell, SoFi’s business fundamentals are improving from quarter to quarter despite an ~80% plunge in its stock over the last 18 months or so. Due to weak technical and quantitative data, I do not view SoFi as an ideal short-term play. However, with a fair value of $11.40 per share, SoFi is offering an attractive entry point for long-term investors willing to accept short-term volatility for long-term gains. I like the idea of a 6-12 month DCA plan. For me, SoFi’s Q3 report was a conviction booster, and I continue to rate SoFi a “Strong Buy” at current levels.
Key Takeaway: SoFi is a “Strong Buy” at $5.7
As always, thank you for reading, and happy investing. Please feel free to share any questions, concerns, or thoughts in the comments section below.
Be the first to comment