

How can dull buildings on concrete make so much money? GaryMuth/iStock via Getty Images
2021 will go down as the year it rained money in self storage. Average occupancy gained 290 basis points and realized rents were up almost 10%. The net result was an 18% increase in same property NOI and a 27% increase in earnings. Variations in performance were largely based on geography, with suburban locations generally outperforming urban settings.
Did we mention the stocks gained 82%?
REIT/BASE and company reports.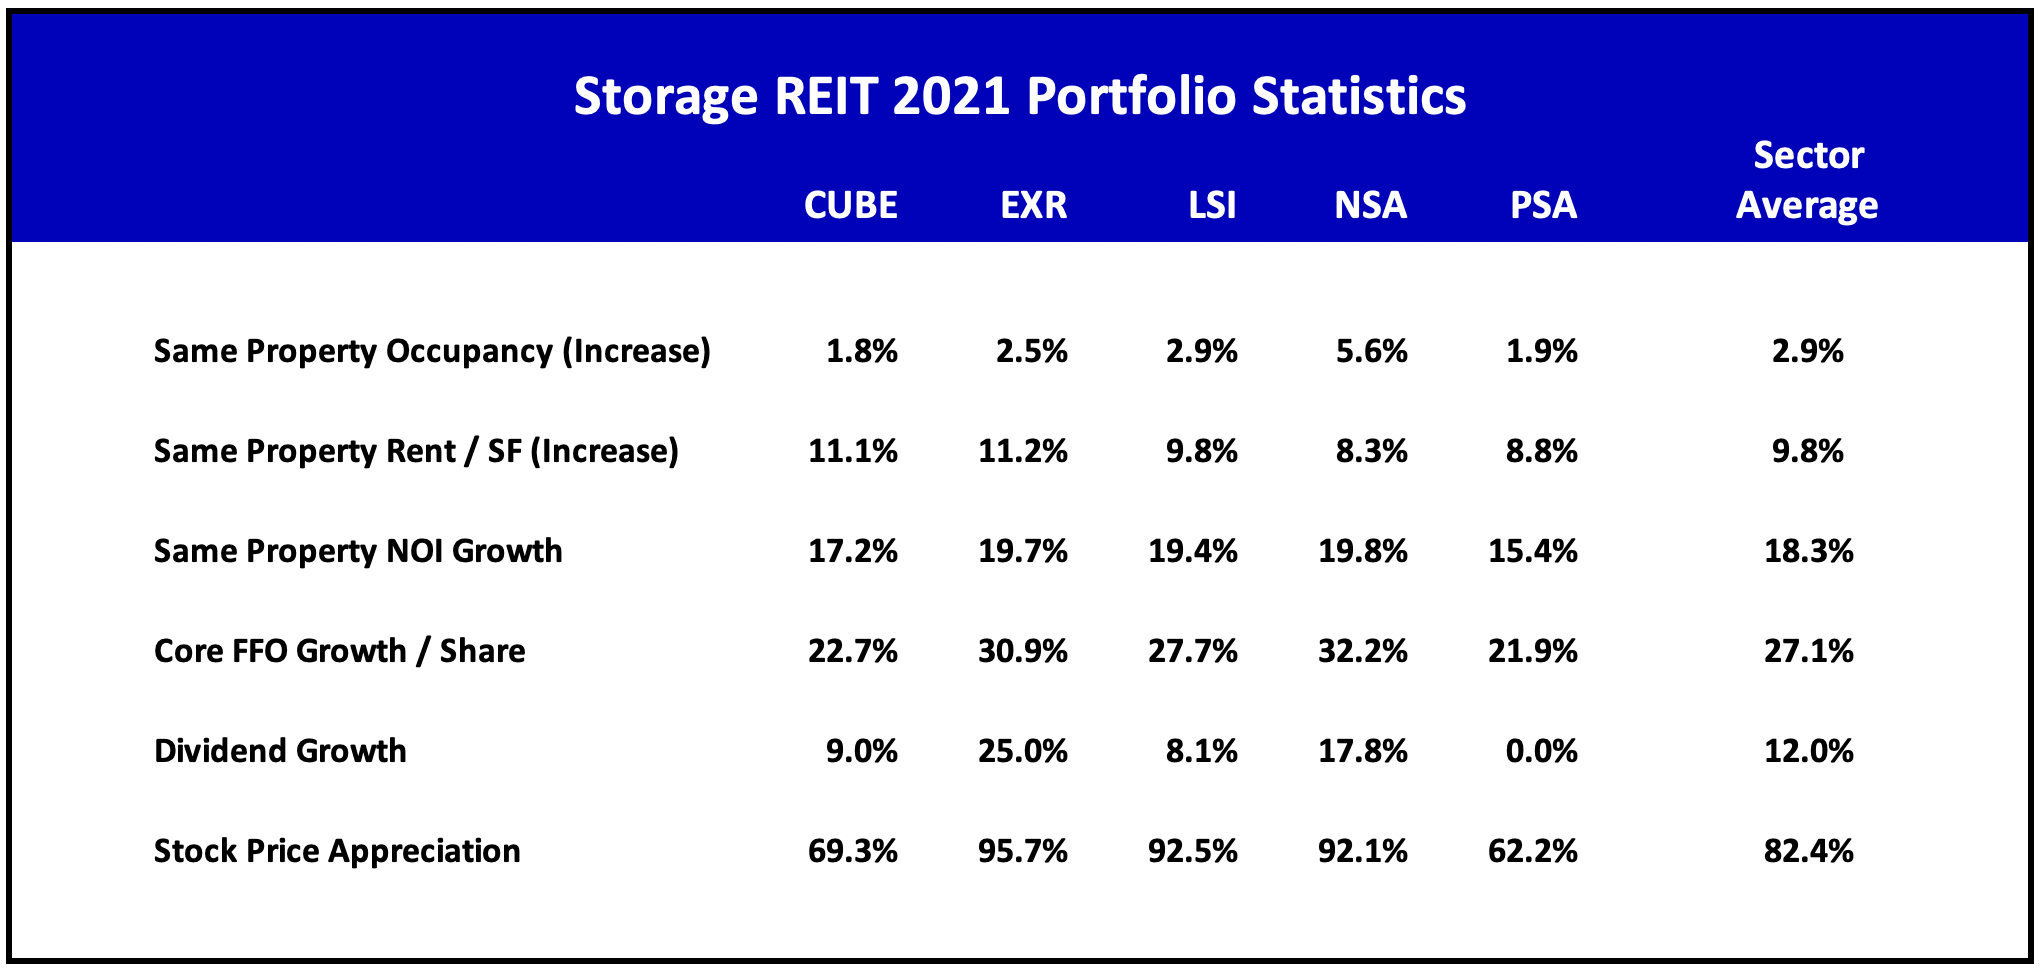
We have summarized results and outlooks for each of the five storage REITs in the following section, and then conclude with a forward outlook for 2022.
CubeSmart (CUBE)
As shown below, CUBE’s earnings showed steady sequential improvement, culminating in a 23% increase in 2021 Core FFO/share and a 26% increase in the 4Q dividend. 2021 was also notable for the $1.7 billion Storage West acquisition (closed December), providing a nice kick-off for 2022.
CUBE has guided to 2022 Core FFO of $2.39, up 13.3% over the prior year. This is at the low end of the peer group, but management’s practice is to exclude from guidance any benefit from prospective acquisitions. It’s hard to imagine CUBE not finding at least a few deals in 2022, so guidance seems likely to improve.
REIT/BASE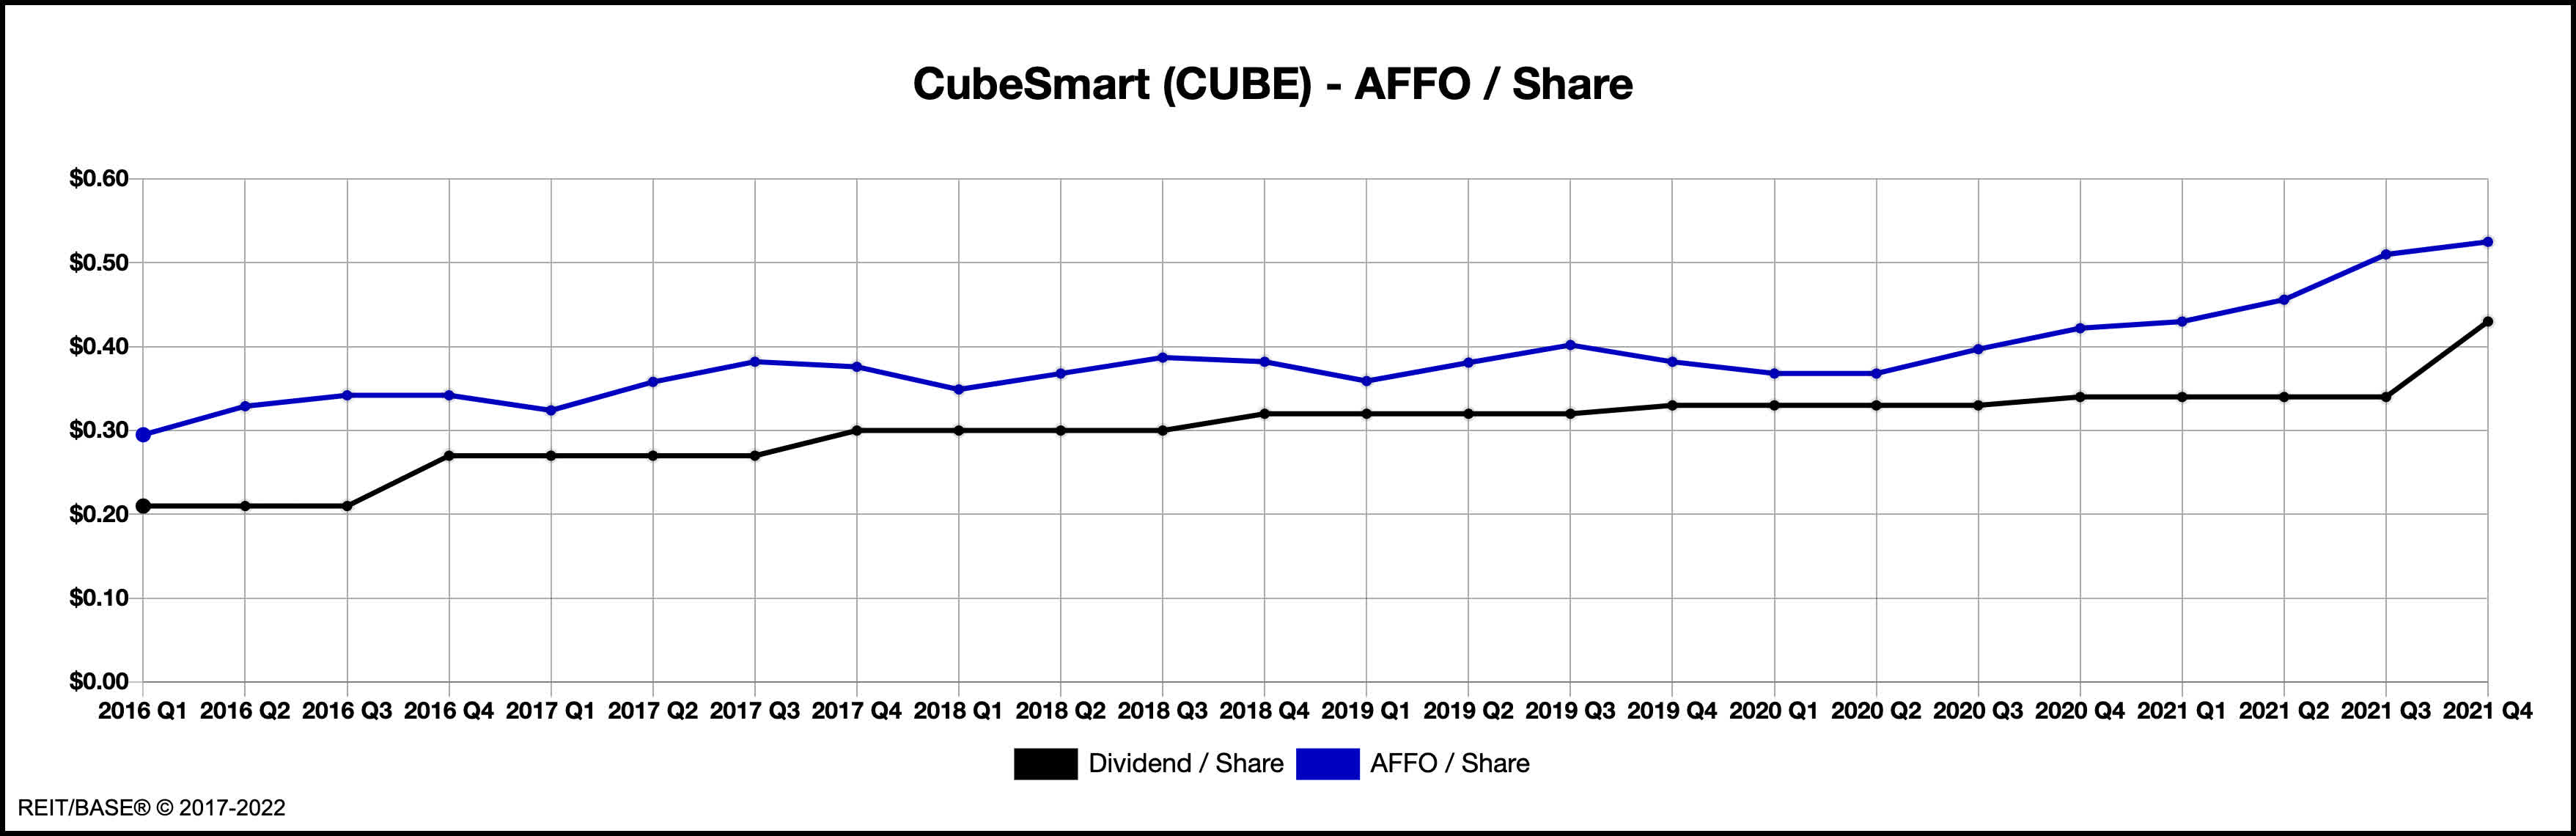
Extra Space Storage Inc. (EXR)
EXR’s earnings took off like a Learjet in 3Q’20 and really haven’t slowed down since. Investors were rewarded with a 25% dividend increase in mid-2021 (to $1.25) and a similar dollar increase (to $1.50) effective 1Q’22. Dividend payout was a conservative 69% of AFFO in 2021, so the dividend increases seem well covered.
REIT/BASE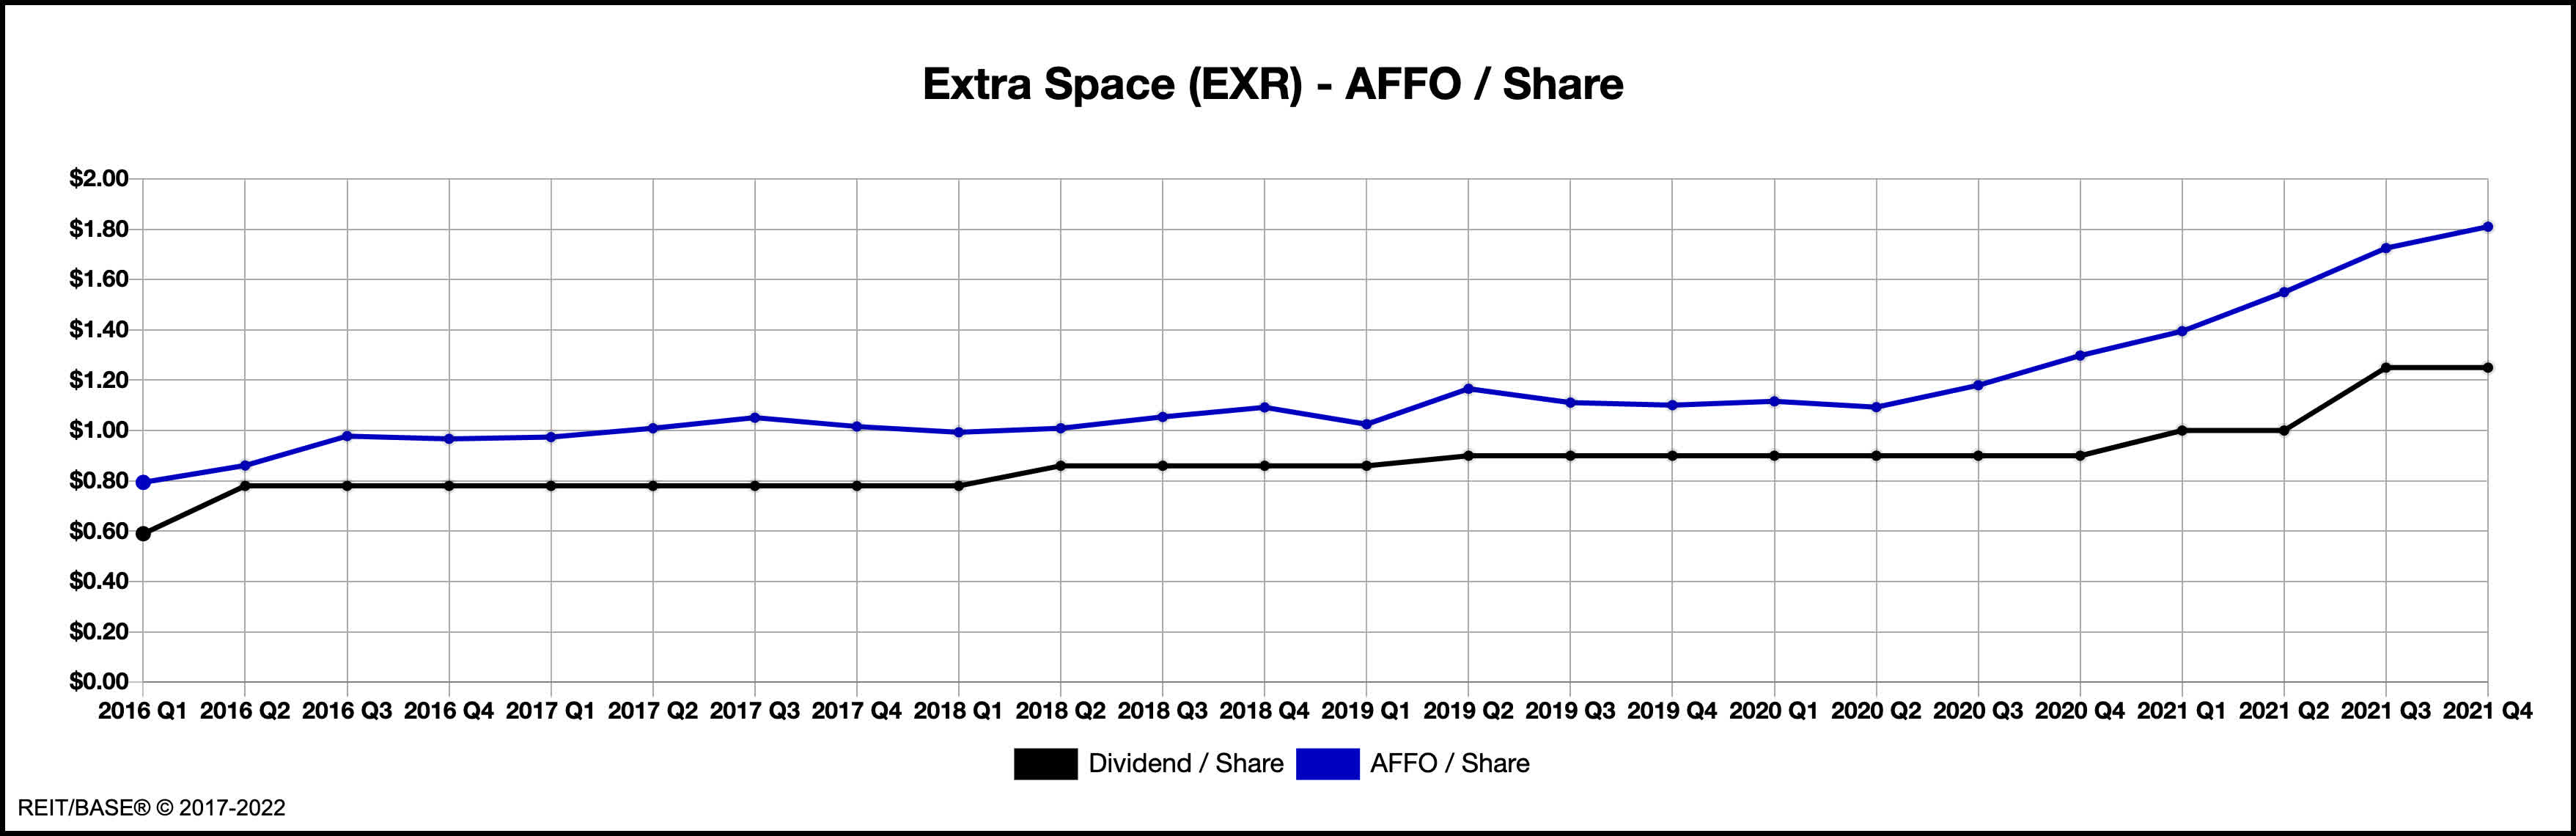
EXR’s 2022 guidance calls for a 13% increase in Core FFO to $7.83/share at the midpoint. This is somewhat below the group average, partly due to dilution (est. $0.23/share) caused by facilities in the early stages of stabilization. 2022 guidance also assumes $500 million of acquisitions for the year, a number that seems overly conservative given that $256 million of acquisitions were completed or under contract as of February.
Life Storage, Inc. (LSI)
Life Storage achieved a 28% gain in Core FFO/share in 2001 and is guiding to an 18% increase for 2002. The earnings growth resulted in sequential dividend bumps of 16% in 4Q’21 followed by another 16% increase for 1Q’22.
Like the other storage REITs, LSI took advantage of an active transaction market in 2021 with $827 million of acquisitions in 4Q and $1.7 billion for the full year. 2022 guidance includes only $600 million of projected deals, although this target also seems conservative given $165 million of closed transactions in January and $236 million under contract.
REIT/BASE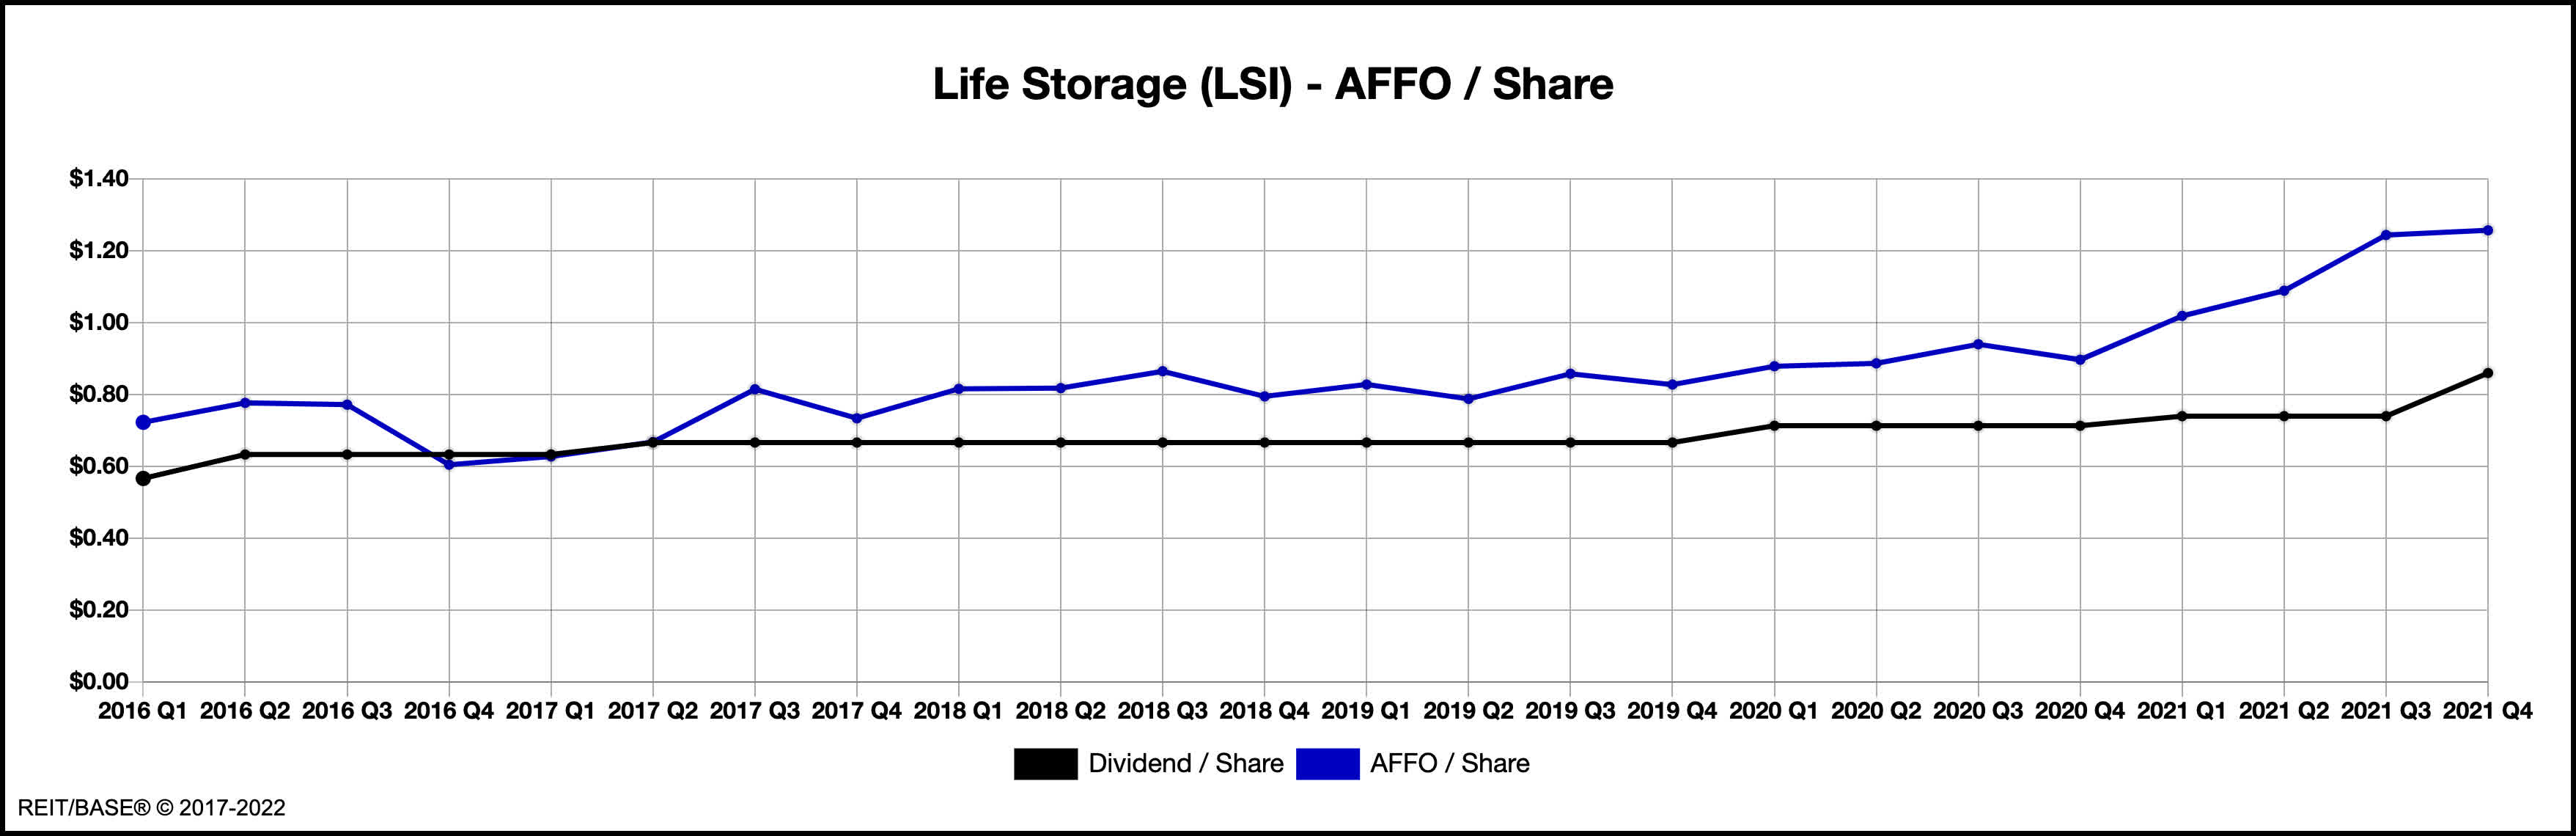
National Storage Affiliates Trust (NSA)
National Storage Affiliates is the new kid in town (2015 IPO) with a portfolio of 1,050 owned and managed stores in 42 states. The company has historically focused on non-urban locations, which was exactly the place to be in 2021. NSA’s same property NOI growth came in at a blistering 19.8% for the year, edging out EXR (19.7%) for top honors within the group.
REIT/BASE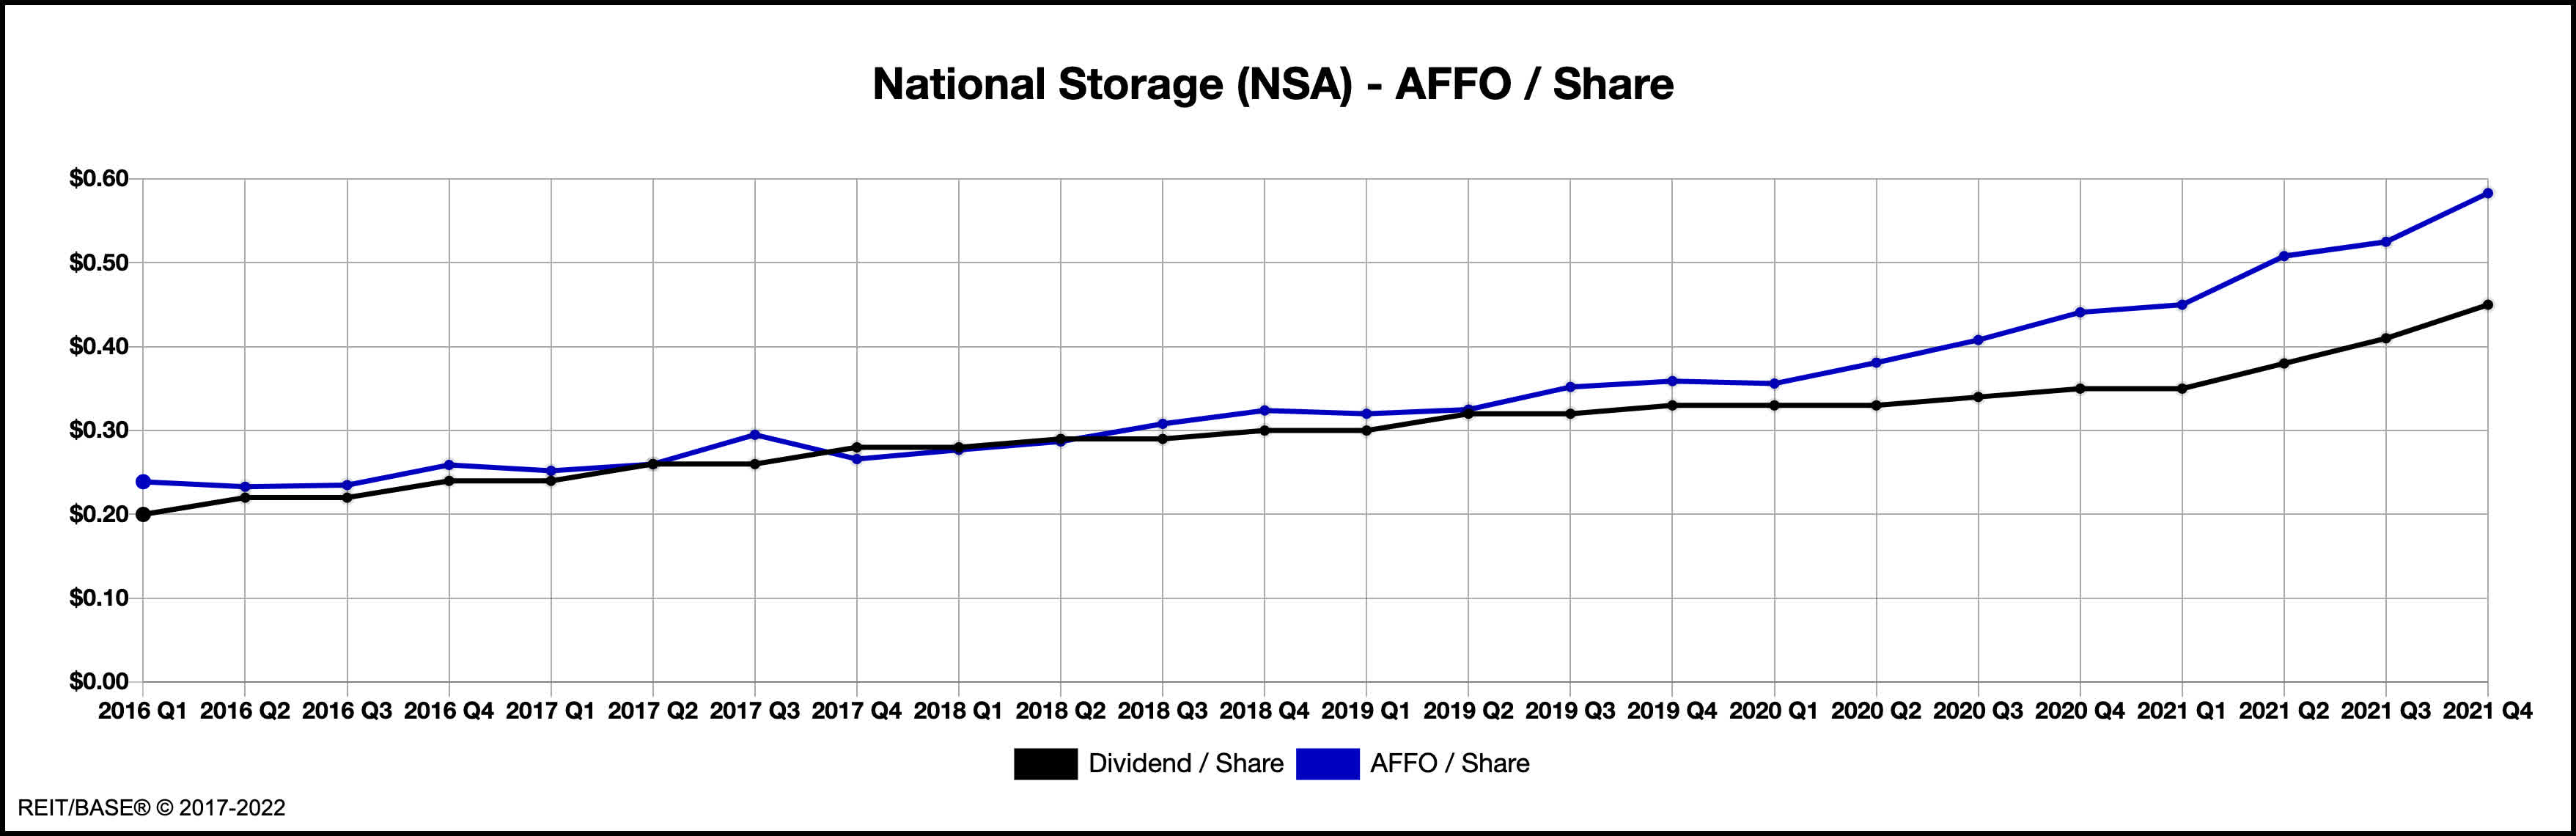
As noted above, NSA’s AFFO earnings growth has outpaced dividend increases over the last two years. While some investors might have wanted a more generous return, the company’s board has instead used the earnings windfall to lower the payout ratio and move closer to the sector average (72%). The chart below outlines the reduction in NSA’s dividend payout, which averaged 77% in 2021 vs. 94% in 2019.
REIT/BASE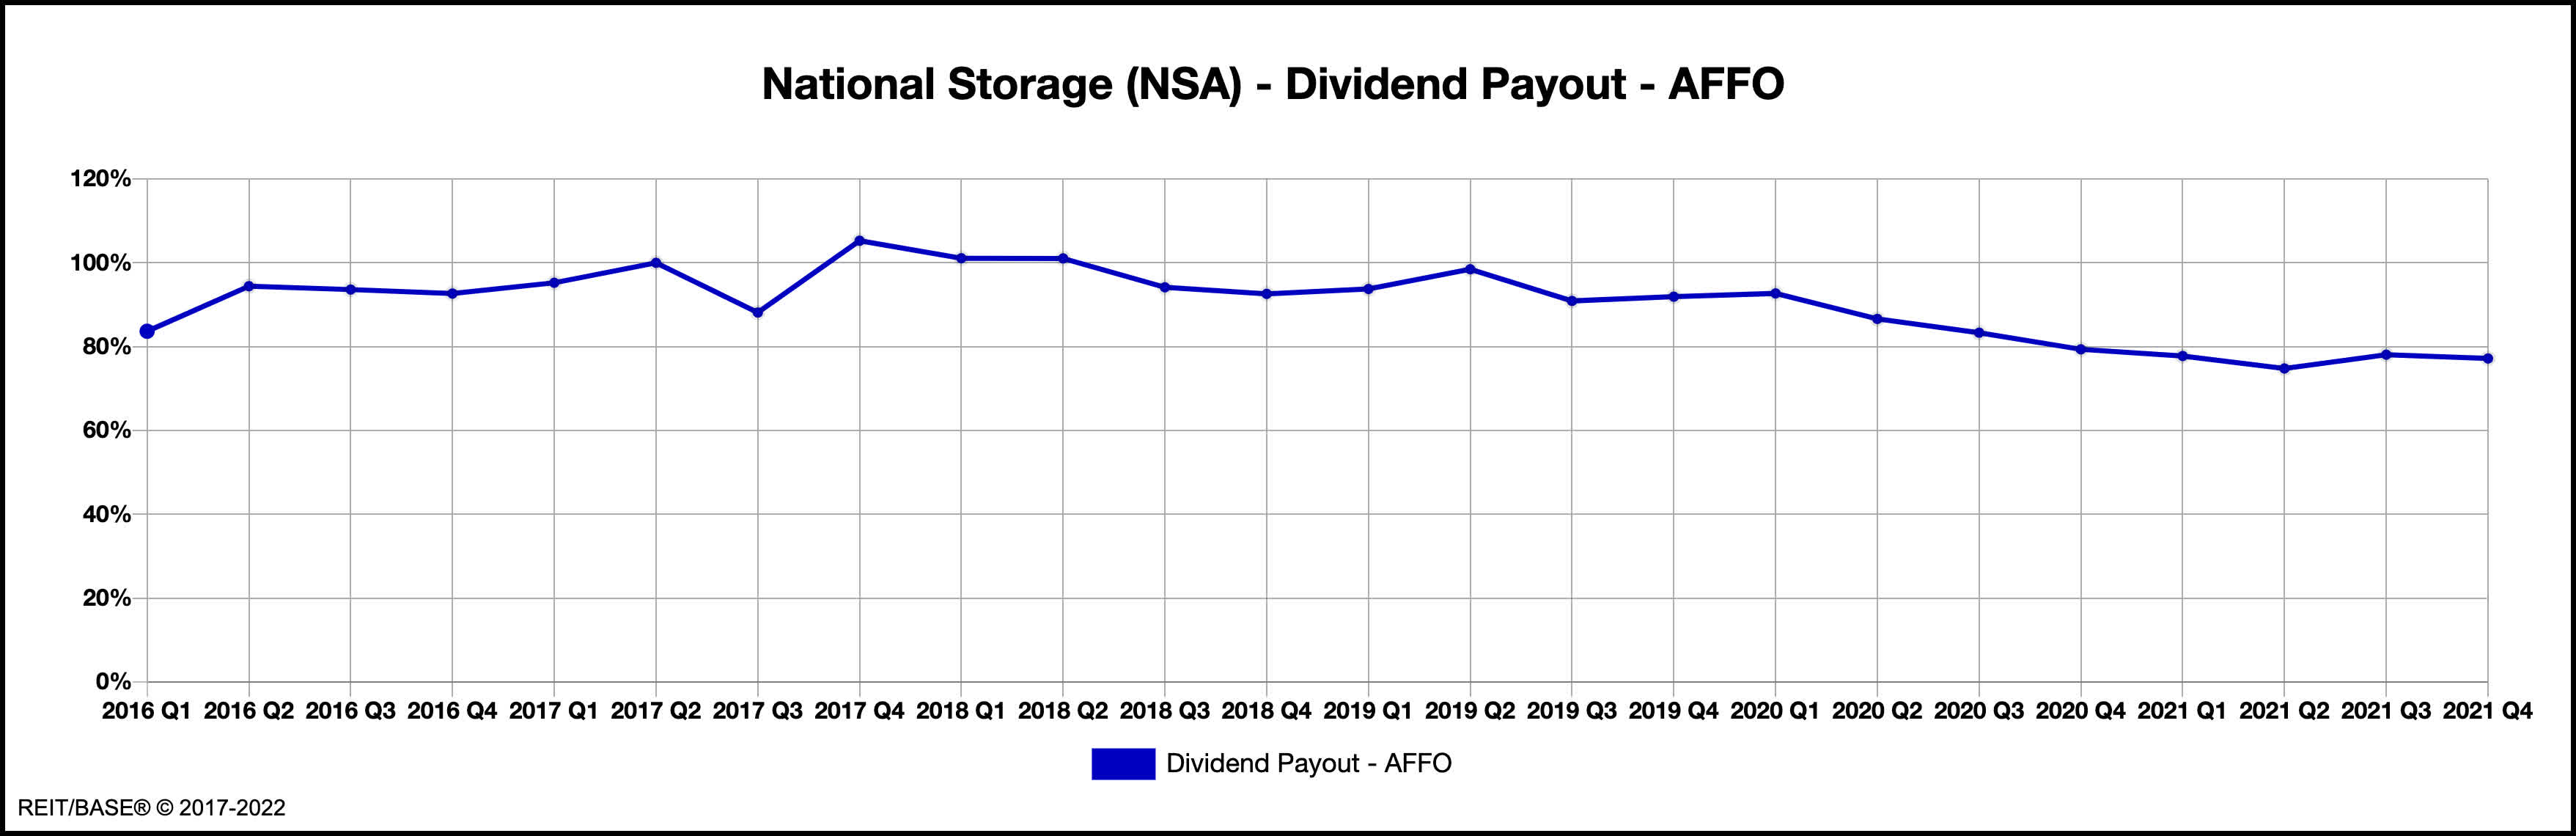
Public Storage (PSA)
Public Storage is the largest company in the group with a year-end total market capitalization of $77 billion. The company has long had a fortress balance sheet (A2/A), at the cost of somewhat lower returns versus peers. That’s starting to change, however, as PSA financed both the $1.8 billion ezStorage and $2.3 billion All Storage portfolio acquisitions with corporate debt. While borrowing levels have increased over the last few years, leverage through the preferred shares is still moderate at 4.1x based on 4Q’21 financials. We think PSA can go at least another year without needing to raise common equity, a unique attribute among the peer group.
REIT/BASE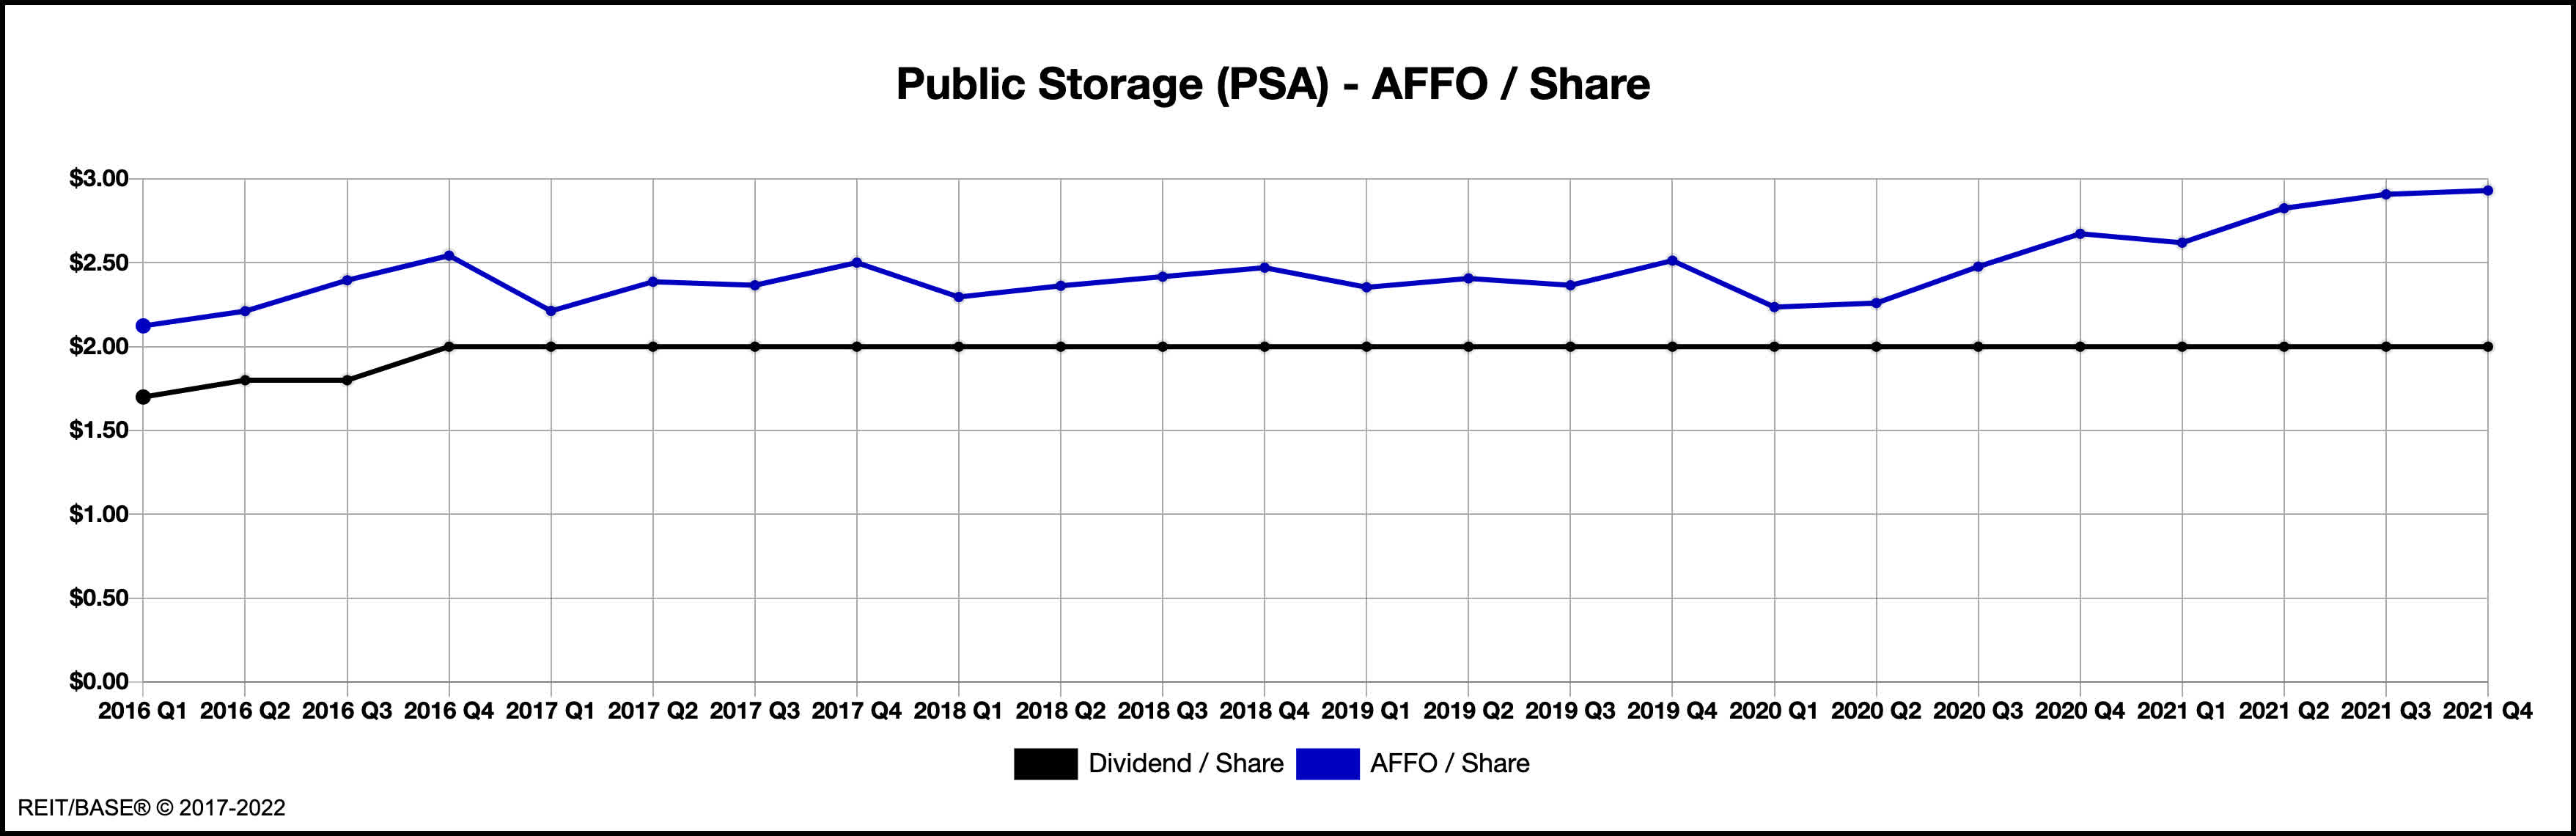
PSA is currently guiding to 2022 Core FFO of $15.20/share (midpoint), up 18% over 2021. Driving the 2022 gains will be a full year’s contribution from 2021 acquisitions, the roll-off of moratoriums on rate increases in certain markets, and increased economic occupancy at newer facilities.
Sharp-eyed readers will notice that PSA’s dividend has been flat since 2016, resulting in a 5-year growth rate of zero. We can understand the first four years, but you have to scratch your head about 2021 and potentially 2022. Rents are up, earnings are up, and the dividend was already at taxable minimum (100% ordinary income). Sooner or later…
2022 Guidance & Dividend Outlook
The following table summarizes 2022 earnings guidance and initial dividend increases for the group.
REIT/BASE and company reports.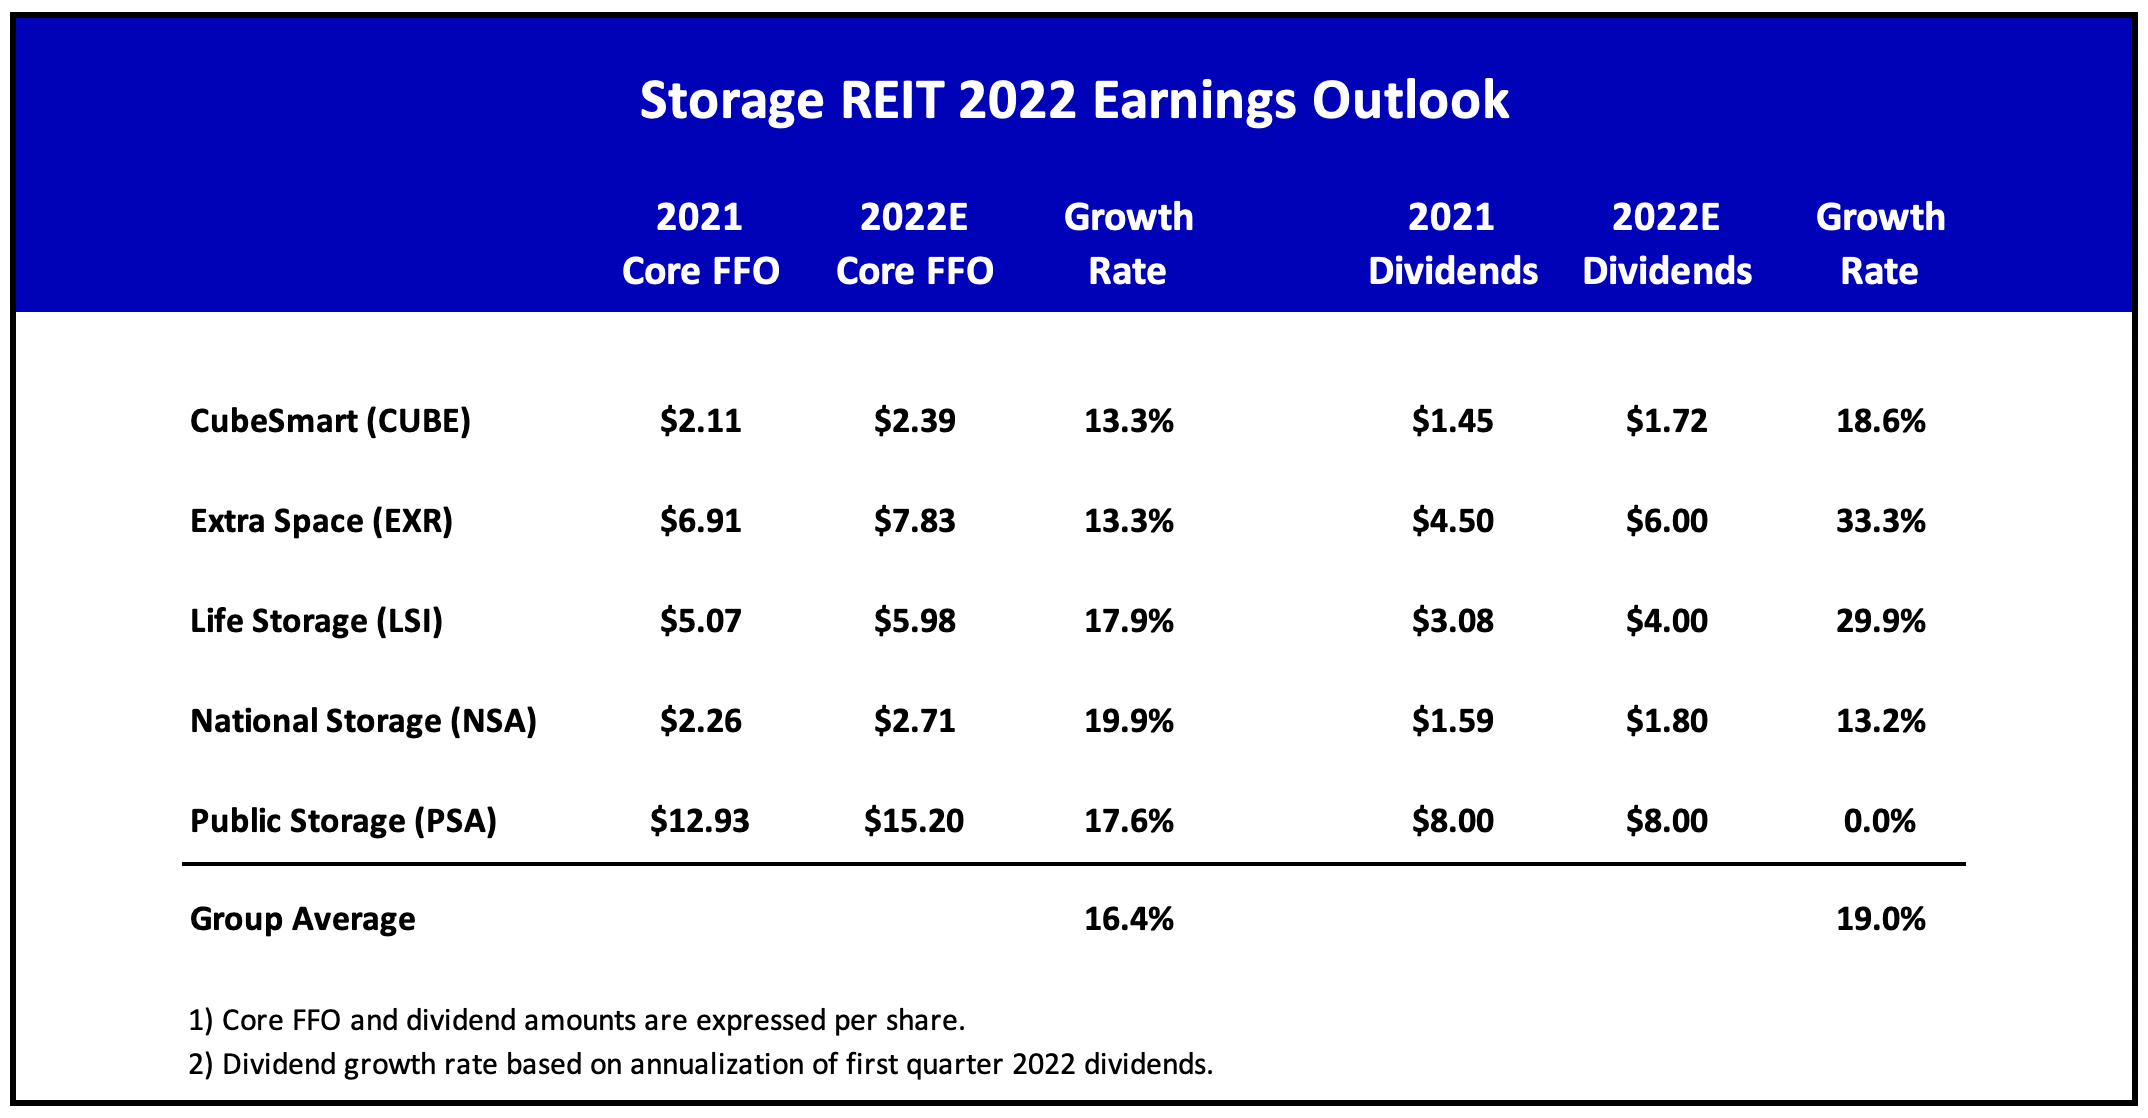
After reading through the fourth quarter earnings transcripts, there’s probably some mild upside to earnings guidance as 2022 acquisition volume is likely to exceed initial expectations. Even so, the initial 16% increase in Core FFO/share is substantial, particularly against the backdrop of a 27% increase in 2021.
Regardless of earnings performance, solid dividend growth of 19% is already baked in for 2022 based on current dividend levels. But that assumes zero dividend growth for the rest of the year, which may be too cautious. PSA’s ability to hold the line on taxable income – or not – will also determine full-year distribution levels.
While everything seems rosy at the moment, the most important question for investors is whether the ‘new normal’ in storage rental rates can be sustained in 2023 and beyond. The entire sector has benefitted from an active housing market and disruptions caused by COVID-19. Given the hockey stick gain in NOI, the potential for even some mild reversion can’t be dismissed. At the moment, we think a soft landing scenario is more likely for 2023-2024 given moderate new supply, rising interest rates, and inflationary pressure on construction costs. But you’d be right to worry.
Thanks for reading and we look forward to your comments.
Be the first to comment