

fizkes
Introduction
We review our Hold rating on ANSYS, Inc. (NASDAQ:ANSS), a U.S. simulation software company with a market capitalization of $21.4bn. ANSYS stock is at roughly the same level as it was at our last update in September, and 41% below the peak it reached last December:
|
ANSYS Share Price (Last 5 Years) 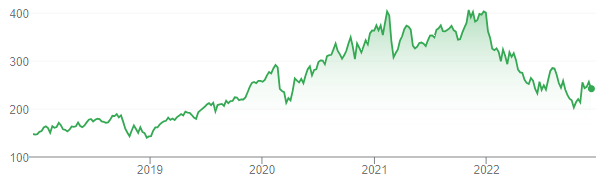 Google Finance (11-Dec-22). |
We downgraded our rating on ANSYS from Buy to Hold in May 2020, when the share price was $263.51. ANSS stock is now 7% lower than at the time of our downgrade, though having first risen by 57%.
We believe ANSYS stock is still too expensive. Relative to the mid-point of 2022 guidance, its P/E is 32x on Non-GAAP EPS and 48x on GAAP EPS. Operational performance has been strong, with revenue growth again at mid-teens (excluding currency) in Q1-3, and EBIT margin expanding year-on-year. Management appears confident that ANSYS’ financials will be resilient even in the event of an economic downturn. Our forecasts, based on a 13% EPS CAGR and a 27x P/E (both on a Non-GAAP basis), indicate a total return of 24% (7.2% annualized) by 2025 year-end, below our target. We continue to wait for a better entry point or evidence that the current P/E is sustainable. Avoid for now.
Why We Downgraded ANSYS – Recap
We downgraded ANSYS primarily on valuation, which we saw as too expensive, especially once non-cash Share-Based Compensation (“SBC”) and acquisition costs were taken into account:
- ANSYS sells highly differentiated and mission-critical products on a mostly recurring model. As a result, revenues and Annualized Contract Value (“ACV”) have both grown at low-double-digit CAGRs during 2018-21.
- However, costs grew even faster at a CAGR of nearly 20% in 2017, leading to both GAAP and Non-GAAP EBIT growing much slower than revenues, at CAGR of 2.5% and 9.0% respectively during 2018-2021.
|
ANSYS Key P&L Items (2017-21) 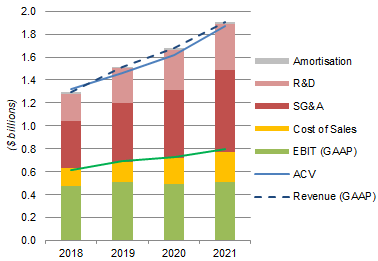 ANSYS company filings. |
- Share issuance, both for SBC and acquisitions, has exceeded repurchases in recent years, with the result that the average number of shares (diluted) rose by 2.5% during 2018-21, further reducing EPS growth.
- The gap between GAAP and Non-GAAP Net Income has widened significantly in recent years (as has FCF/ Net Income), which means that P/E multiples based on Non-GAAP EPS have become much less meaningful.
|
ANSYS Net Income & Cash Flows (2016-21) 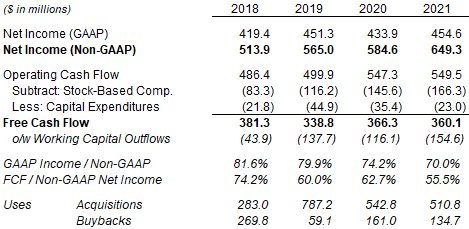 ANSYS company filings. |
At its latest Investor Day in September, ANSYS set out new financial targets for 2022-25, which included:
- ACV CAGR of 12% (including acquisitions).
- Operating expenses growing “in line” with revenues (and both growing slower than ACV).
- Operating cash flows growing faster than ACV.
|
ANSYS Key Growth Rates – Past vs. Future 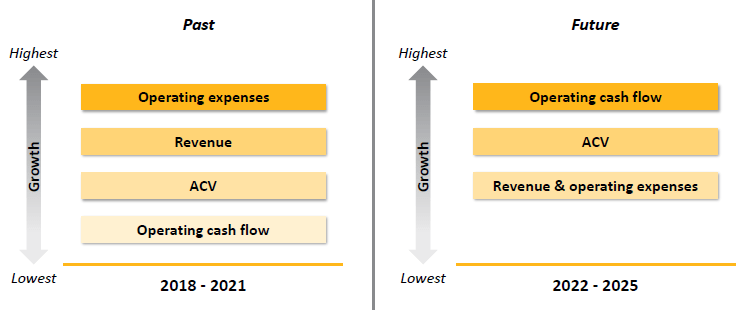 ANSYS investor update (09-Aug-22). |
ANSYS’ stock is still too expensive in our view, though operational performance continues to be strong.
ANSYS Revenues vs. ACV: A Reminder
ACV is a better measure of ANSYS’ growth each quarter, though it only differs slightly from revenue over a year.
ACV basically reflects the annualized value of bookings starting in each time period. Management came up with it because revenues tend to be artificially boosted by the upfront recognition of revenues in large multi-year contracts:
|
ANSYS Annualized Contract Value Definition 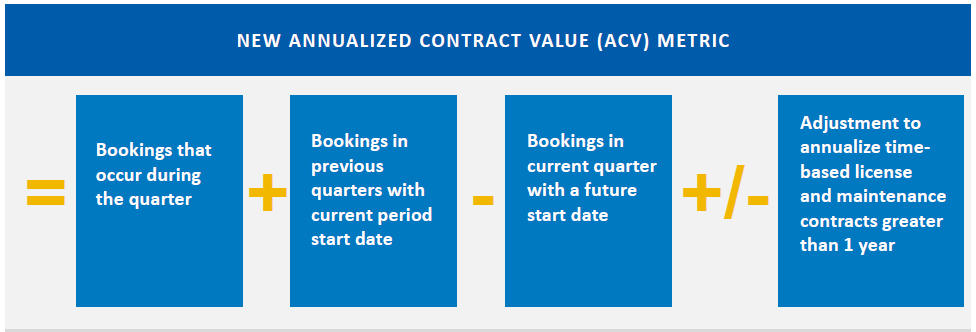 ANSYS results presentation (Q2 2019). |
ANSYS’ reported revenues tend to exceed ACV each quarter, except the seasonally-heavy Q4 where there are typically more large new contracts; over a full year, revenues have exceeded ACV by 2-4% each year since 2018:
|
ANSYS Revenues & ACV By Quarter (Since Q4 2018) 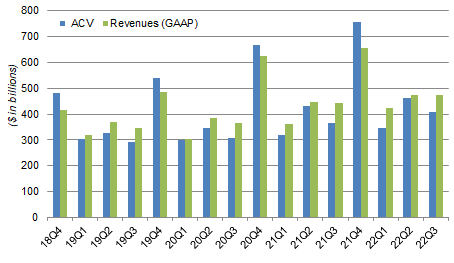 ANSYS company filings. |
The modest difference between full-year ACV and revenue figures means annual EPS and FCF still mostly reflect what ANSYS earns in a year, except in Non-GAAP EPS where non-cash SBC costs are excluded.
ANSYS Valuation: Still on 48x GAAP EPS
Based on the mid-point of the latest 2022 guidance at Q3 results, ANSYS shares have a P/E of 32x on Non-GAAP EPS and a P/E of 48x on GAAP EPS; the Free Cash Flow (“FCF”) Yield is 1.9%:
|
ANSYS Cash Flows & Valuation (2022E) 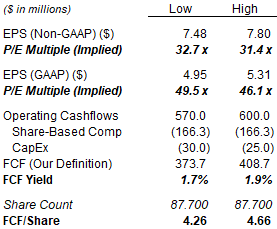 ANSYS company filings. NB. Assume share-based compensation costs to be the same as 2021. |
Compared to previous guidance at Q2 results, there has been a small upward revision in operational performance but a small downward revision in actual performance after the dollar has strengthened further:
- ACV growth excluding currency: 12.0-13.4% (was 11.3-13.5%)
- ACV growth: 5.6-6.9% (was 5.8-8.0%)
- Revenue growth excluding currency: 10.1-11.9% (was 9.2-11.8%)
- Revenue growth: 3.5-5.4% (was 3.8-6.4%)
- Non-GAAP EPS: $7.48-7.80 (was $7.50-7.88)
- GAAP EPS: $4.95-5.31 (was $4.91-5.39)
ANSYS has historically raised its guidance slightly in most quarters, likely due to conservatism built into initial guidance.
Relative to 2021 financials, ANSYS shares have a P/E of 33.0x on Non-GAAP EPS and a P/E of 47.1x on GAAP EPS; the FCF Yield is 1.7%.
Continuing Strong Operational Performance
ANSYS has continued to perform strongly in operational terms.
As of Q3 2022, ANSYS’ Last-Twelve-Month (“LTM”) ACV was up 10.6% year-on-year (after currency headwinds):
|
ANSYS Last-Twelve-Month ACV (Since Q4 2018) 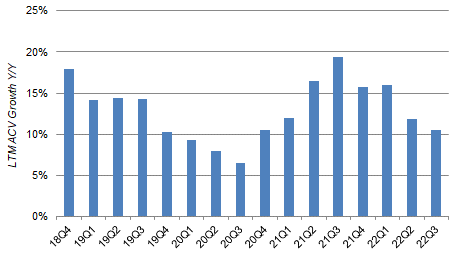 ANSYS company filings. |
While the year-on-year growth rates on LTM ACV appear to be decelerating, this is in part a result of tougher prior-year comparables. Relative to pre-COVID 2019, LTM ACV growth has been broadly consistent in recent quarters, growing between 40.6% and 41.2% over 3 years in the past 4 quarters (notwithstanding a stronger dollar).
As of Q3 2022, year-to-date revenues were up 14.7% year-on-year excluding currency (and 8.5% including currency), and both GAAP and Non-GAAP EBIT grew faster than revenues, implying an expansion in both EBIT margins:
|
ANSYS P&L and Cash Flows (Q3&YTD 2022 vs. Prior Year) 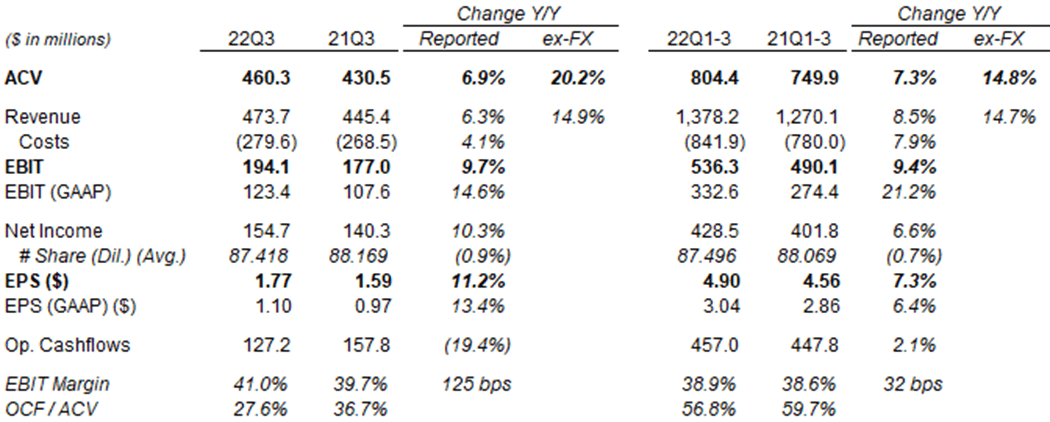 ANSYS results release (Q3 2022). NB. All figures are non-GAAP unless otherwise stated. |
That year-to-date GAAP EBIT grew 21.2% year-on-year, much more than Non-GAAP EBIT, is the result of Amortization expenses growing “only” 11%, SBC costs staying roughly flat, as well as restructuring and other expenses actually halving year-on-year.
However, the strong growth in GAAP EBIT year-to-date is not conclusive, given the disproportionate weight of Q4. GAAP EBIT also showed a 15.8% year-on-year growth in Q1-3 in 2021, before finishing the year up only 3.4%:
|
ANSYS Key P&L Items (2017 to 2022 YTD) 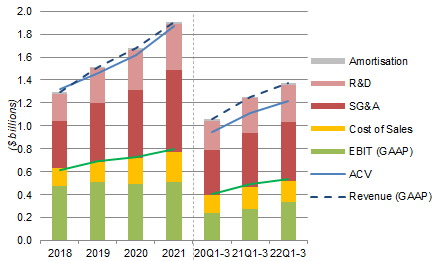 ANSYS company filings. |
ANSYS’ operational performance is on track, but Q4 results will be key to demonstrate management’s cost discipline.
Likely Resilience in a Recession
Management is confident that ANSYS’ financials will be resilient even in the event of an economic downturn.
As CEO Ajei Gopal explained on the Q3 2022 earnings call:
“The nature of the business model, the nature of the ability to monetize that relationship, all of that translate into our ability to be very resilient, no matter what happens out there in the market … And we talked about our geographical distribution as well. So that gives us the ability to be resilient when a particular industry changes or when there are particular challenges in an individual market.”
2020 was an example of ANSYS’ resilience, when it grew its ACV by 9% at constant currency and its revenues by 11% in U.S. dollars in 2020, despite the disruption from COVID-19. ANSS’ share price did fall by 27% between mid-February and late March that year but ultimately rose by more than 40% that year (albeit to an overvalued level).
Despite macro concerns, especially in the Technology sector, ANSYS continues to win large contracts there in Q3, including a $59m three-year agreement with an international electronics company and a seven-figure contract with a “long-time Space 2.0” company.
ANSYS Likely To Return Around 7% Annually
We revised the assumptions in our forecasts slightly:
- 2022 Non-GAAP EPS to be $7.79 (unchanged)
- From 2023, Net Income to grow by 13.5% annually (was 12%)
- 2022 share count to be 87.6m (unchanged)
- From 2023, share count to grow by 0.5% annually (unchanged)
- P/E at 27.0x at 2025 year-end (unchanged)
The new 13.5% growth in Net Income assumes ANSYS will do moderately better than its 2022-25 targets (including a 12% CAGR in ACV and expenses growing in line with revenues).
The assumed 27x P/E multiple on Non-GAAP EPS implies an 18% de-rating from the present. Assuming the current 70% ratio between GAAP and Non-GAAP Net Income will continue, this implies a 38.5x P/E on GAAP EPS. The relatively high P/E assumed reflects in part the possibility that ANSYS will be acquired by a strategic buyer.
Our new 2025 EPS forecast is $11.22, 4% higher than before ($10.78):
|
Illustrative ANSYS Return Forecasts 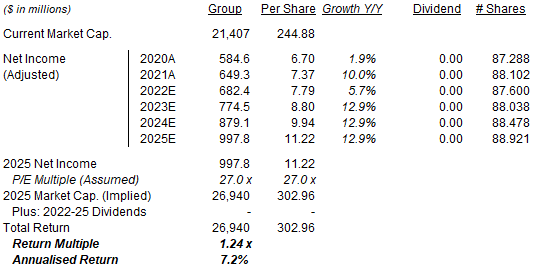 Librarian Capital estimates. |
With shares at $244.88, we expect a total return of 24% (7.2% annualized) by 2025 year-end, below our target.
Is ANSYS Stock A Buy? Conclusion
With its differentiated and mission-critical products, ANSYS has continued to grow revenues at 10%+ at constant currency. We expect the impact of any recession to be modest and temporary.
Medium-term targets set out at the investor day in September include a stable EBIT margin, which means EBIT should grow in line with revenues. ANSYS has delivered on this so far, but Q4 results will be key.
ANSYS stock remains too expensive relative to our valuation views, with a P/E of 32x on guided 2022 Non-GAAP EPS and 48x on GAAP EPS. We expect a de-rating of about 18% from current levels.
We raise the assumptions in our forecasts, with an EPS growth of around 13% from 2023, but mostly offset by the expected de-rating, resulting in a 7% annualized return, below our target.
We continue to wait for a better entry point or evidence that the current P/E is sustainable. Avoid for now.
Be the first to comment