

G0d4ather/iStock via Getty Images
Brian Dress, CFA – Director of Research and Investment Advisor
For most of 2022, market news has been negative, with inflation and interest rates on the rise, war raging on in Eastern Europe, and investors trying to make sense of exaggerated valuations in growth stocks. Throughout most of the first three months of 2022, we have shared with you our pessimistic view.
This week was marked by positive price action in the major US stock indexes, which is the first time we have seen two positive weeks in a row in 2022. Clearly the mood on Wall Street is changing. In this week’s letter, we plan to assess whether we think this week’s trading was a blip in the bear market or if we should expect lasting resumption of an uptrend.
To end the suspense, we think the markets are showing signs of bottoming. Investors are responding positively to good news and even negative news is starting to be met with buying. The indiscriminate selling that we have observed for most of this year is beginning to dissipate and we are seeing investors flocking to stocks where business is booming. For us, this is the most important sign that we may be entering a new market regime. Below, we will point out some of the stocks, specifically in the growth and commodities spaces, that are exhibiting strength. From our point of view, we think a “barbell” approach to portfolio construction could offer a way for investors to take advantage of a market recovery, while providing buoyancy, should the downtrend resume. In the section entitled “The Barbell Portfolio: Starting to Perform,” we will explain the concept of a barbell portfolio and how it may be applicable to the current market environment.
Major takeaways from this week are many, as you can see from our table of index performance below. The tech-heavy NASDAQ led things, with more than a 4% advance this week. We saw another strong week from software stocks, which has been among the weakest sectors so far in 2022. Also notable was the $10 per barrel increase in the price of crude oil. Finally, the 10-year US Treasury rate increased sharply again from around 2.1% at the beginning of the week to nearly 2.4% at the end of the week. As we will discuss below, stocks rose despite these major moves in oil and rates, which breaks a pattern we’ve observed over the past six months.
With that all being said, let’s get into it!
Below is the performance data of key indices, ETFs for the five trading days between 3/18/22 and 3/24/22:
|
Index |
Close Price (3/24) |
Weekly Return (%) |
|
S&P 500® (US Broad-Market Index) |
4520.16 |
+2.46 |
|
Nasdaq Composite (Tech+) |
14191.84 |
+4.24 |
|
Russell 2000 (Small Company Index) |
2075.44 |
+0.50 |
|
Emerging Market Index (EEM) |
45.41 |
+1.54 |
|
Oil Price (WTI futures) |
112.34 |
+10.05 |
|
Bitcoin (BTC) |
43960.93 |
+7.35 |
|
Energy Select Sector SPDR Fund (XLE) |
77.06 |
+4.21 |
|
iShares Software Sector ETF (IGV) |
342.58 |
+3.71 |
|
Financial Select Sector SPDR Fund (XLF) |
39.02 |
+0.28 |
|
CBOE Volatility Index (^VIX) |
21.67 |
-15.58 |
What’s Working?
The basis of our “What’s Working?” and the “What’s Not Working?” segments in our newsletter is our Jarvis securities evaluation system. We use the patterns we see in that data to determine where we see pockets of strength and weakness.
For the second straight week, we saw strength in some of the “risk on” sectors that we follow as a barometer of market sentiment. Among the strongest ETFs in our list from that category were the Grayscale Ethereum Trust (ETH), Bitwise Crypto Industry Innovators ETF (BITQ), and the Grayscale Bitcoin Trust (BTC). From our observation, crypto assets are risk assets, above all else. Therefore the sustained buying we have observed there over the past two weeks is an indication that investors are feeling more comfortable with risk. Another risk indicator that rose sharply was Renaissance IPO ETF (IPO).
Cannabis has persistently made its appearance on the list of “What’s Not Working?” since we began to write this newsletter. Even the ETFMG Alternative Harvest ETF (MJ) performed well this week, rising by more than 10% on the week.
Commodities also exhibited leadership in the markets this week. As you would expect with crude oil up nearly 10% this week, we saw the United States Brent Oil Fund, LP (BNO), United States Natural Gas Fund, LP (UNG), and United States Oil Fund, LP (USO). Interesting to us is the fact that while oil, the commodity, was strong, oil company stocks were not as strong. As we have noted in recent weeks, we are seeing a decoupling of oil stocks from the oil price. While this may be disappointing short term, on a week like this, we think it is healthy. With that said, Energy Select Sector SPDR Fund (XLE) still advanced more than 5% this week.
Finally, materials filled out the list of “What’s Working?” SPDR S&P Metals and Mining ETF (XME), VanEck Steel ETF (SLX), and iShares MSCI Global Metals & Mining Producers ETF (PICK) all rose by 7% or more this week. Even though growth stocks are finding buyers, it is not changing the trend apparent in the commodity space.
What is Not Working?
As mentioned above, interest rates are on a sharp rise, with the 10-year US Treasury moving from 1.70% at the beginning of March to above 2.4% now. Certain segments in the market have high sensitivity to the movement of interest rates and those were the weakest ETFs in our list this week.
As an example, the iShares U.S. Home Construction ETF (ITB) fell by nearly 7% over the past week, with New Home Sales falling in February, as rising rates threaten the positive trajectory of the housing market. Other weak ETFs over the past 5 days of trading also fall in the same interest-rate sensitive category: PIMCO Municipal Income Fund (PMF), BlackRock Corporate High Yield Fund Inc (HYT), and Invesco Emerging Markets Sovereign Debt ETF (PCY).
Bottoming Process Continues: Another Strong Week
What we covered largely last week was the question that many us have been asking: “is the market putting in a bottom?” We told you that we were beginning to feel optimism with respect to that question, but we were looking for additional confirmation to sound an “all-clear”. This week we are not completely ready to signal an end to the bear market, but we think there is more evidence emerging to help us answer the question in the affirmative.
As we look back on the market’s movement since the beginning of 2021, we can pinpoint the start of the bear market (at least in growth stocks) with the high-water mark on February 9, 2021. That means that we have had a bear market in the NASDAQ for more than 13 months, as of today. As we take a look at the chart of the NASDAQ composite for the month of March, we see that there was a clear inflection point on March 14, corresponding with the Fed meeting from which we learned of the first interest rate hike. Remember, we told you last week about the historical pattern that markets often bottom at the beginning of the interest rate hiking cycle.
Trading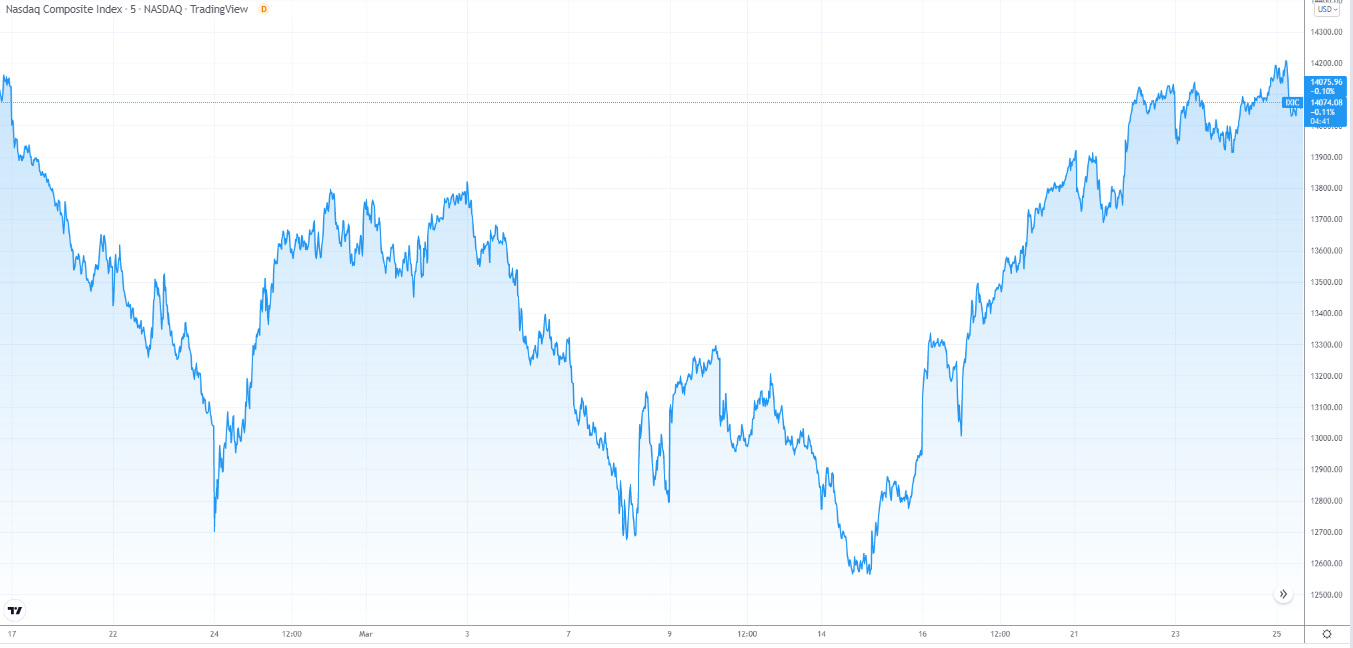
This week we did a bit more research on bear markets and how they end. According to Hartford Funds, the average bear market lasts for just 289 days, as compared to the average bull market that lasts more than 900 days. By now, we have eclipsed the average length of a bear market. While it would be foolish to call an end to the bear based on this concept alone, we think it is reasonable to begin considering that the pronounced selling may be coming to an end, as the speculative fever generated throughout the 2010s and during the pandemic begins to work its way out of the market.
Plenty of other indicators are suggesting to us that things may be changing in markets. One such indicator is the linkage between the 10-year Treasury rate and the NASDAQ Composite Index. Since the beginning of 2021, every time the 10-year rate ticked higher, growth stocks appeared to tick down, mainly on concerns that future earnings carry a lower present value, as interest rates rise. Over the last two weeks, we know that treasury rates have risen with scarcely a pause, while NASDAQ stocks have methodically risen. This week NASDAQ stocks rose more than 4%, despite rates moving higher by more than 20 basis points. The break in this linkage between rates and growth stocks is crucial: we know rates are going to move higher over the next year due to the Federal Reserve’s telegraphed plan, so if this relationship does not come to an end, growth stocks would continue to be under pressure as the Fed normalizes rates.
Also important to note is the downward trend in the volatility index (VIX). For much of 2022, the VIX has traded above 30, which indicates an elevated level of caution among the investing public. Over the last two weeks, the VIX has fallen from above 30 to just above 20, which is the level where the index tends to trade in times of normal market activity. This is another data point that makes us think that things are improving across the broader market.
Again, we are hesitant to call an end to the bear market, once and for all. However, we are seeing “bottoming” action in a number of previously downtrodden stocks, including Tesla (TSLA), Nvidia (NVDA), DocuSign (DOCU), EPAM Systems (EPAM), Splunk (SPLK), Roku (ROKU), and many others. These are the types of stocks we will be watching closely over the coming weeks as barometers of market sentiment.
The “Barbell” Portfolio: Starting to Perform
For most of 2022, we have been constructive on energy and materials shares, which have performed quite well. However, historically, Left Brain has been attracted to businesses with accelerating fundamentals and expanding total addressable markets. At least in the recent past, that has led us to growth stocks in technology, communications services, and consumer discretionary, among a few other areas.
With the growth sector beginning to show some strength, we feel the itch, like other investors, to get back involved with some of those growth businesses that we had favored over the past five years. However, as other investors may be feeling, we still have some trepidation about jumping headlong back into growth stocks with high valuations, the types of which have fallen 40%, 50%, 60% or more since that February 2021 high-water mark.
One way we think investors might be able to wade back into the growth stock waters is to develop a “barbell” portfolio. Imagine how a barbell looks, with weight in the two extremes. In this case, the two “extremes” are deep value stocks and growth stocks. We still like “deep value” sectors like energy and materials stocks for two major reasons: earnings growth and multiple expansion. These stocks are likely to perform as commodity prices rise, which we think is a condition that may hurt the price of growth shares. With the value shares in a portfolio to provide ballast, we are then empowered to look for higher risk growth stocks as a complementary allocation. In a portfolio context, with the barbell, we are able to search for opportunities in beaten down growth stocks, while mitigating the risk level of the overall portfolio.
SmartTrust
Takeaways from this Week
This week we saw a second straight week of market strength. With how weak things have been in 2022, this was the first time all year that we observed two consecutive weeks of positive market action. With the VIX index moving lower and growth stocks moving higher, in spite of rising oil prices and interest rates, we are getting more optimistic about the trajectory of things in markets.
Energy and materials shares remain strong, while we are starting to see compelling opportunities in the types of growth stocks have led the market over the last five years. One way to bring balance to your portfolio and mitigate risk may be the “barbell portfolio,” which we favor in the current market conditions.
DISCLAIMER: This report contains views and opinions which, by their very nature, are subject to uncertainty and involve inherent risks. Predictions or forecasts, described or implied, may prove to be wrong and are subject to change without notice. All expressions of opinion included herein are subject to change without notice. Predictions or forecasts described or implied are forward-looking statements based on certain assumptions which may prove to be wrong and/or other events which were not taken into account may occur. Any predictions, forecasts, outlooks, opinions or assumptions should not be construed to be indicative of the actual events which will occur. Investing involves risk, including the possible loss of principal. The opinions and data in this report have been obtained from sources believed to be reliable; neither Left Brain nor its affiliates warrant the accuracy or completeness of such, and accept no liability for any direct or consequential losses arising from its use. In addition, please note that Left Brain, including its principals, employees, agents, affiliates and advisory clients, may have positions in one or more of the securities discussed in this communication. Please note that Left Brain, including its principals, employees, agents, affiliates and advisory clients may take positions or effect transactions contrary to the views expressed in this communication based upon individual or firm circumstances. Any decision to effect transactions in the securities discussed within this communication should be balanced against the potential conflict of interest that Left Brain, its principals, employees, agents, affiliates and advisory clients has by virtue of its investment in one or more of these securities.
Past performance is not indicative of future performance. The price of securities can and will fluctuate, and any individual security may become worthless. A high or favorable rating, rating outlook, gauge, or similar opinion is not indicative of future performance, and no user should rely on any such rating, rating outlook, gauge, or similar opinion to predict performance or potential for return. Future performance may not equal projected or forecasted performance or potential for return. All ratings and related analysis, as well as data, statistics, analysis and opinions contained herein are solely statements of opinion and are not statements of fact or recommendations to purchase, hold, or sell any security or make any other investment decisions.
This report may contain “forward-looking” information that is not purely historical in nature. Such information may include, among other things, projections and forecasts. There is no guarantee that any forecasts made will materialize. Reliance upon information herein is at the sole discretion of the reader.
THE REPORT IS PROVIDED ON AN “AS IS” AND “AS AVAILABLE” BASIS WITHOUT REPRESENTATION OR WARRANTY OF ANY KIND. Left Brain Investment Research LLC DISCLAIMS ALL EXPRESS AND IMPLIED WARRANTIES WITH RESPECT TO THE REPORT, INCLUDING, BUT NOT LIMITED TO, ANY WARRANTIES OF ACCURACY, TIMELINESS, COMPLETENESS, MERCHANTABILITY OR FITNESS FOR A PARTICULAR PURPOSE OR USE.
The Report is current only as of the date set forth herein. Left Brain Investment Research LLC (LBIR) has no obligation to update the Report or any material or content set forth herein.
LBIR is an affiliate of Left Brain Wealth Management LLC, an investment advisor registered with the Securities and Exchange Commission. LBIR is an affiliate of Left Brain Capital Appreciation Fund, L.P., Left Brain Capital Appreciation Offshore Ltd, and Left Brain Capital Appreciation Master Fund, Ltd., all of which are hedge funds managed by Left Brain Capital Management, LLC. The general partner of these hedge funds, Left Brain Capital Management, LLC, is an affiliate of LBIR.
© 2022, Left Brain Investment Research LLC. All rights reserved. Reproduction in any form is prohibited.
Be the first to comment