

Sergei Chuyko/iStock via Getty Images
It may be rare to hear about Star Group, L.P. (NYSE:SGU) mostly because the company owns and operates regional heating oil and propane delivery companies that operate under their own names and brands. So far in 2022, Star Group has acquired five heating oil dealers. In 2021, the company purchased two propane and three heating oil dealers. The purchases are part of the company’s strategy to add more dealers to its portfolio.
The weather is a critical component to Star Group’s financial success. Warmer weather in the first nine months of fiscal 2022 was a contributing factor to a 2.9% decrease in heating oil and propane sales during the period. The company reports that temperatures were 9.3% warmer than normal in the regions where its businesses are located.
Soaring energy commodity prices due to the war in Ukraine have negatively impacted Star Group. This year, the company reports wholesale prices it pays to acquire heating oil and propane more than doubled from the same period in 2021. The company also noted it does not have enough pricing flexibility to pass those increased costs on to customers, which can lead to profit losses for the service it provides to its customers.
When considering these current stories about Star Group, we need to determine which news topics will have a long term and ongoing effect on the company and its share price. While some believe soaring energy commodity prices are a short-term problem that will abate when the war in Ukraine ends, others believe the war’s impact will have a long-lasting impact as much of Europe won’t return to reliance on Russian’s energy. As the continent searches for new supplies of energy, prices could remain elevated.
While current news stories, good or bad, can sway our opinion about investing in a company, it’s good to analyze the fundamentals of the company and to see where it’s been in the past and in which direction it’s heading.
This article will focus on the long-term fundamentals of the company, which tend to give us a better picture of the company as a viable investment. I also analyze the value of the company versus the price and help you to determine if SGU is currently trading at a bargain price. I provide various situations which help estimate the company’s future returns. In closing, I will tell you my personal opinion about whether I’m interested in taking a position in this company and why.
Snapshot Of The Company
A fast way for me to get an overall understanding of the condition of the business is to use the BTMA Stock Analyzer’s company rating score. SGU has high scores for 10-Year Price Per Share, ROE, Earnings per share, Ability to Recover from a Market Crash or Downturn, and Gross Margin Percent. It has low scores for ROIC and PEG Ratio. A low PEG Ratio score indicates that the company may not be experiencing high growth consistently over the past 5 years. In summary, these findings show us that SGU seems to have above-average fundamentals since all but two of categories produce good scores.
Before jumping to conclusions, we’ll have to look closer into individual categories to see what’s going on.
BTMA Stock Analyzer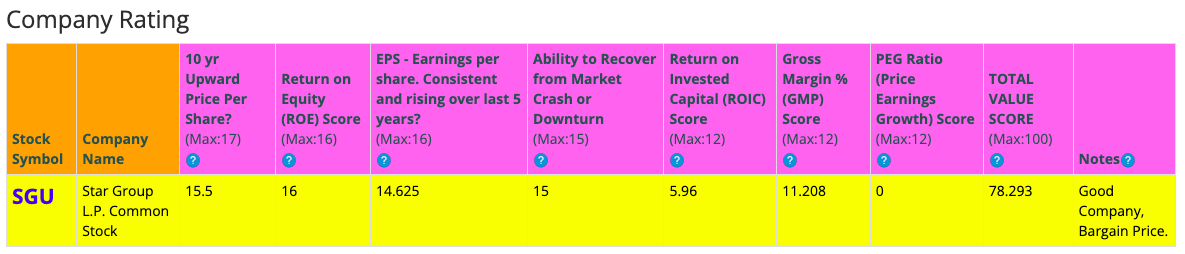
Fundamentals
Let’s examine the price per share history first. In the chart below, we can see that price per share has been mostly consistent at increasing over the last 10 years. The stock moved strongly higher from 2013 to 2017 before levelling off through 2020. The stock moved higher in 2021 before taking a slight dip in 2022. Overall, share price average has grown by about 218.3% over the past 10 years, or a Compound Annual Growth Rate of 13.73%. This is a decent return.
BTMA Stock Analyzer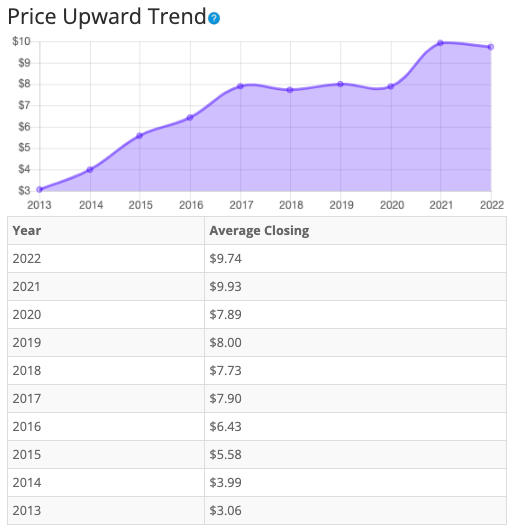
Earnings
Looking closer at earnings history, we see that earnings have grown overall during the past 10 years, with a notable increase in volatility in the last five years. After demonstrating slow and steady increases from 2012 to 2016, earnings fell sharply in 2017. Earnings moved aggressively higher in 2018 before dropping below the 2017 levels in 2019. This was followed by even higher spikes in magnitude in 2020 and 2021.
Star Group’s earnings are impacted by a tough combination of volatile factors than can make plotting the company’s future more difficult than usual. The most-challenging is the cost for its product. When energy prices are lower, the company can buy heating oil and propane at lower costs. When those prices are higher, costs rise, and the company often can’t raise the prices it charges its customers by enough to recover all the excess cost.
On the demand side, weather drives big shifts in how much heating oil and propane its customers will use, especially in winter months. Cold winters drive demand up. Warmer winters result in customers using Star Group’s products less. This lack of control is a concern when considering investing in this company. I don’t like it when a company is at the mercy of uncontrollable consequences, especially if the company lacks pricing power to counterbalance these consequences.
The final factor is acquisitions. The company has been buying more oil and gas dealers to increase revenues. Adding more dealers adds more customers, yet the company has reported net customer losses in 2020, 2021, and thus far in 2022.
Consistent earnings make it easier to accurately estimate the future growth and value of the company. So, in this regard, SGU is a not a good example of a stock to accurately estimate future growth or current value.
BTMA Stock Analyzer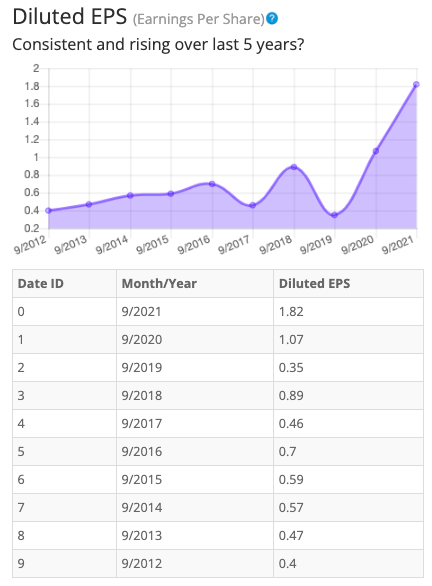
Since earnings and price per share don’t always give the whole picture, it’s good to look at other factors like the gross margins, return on equity, and return on invested capital.
Return On Equity
The return on equity has increased in the period from 2017 to 2021. ROE nearly tripled between 2017 and 2021. And while the company experienced overall growth in ROE during the period, ROE fell dramatically in 2019. For return on equity (ROE), I look for a 5-year average of 16% or more. So, SGU is right above the cusp on meeting my requirements.
BTMA Stock Analyzer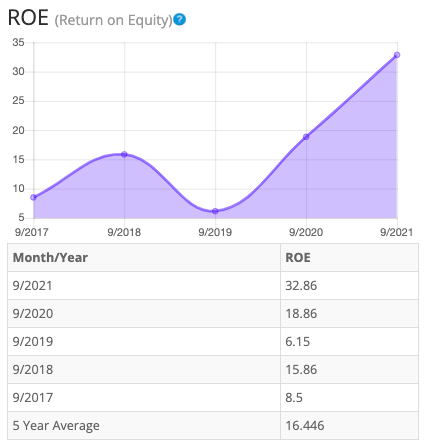
Let’s compare the ROE of this company to its its industry. The average ROE of 21 Oil/Gas Distribution companies is 6.44%.
Therefore, SGU’s 5-year average of 16.44% is well above average, and current ROE of 32.86 is also above average.
Return On Invested Capital
The return on invested capital also experienced a significant increase from 2017 to 2021. Similar to ROE, ROIC cratered in 2019 where it not only declined, but registered the lowest level of the five-year period. The overall average ROE during the timespan was 11.92%. For return on invested capital (ROIC), I also look for a 5-year average of 16% or more. So, SGU does not pass this test.
BTMA Stock Analyzer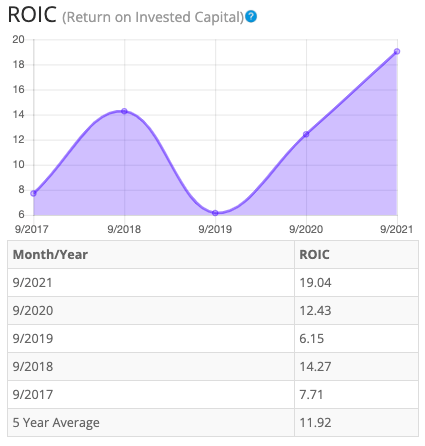
Gross Margin Percent
The gross margin percent (GMP) has been inconsistent over the last five years. GMP fell in 2018 before rebounding slightly in 2019. After a surge in 2020, GMP slipped again in 2021. Overall, GMP is fluctuating in a narrow range and ended up growing overall by less than 1%. Five-year GMP is substandard at around 28.02%. I typically look for companies with gross margin percent consistently above 30%. So, SGU has demonstrated it does not have the ability to maintain acceptable margins over a long period.
BTMA Stock Analyzer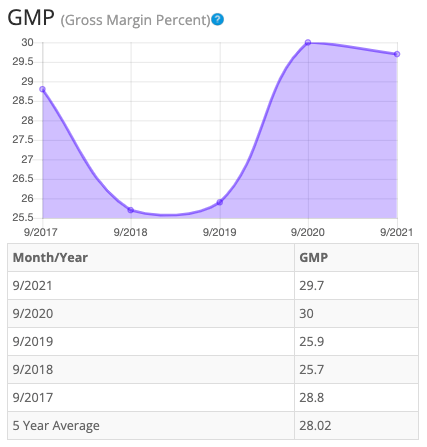
Looking at other fundamentals involving the balance sheet, we can see that the debt-to-equity ratio is less than 1. This is a positive indicator, telling us that the company owns more than it owes.
SGU’s Current Ratio of 0.87 is a red flag, indicating it does not have an adequate ability to use its assets to pay its short-term debt.
Ideally, we’d want to see a Current Ratio of more than 1, so SGU fails to meet this amount.
According to the balance sheet, the company appears to be in mixed financial health. In the long term, the company has more than enough assets to cover its debts. In the short-term, however, the company often finds itself with extremely low levels of cash, requiring it to take on additional debt to fulfill its obligations.
SGU pays a hefty dividend of 7.02% (or 6.84% over the last 12 months).
BTMA Stock Analyzer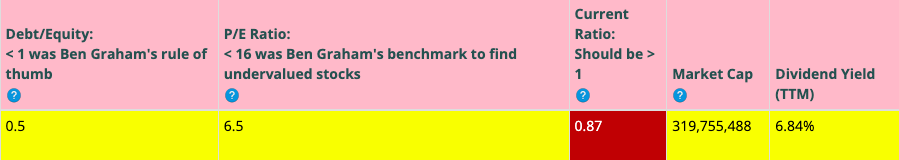
This analysis wouldn’t be complete without considering the value of the company vs. share price.
Value Vs. Price
The company’s Price-Earnings Ratio of 6.5 indicates that SGU might be selling at a low price when comparing SGU’s P/E Ratio to a long-term market average P/E Ratio of 15.
BTMA Stock Analyzer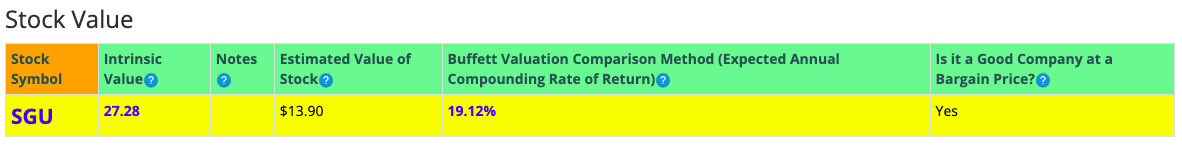
The Estimated Value of the Stock is $13.90, versus the current stock price of $8.54. This indicates that SGU is currently selling at a bargain price.
Summarizing The Fundamentals
According to the facts, Star Group is in so-so financial health. In the long-term, it has enough equity compared with debt. In the short term, the company is relying on rolling lines of credit to cover cash shortfalls as commodity prices soar, product use decreases, and net customers fall.
This company has seen earnings improve over a 10-year period, but volatility to the upside and downside has increased over the past 5 years.
Other fundamentals are weaker, including ROE, ROIC, and Gross Margins. While the company barely meets our standards for ROE, it falls short in ROIC and Gross Margins. Higher energy costs are impacting margins and it’s unclear how long this will last. At current levels, Star Group ‘s business model is not sustainable.
Another consideration is the future of the propane and heating oil industry. As the climate continues to warm, customers will use less oil and gas. That will continue to drive revenues down. Additionally, as renewable energy adoption increases, customer reliance on oil and gas will also continue to decrease. Star Group does not appear to have a plan to adjust its product offerings to align with these transitions beyond buying more dealers to prop up its customer base.
In terms of valuation, my analysis shows that the stock is undervalued.
Star Group Vs. The S&P 500
Now, let’s see how SGU compares versus the U.S. stock market benchmark S&P 500 over the past 10 years. From the chart below, we can see that SGU outperformed the general market from 2015 to 2020. Since then, however, SGU has been more closely tied to the index. It’s also worth pointing out that during the market volatility in 2021 and 2022, SGU has been even more volatile than the S&P 500 during the same period.
Morningstar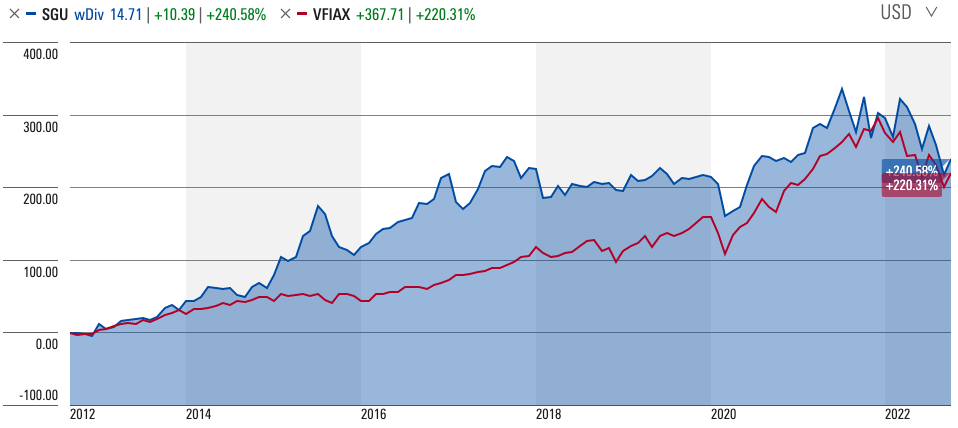
Forward-Looking Conclusion
“There isn’t much analyst coverage of this stock. But, over the next five years, the analysts that follow this sector are expecting the sector to grow earnings at an average annual rate of 6.33%.”
In addition, the average one-year price target for this stock is at $13, which is about a 51.52% increase in a year.
Does Star Group Pass My Checklist?
-
- Company Rating 70+ out of 100? YES (78.3)
- Share Price Compound Annual Growth Rate > 12%? YES (13.73%)
- Earnings history mostly increasing? YES (but earnings have been volatile).
- ROE (5-year average 16% or greater)? YES (16.45%)
- ROIC (5-year average 16% or greater)? NO (11.92%)
- Gross Margin % (5-year average > 30%)? NO (28.02%)
- Debt-to-Equity (less than 1)? YES
- Current Ratio (greater than 1)? NO
- Outperformed S&P 500 during most of the past 10 years? NO
- Do I think this company will continue to successfully sell their same main product/service for the next 10 years? YES
Star Group scored 6/10 or 60%. Therefore, SGU doesn’t seem like it would currently be worth my considering as a potential investment, according to its qualitative analysis.
Is Star Group Currently Selling At A Bargain Price?
- Price Earnings less than 16? YES (6.5)
- Estimated Value greater than Current Stock Price? YES (Value $13.90 > $8.54 Stock Price).
Valuation metrics suggest that Star Group might be selling at a bargain price as indicated by the Estimated Value. This is reinforced by the Price to Earnings Ratio, which also indicates that it might be at a low price.
In conclusion, Star Group has some positives. It seems to be currently selling at a bargain price. In addition, it offers an attractive dividend of 6.84%. Finally, it’s a company that sells a necessary service, since people depend on the company for providing heating for their homes.
However, in my opinion the negatives outweigh the positives. Star Group fell short of meeting enough of my qualitative analysis requirements for consideration as a potential investment at this time. Also, my main issue with this company is that it lacks pricing power.
Star Group’s earnings are impacted by fluctuations in energy prices, weather conditions, and supply/demand pressures. Unfortunately, Star Group doesn’t have control over these forces. Plus, it lacks pricing power, since it often can’t raise the prices it charges its customers by enough to recover all the excess costs of these uncontrollable forces.
I’m passing on Star Group at this time. I would invest my time and money into other better businesses selling at bargain prices that have more pricing power.
Be the first to comment