

We Are/DigitalVision via Getty Images
Where is this market (NYSEARCA:SPY) going? Put $364 in the white circle, at the center of the target shown above. If we know that, then we can make money in this bear market. You don’t even have to know technical analysis. You don’t have to be brilliant to know that we are in a bear market. You know the big reason is that the Fed is forced to raise interest rates to bring inflation down by slowing this overheated economy.
When Will It Hit $364?
The only thing you don’t know is how low the SPY is going before it bottoms and starts a new bull market. We think this newly confirmed bear market is targeting a retest of the bottom at $364, but it is not going straight down and it could go lower. We expect bounces at support levels like ~$404. We think the SPY will test the bottom in October.
You will see big bounces in a bear market like the one we just had. That confuses matters because it gives a false signal that the bear market is over. But common sense tells you it can’t be over. The economy is still good. Unemployment is very low. Inflation is not going to come down until these factors change. Powell just reminded us of “the pain” ahead. Thus this leading indicator, bear market continues until these factors change. This is predictable. The SPY is going lower.
Will The Fed Continue Raising Rates?
The Fed will keep raising rates. This bear market is anticipating that because the market is a leading indicator of the economy. We are in the first half of this bear market that is still looking for a bottom. The second half of this bear market will be when the bottoming process starts. Then there will be some attempts to get off the bottom. Finally there will be a breakout and the start of the next bull market.
Knowledge is power and you have the knowledge of what this market is going to do. You just don’t know when it is going to happen. However, you always can see the next step and knowing that, you can make money. The signals on the chart below always tell you where demand and supply are going. Knowing that, you know where price is going. Are there surprises? Of course, nothing is perfect.
Why Did You Issue A “Sell” Last Week?
Last Sunday we knew the next step and in our article we moved from a “Hold” to a “Sell” on the SPY. We did not know that Friday would take the market down the way it did. We did know that something would take the market down. How did we know? The sell signals on the chart told us and we showed these to you. What created those sell signals? Fundamental factors like increasing interest rates triggered those sell signals on the SPY chart. Demand changed to supply. Our chart did not create the supply. Selling by fundamentals-driven institutional investors created this supply that was triggering our sell signals on the chart. Institutions always sell into a strong market.
What’s Next?
So what is the next step? Where are supply and demand taking price? As you can see on the chart below, all the technical signals at the bottom of the chart are dropping from demand down to supply. As long as these signals stay down, price for the SPY keeps going down. As long as the fundamentals are bad, supply stays on the chart, until we get a technical bounce from oversold.
When the sellers are exhausted and bargain hunting, fundamental buyers come back in, these signals will turn up for a bounce. The big bounce that starts the next bull market is nowhere in sight. That’s because the bear market is still going down looking for a bottom. This is a well known, historical pattern for bear markets. There are no secrets here, except for those who have not lived through bear markets or studied their case histories to obtain that case study experience.
How Can You Make Money?
To make money in the SPY you can buy long term, out of the money put options as the market continues testing the bottom. Day-traders can use the ProShares UltraShort S&P 500 (SDS) which goes up as the market goes down. For the bounces they can use the ProShares Ultra S&P 500 (SSO). It is easier to make money on the long term target of $364 for the SPY than day-trading the 5-minute moves down to support levels and the bounces up to resistance. Day-traders are dodging minute to minute news headlines.
Short term, we will see signals turn up for a short technical bounce, fail and then turn down again until we get to $364 or some other level. Then we will get another big bounce like the one we just had that tested the 200-day downtrend at $428. That bounce is over and now the SPY is targeting the bottom again.
Conclusion
We have labeled all the sell signals on the chart below that were triggered. If you go back over my weekly articles, you will see how the sell signals were triggered one by one, like dominoes falling. Or, using a free trial, you can see my daily article on the SPY. Until these signals change, the SPY is targeting a retest of the bottom at ~$364. We think it goes lower than $364. You can make money with that knowledge! When these signals reverse, we will label the buy signals as they are triggered one by one and then we will change our Sell signal to Buy for the bounce. You will make money with that knowledge.
SELL SIGNALS TARGET $364 (StockCharts.com)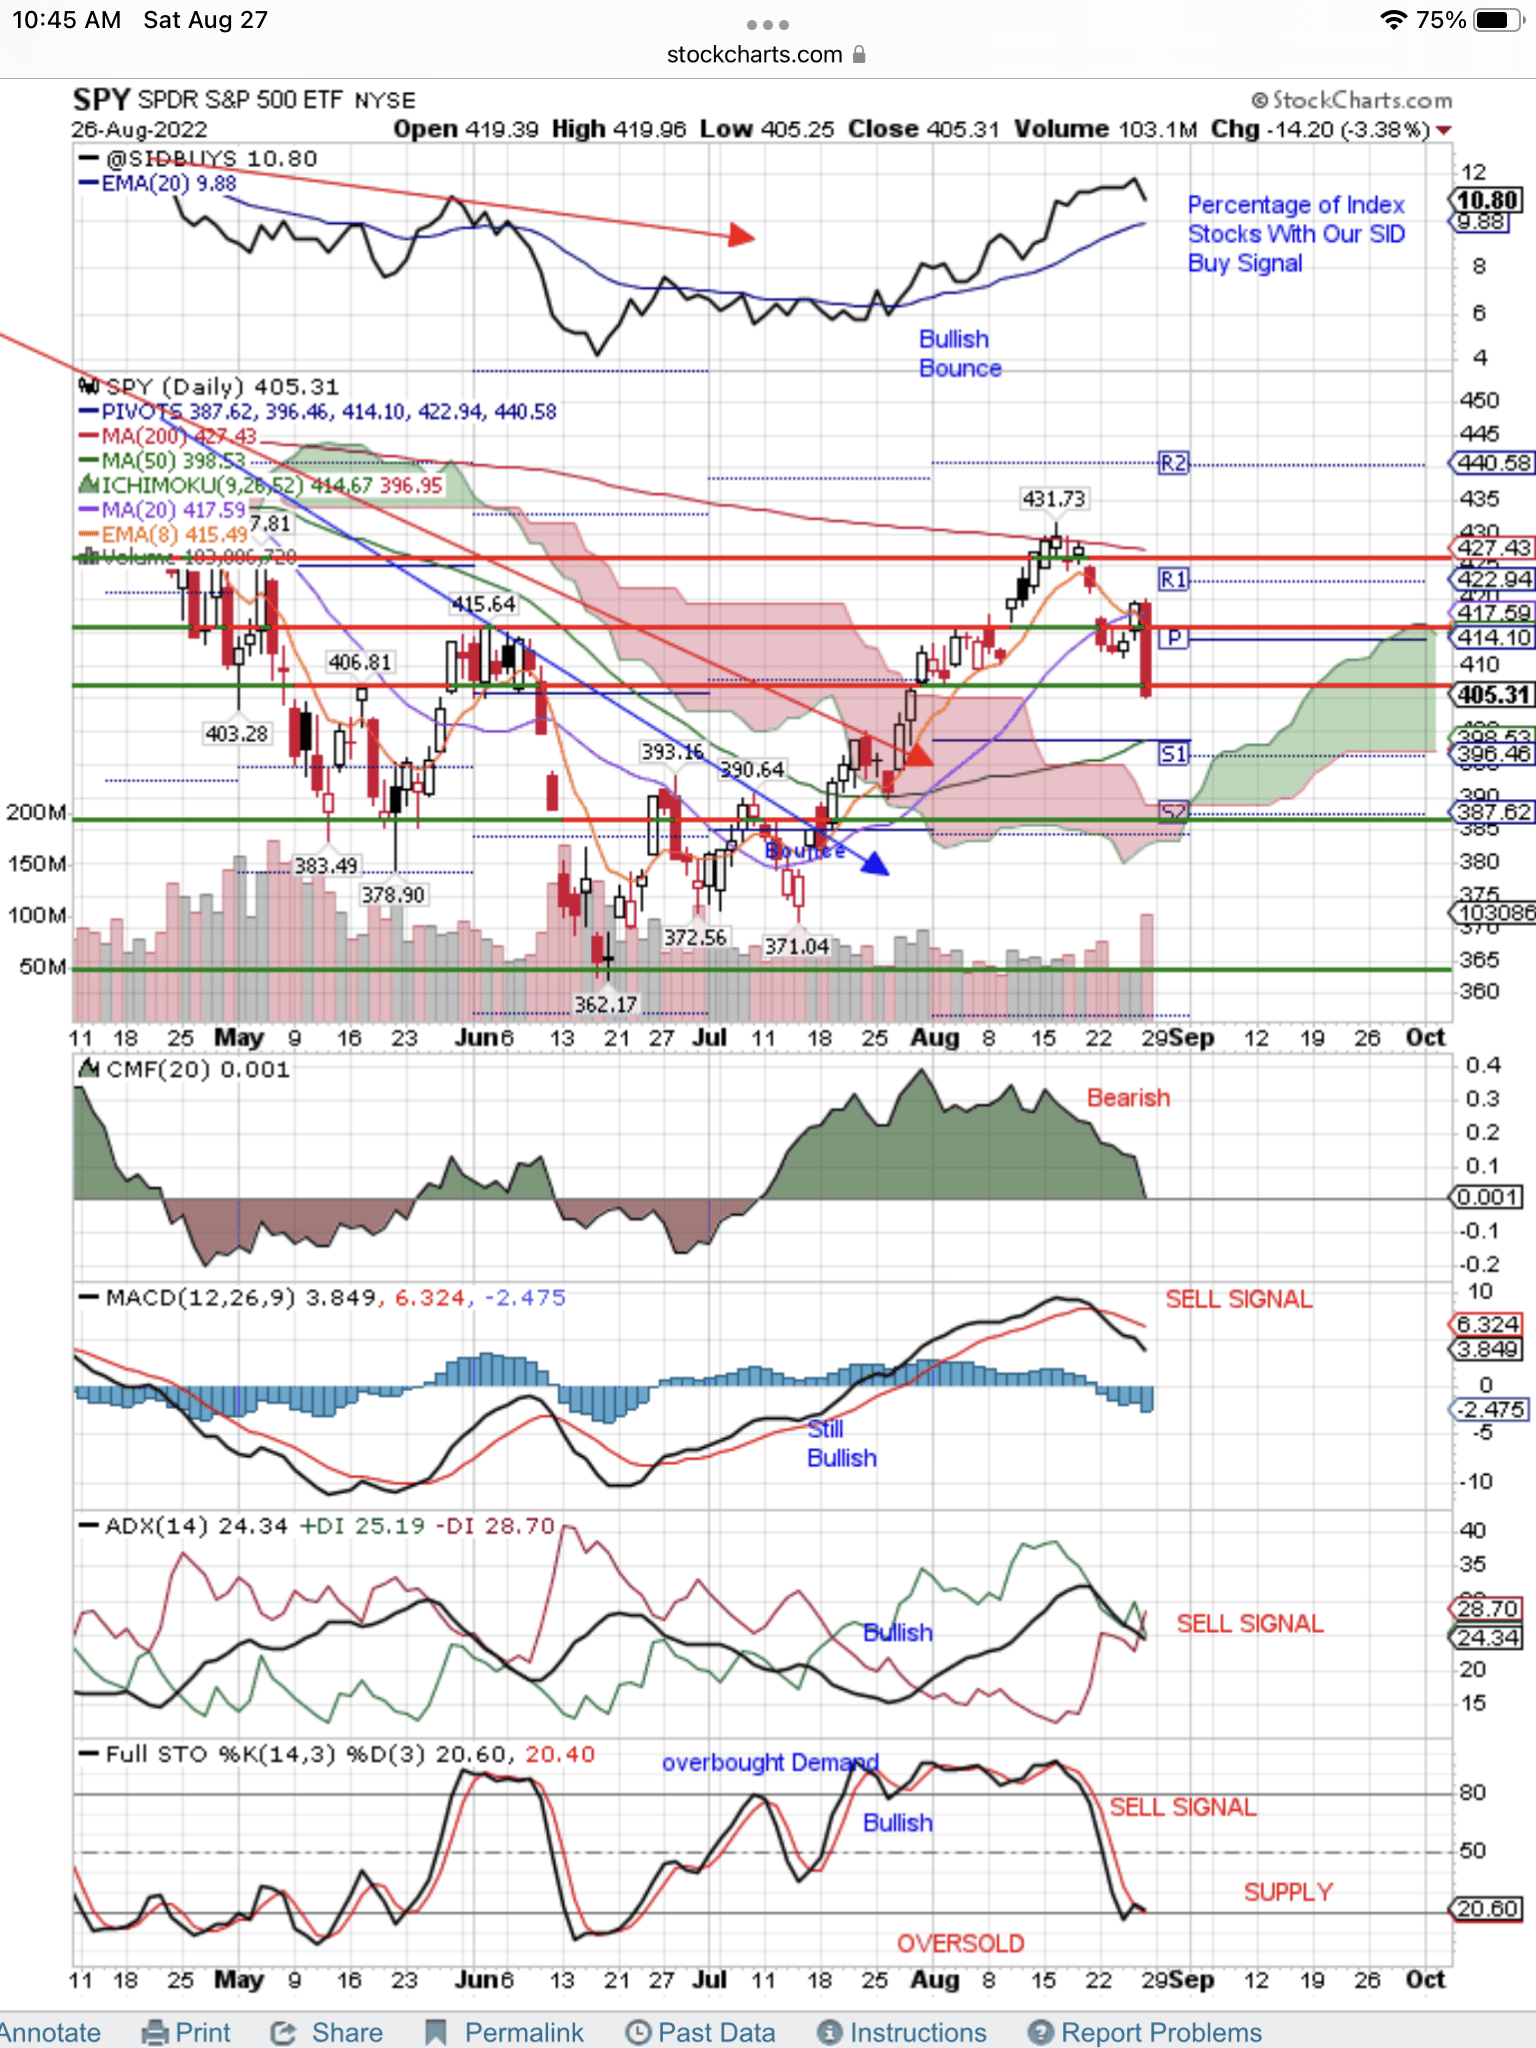
Be the first to comment