

claffra
Introduction
Johannesburg-based company Sibanye Stillwater (NYSE:SBSW) released its six-month earnings results and year-ending June 30, 2022, on August 25, 2022.
Important note: This article is an update of my article published on April 28, 2022. I have been following SBSW on Seeking Alpha since Feb. 2014.
1 – H1 2022 Results Snapshot
Sibanye’s balance sheet is particularly complex and requires some focus and attention to understand the business model entirely.
The company produces Palladium, platinum, and Rhodium in the USA (with a bit of gold and other metals) from direct mining and recycling (which generates a much lower profit margin). It also produces Iridium, Ruthenium, Chrome, Nickel, and others.
Note: Nickel is a recent addition after the company acquires the Sandouville Nickel refinery in France.
However, the lion’s share of the revenue for Sibanye Stillwater comes from South Africa and its production of Rhodium.
Sibanye reported profits for H1 2022 attributed to SBSW shareholders of $782 million and revenue of $4,570 million. The company’s total profits decreased 54.2% from H1 2021.
The company ended H1 2022 with net cash of $391 million (net debt-free).
Sibanye also came up with a record-adjusted free cash flow estimated at $829 million. For the year 2021, here are the data in Rand:
SBSW Income Statement in Rand H1 2022 (Sibanye Stillwater Presentation)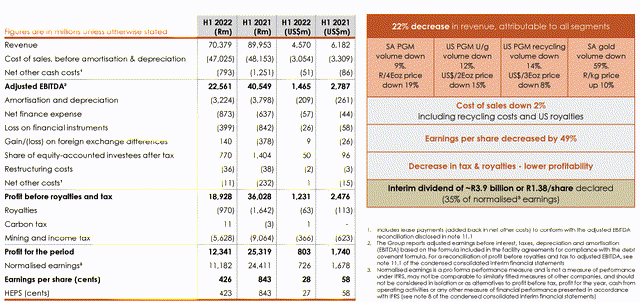
This period was particularly challenging for Sibanye Stillwater due to significant disruptions experienced at the SA gold and US PGM operations.
2 – Investment Thesis
I have been following Sibanye Stillwater for many years, and I believe the company is an excellent candidate for a long-term investment. I got involved with Sibanye Stillwater after the company acquired the US palladium and platinum miner Stillwater.
SBSW is a solid company that I recommend for the long term because of its diversity and capacity to adapt. However, the company faces numerous challenges and is tightly correlated to the price of metals which fluctuates widely. In the press release Sibanye said:
With both the SA gold and US PGM operations resuming production from suspended operations during H2 2022, the outlook for the remainder of 2022 is significantly improved. The Group is financially sound, generating positive cash flow, with a robust balance sheet offering significant financial flexibility. We are well positioned both to endure the prevailing economic down-cycle, and also benefit from value opportunities which may eventuate.
Notably, the Stillwater mine experienced severe flooding and pushed the company to revise its production outlook.
Sibanye Stillwater Ltd. cut this year’s forecast for its Montana-based palladium and platinum mines after flooding and operational challenges affected production. The Johannesburg-based precious metals producer sees output at its Stillwater mines at 445,000-460,000 ounces this year amid rising costs and flooding in the area in June, according to a presentation published on its website on Thursday. The US mines, which were initially forecast to produce between 550,000 ounces and 580,000 ounces of palladium and platinum, were forced to halt activities for seven weeks after Montana was hit by widespread flooding following a warm spell that led to a rapid melt of snow in the mountains.
Another crucial characteristic that should be factored into your investing strategy is the currency fluctuation between the US dollar and the SA Rand ZAR. If the ratio goes lower, the results translated in US$ will be more significant.
SBSW is a large producer of PGM, especially Palladium and Rhodium, which are essential for the auto industry. However, the company’s gold production segment is a damper, with AISC reaching a whopping $3,115 per ounce sold due to a falling gold production this quarter after wage issues have been resolved.
an agreement was finally reached with the unions on 13 June 2022,
Finally, the company’s strength is its ability to adapt and diversify. Sibanye is now producing Nickel at its recently acquired Nickel refinery in France.
The acquisition of the Sandouville nickel refinery in Le Havre, France was concluded on 4 February 2022. Sandouville produced 3,499 tonnes of nickel metal, 1,066 tonnes of nickel salts and 113 tonnes of cobalt chloride at an average nickel equivalent sustaining cost of R460,397/tNi (US$29,896/tNi). Integration of the Sandouville refinery is progressing in line with expectations with a 10% increase in volumes produced year-on-year resulting from efficiency improvements and good recoveries
Also, its involvement in Battery metals ( Sibanye Battery Metals Proprietary Limited, invested in Verkor by subscribing to a €25 million convertible bond) and is in the process of acquiring a majority stake in Keliber, a Finish minerals group. Keliber is an advanced Lithium Hydroxide project in Finland with an investment of €176 million for 50%+1 shareholding in Keliber Project.
On 30 June 2022, the Group announced its intention to exercise its pre-emptive right to increase its shareholding in Keliber to 50% plus one share. A simultaneous voluntary cash offer was made to minority shareholders of Keliber, other than the Finnish Minerals Group, which if fully accepted, will increase our shareholding in Keliber to over 80%.
And On August 2022, Sibanye Stillwater and Heraeus Precious Metals entered into a partnership to develop and commercialize novel electrolyzer catalysts for the production of green hydrogen. Sibanye-Stillwater and Heraeus will equally fund the project over three years.
Finally, SBSW, in May 2022, the Group invested €1.6 million into a tranched €5 million convertible bond in EnHywhere. This French start-up has developed a novel hydrogen refueling technology for small footprints to serve all vehicles.
Thus, while SBSW is an excellent long-term PGM miner, it is also imperative to trade 30%-40% short-term LIFO of your long position to take advantage of the volatility and reduced risk. Trading LIFO allows you to keep a core long-term position until the stock reaches your final target while taking advantage of the short-term volatility.
This dual strategy has been the strategy in my marketplace, “The Gold and Oil Corner,” and, I believe, it is the best way to maximize your gain over a long period.
Note: Only investors from the USA can trade LIFO. Read my final note at the end of this article.
3 – Stock Performance
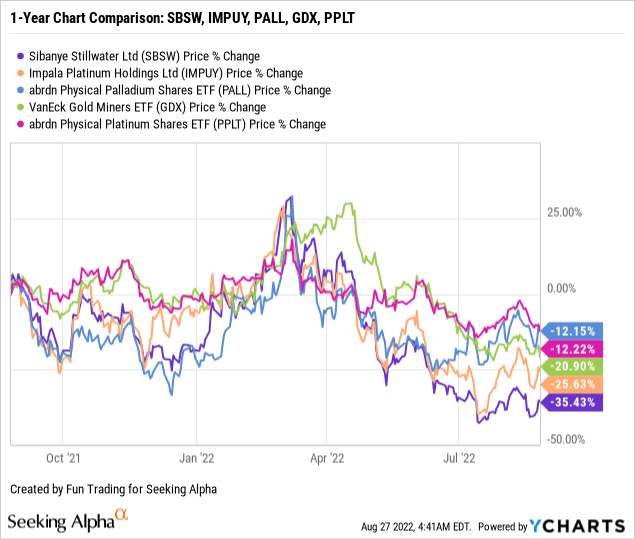
Below is shown the one-year chart comparison between the VanEck Vectors Gold Miners ETF (GDX), the Aberdeen Standard Physical Palladium Shares ETF (PALL), the Aberdeen Standard Phys Platinum Shares ETF (PPLT), Sibanye Stillwater, and Impala Platinum (OTCQX: IMPUY).
We can see that SBSW has underperformed the sector significantly and is now down 35% on a one-year basis. The drop has accelerated since the peak in March. The outperformance is related to the company’s technical problems over the past few months, adding to the gloom.
Sibanye Stillwater ADR – H1 2022 – Balance Sheet History And Trend – The Raw Numbers
Note: The numbers below are indicated in US$ and can vary depending on the ratio ZAR/$US. You should expect some minor fluctuations.
Important: Each Sibanye Stillwater ADS represents four (4) Sibanye Stillwater Ltd. Shares. The Sibanye Stillwater ADRs trade on the New York Stock Exchange under SBSW. According to Investopedia:
American depositary receipts ((ADRs)) allow foreign equities to be traded on U.S. stock exchanges. In fact, this is how the stock of most foreign companies trades in U.S. stock markets. Meanwhile, an American depositary share (ADS) is the actual U.S. dollar-denominated equity share of a foreign-based company available for purchase on an American stock exchange.
| Sibanye Stillwater ADR |
12/2020 |
6/2021 |
12/2021 |
6/2022 |
| $US vs. ZAR | 16.26 | 14.55 | 15.03 | 15.40 |
| Total Revenues in $ Million | 4,439 | 6,182 | 5,461 | 4,570 |
| Basic Net Income attributable to SBSW in $ Million | 1,218 | 1,707 | 577 | 782 |
| Adjusted EBITDA $ million | 2,010 | 2,787 | 1,852 | 1,465 |
| EPS in $/share/ per ADR (4x) | 0.44/1.76 | 0.58/2.32 | 0.76/3.04 | 0.28/1.12 |
| Operating Cash flow in $ Million | 786 | 913 | 1,267 | 285 |
| Capital Expenditure in $ Million | 336 | 256 | 477 | 399 |
| Free Cash Flow in $ Million | 450 | 657 | 790 | -114* |
| Cash and cash equivalent $ Million | 1,378 | 1,829 | 1,900 | 1,673 |
| Borrowings including current in $ Million | 1,251 | 1,204 | 1,273 | 1,282 |
| Net debt in $ million | 0 | 0 | 0 | 0 |
| Dividend per ADR in $/share | 0.68 | 0.63 | 0.49 | 0.325** |
| Shares outstanding (diluted) in Million | 708.3 | 744.7 | 719.22 | 707.73 |
| Production Au Oz | 12/2020 | 6/2021 | 12/2021 | 6/2022 |
| US 2E PGM Production | 305,327 | 298,301 | 272,099 | 230,039 |
| US recycling Oz | 442,698 | 402,872 | 352,276 | 361,333 |
| US AISC 2E/Oz Stillwater | 882 | 973 | 1,039 | 1,366 |
| SA 4E PGM | 895,459 | 894,165 | 941,973 | 823,806 |
| SA AISC 4E/Oz | 1,053 | 1,163 | 1,134 | 1,179 |
| 4E PGM Price in $/Oz | 2,396 | 3,686 | 2,696 | 2,817 |
| Gold Production Au Oz | 578,939 | 518,848 | 554,086 | 191,683 |
| Average gold price $/oz | 1,850 | 1,792 | 1,780 | 1,864 |
| AISC Gold $/oz | 1,347 | 1,691 | 1,685 | 3,115 |
Source: Company release analysis.
Note: More historical data are available to subscribers only.
* Estimated by Fun Trading.
** Interim dividend declared of 138 SA cps (32.46 US cents per ADR) representing an annualized dividend yield of 7%.
Below is the average historical ratio:
SBSW Zar versus $US ratio (Fun Trading)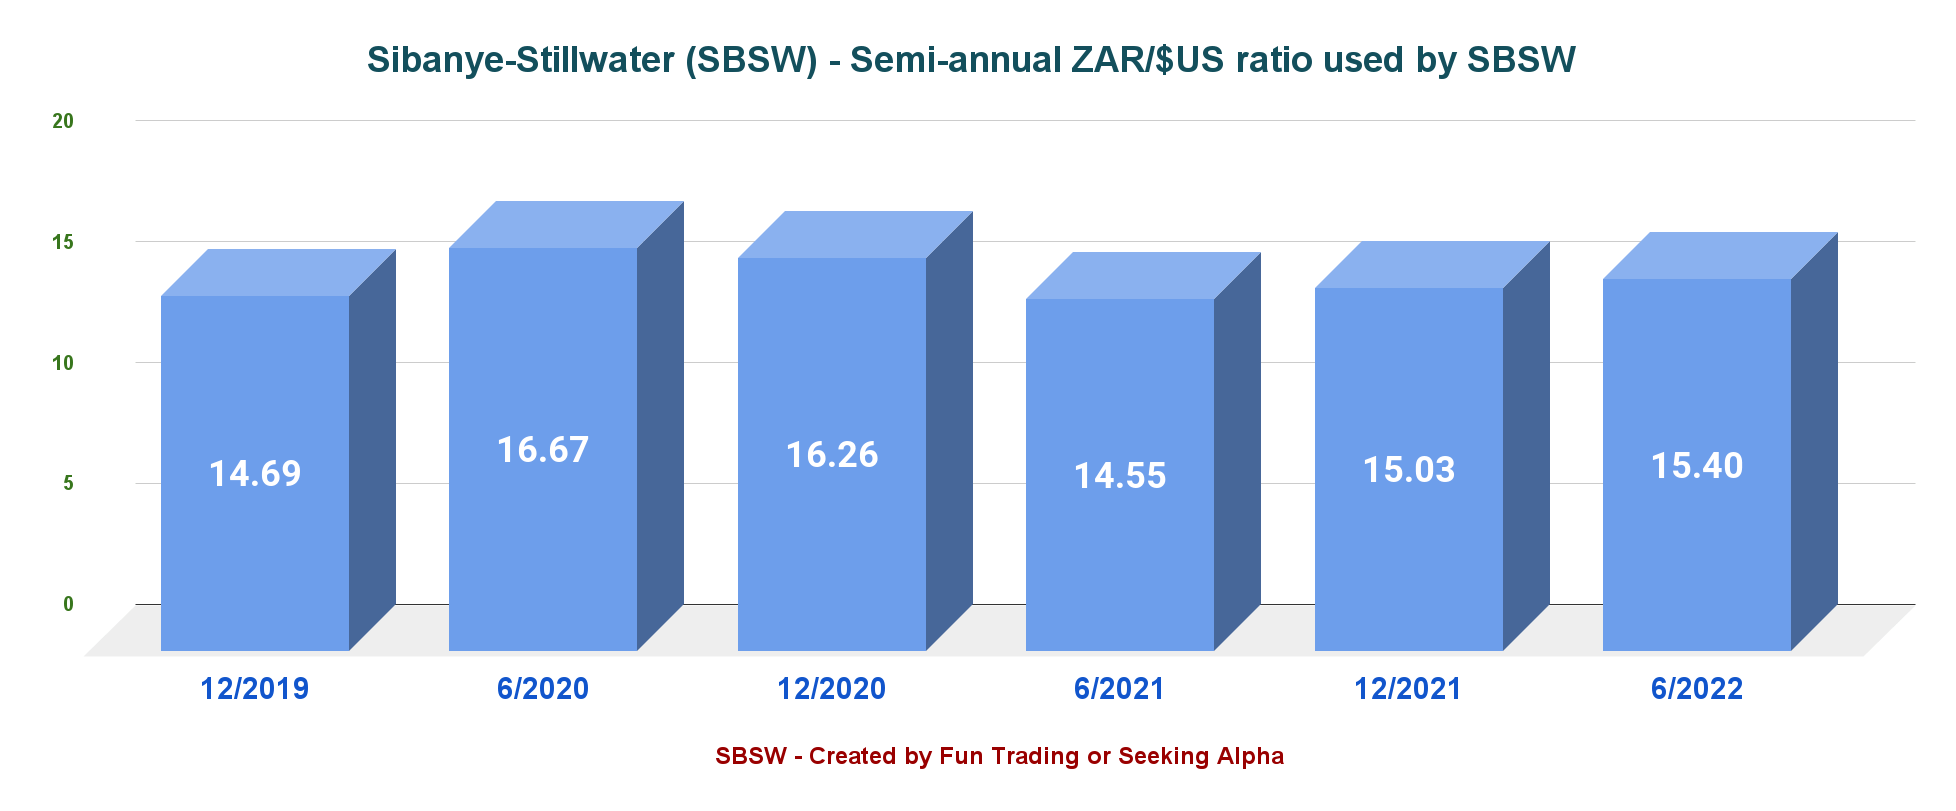
1 – Total Revenues were $4,570 million on June 30, 2022
SBSW Revenue history (Fun Trading)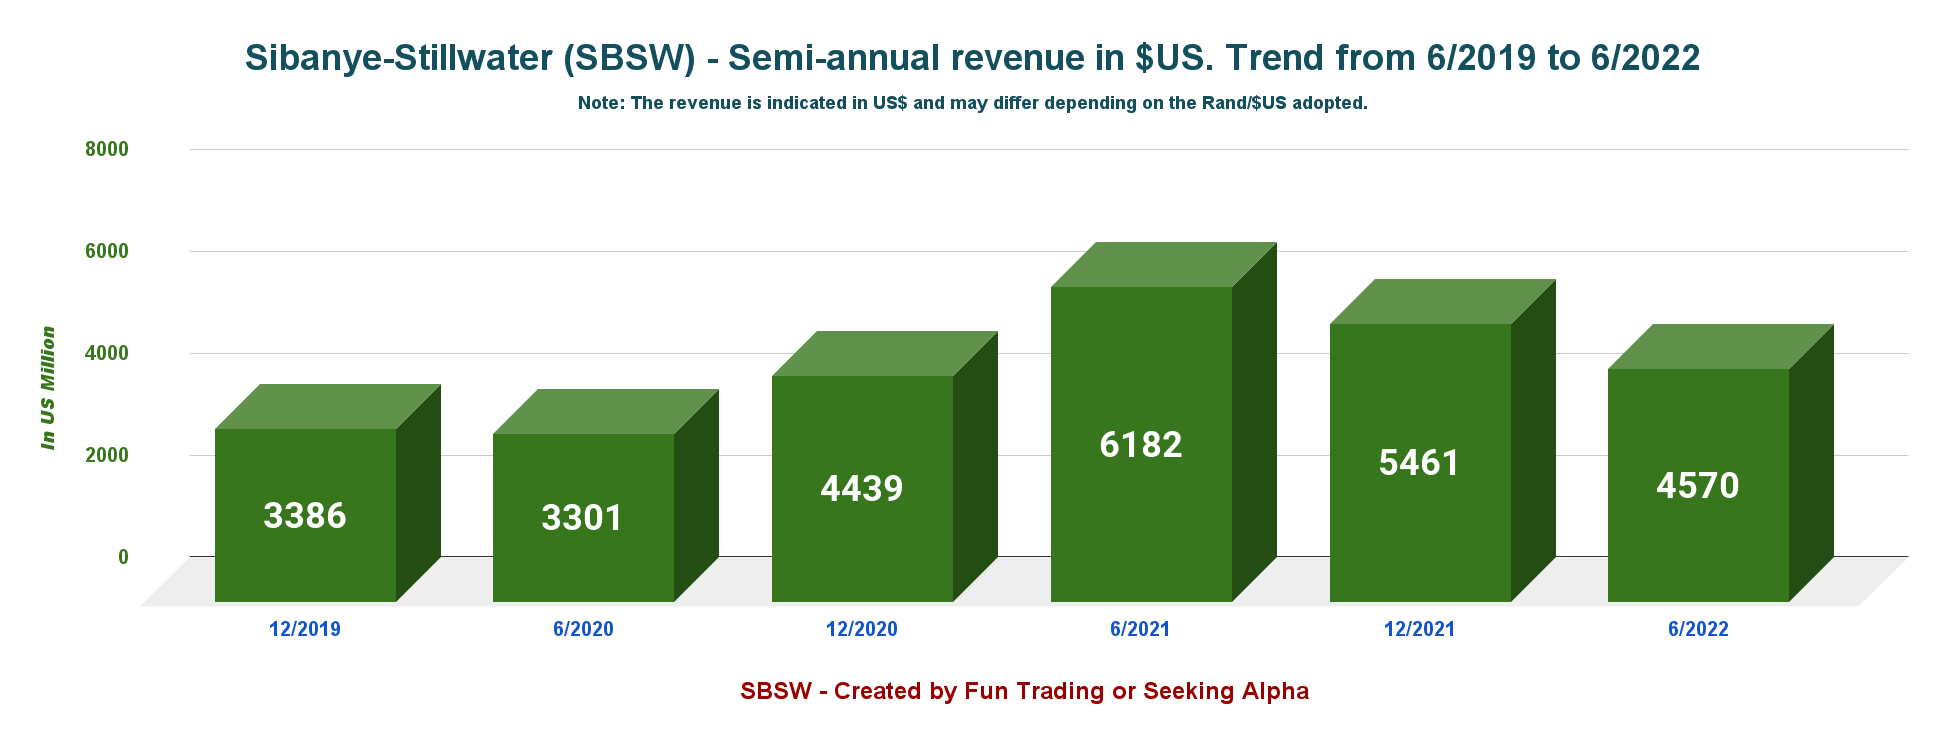
Revenues for the six months ending June 30, 2022, were down to $4,570 million compared to $6,182 million at the end of June 2021.
Also, Sibanye Stillwater’s earnings per ADR share were $1.12 compared to $2.28 per share in H1 2021.
Sibanye Stillwater’s performance for the six months ended 30 June 2022 echoes the deterioration in the global economic and political environment during the first half of 2022 and a challenging period due to significant disruptions experienced at the SA gold and US PGM operations. 4E PGM production from the SA PGM operations was 8% lower than H1 2021 but remained well within guidance.
Rhodium is the most critical metal for Sibanye Stillwater and represents 35.6% of the total revenue, followed by Palladium, with 32.3%. Gold production is well behind. Below is the detailed revenue per metal in H1 2022.
SBSW Revenues detail per metal in 6/2022 (Fun Trading)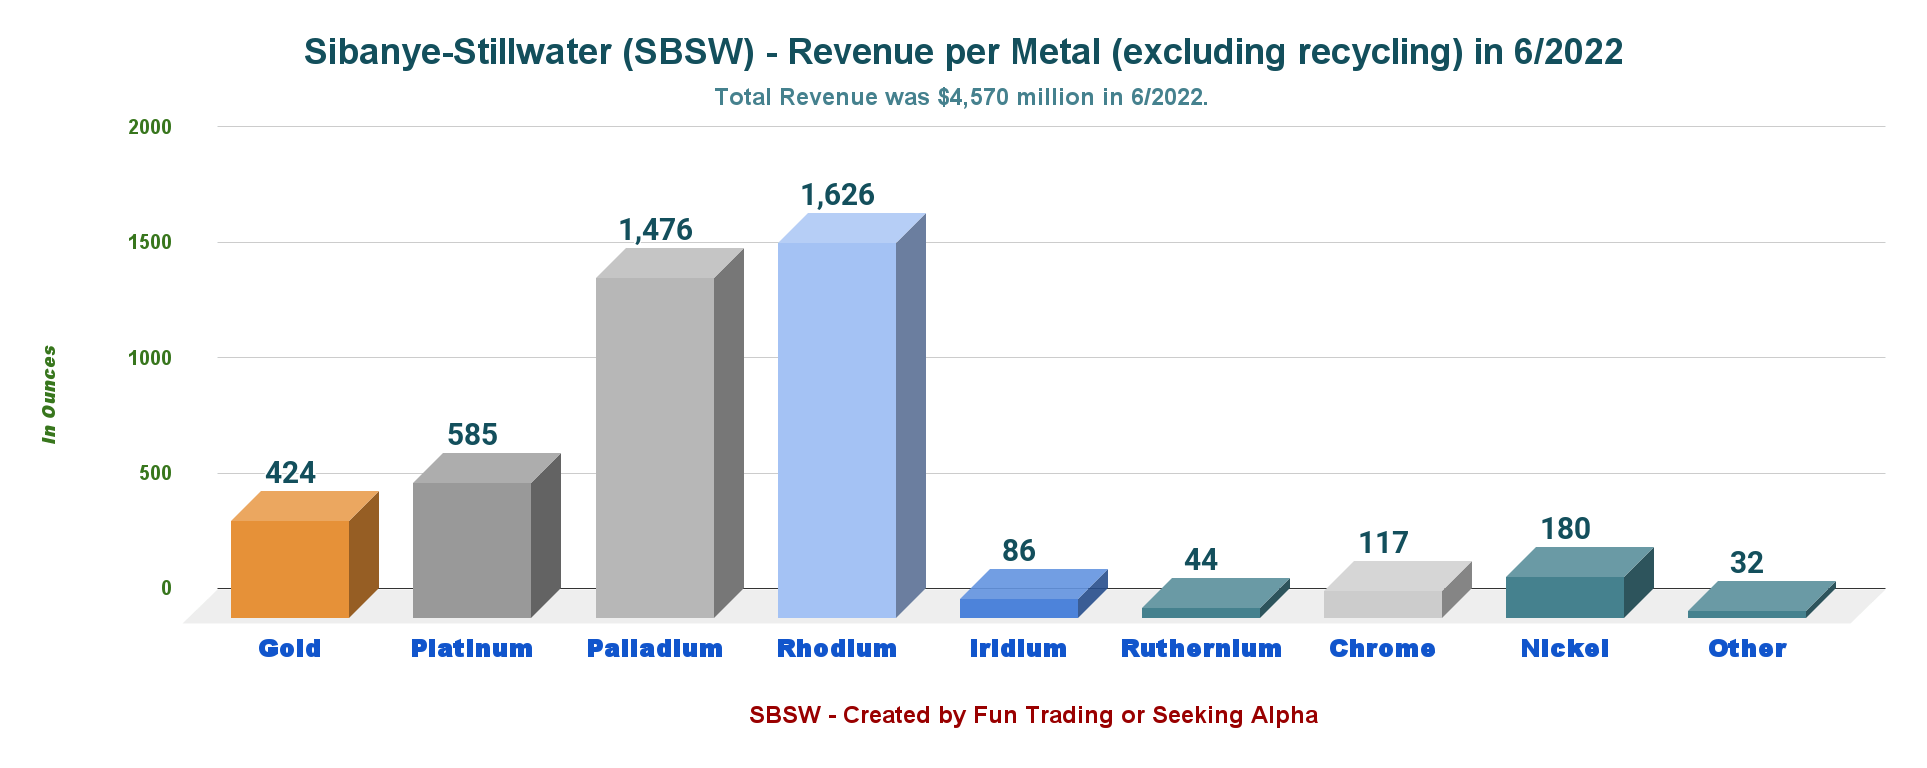
2 – Free Cash Flow is estimated at a $114 million loss on June 30, 2022.
SBSW Free cash flow history (Fun Trading)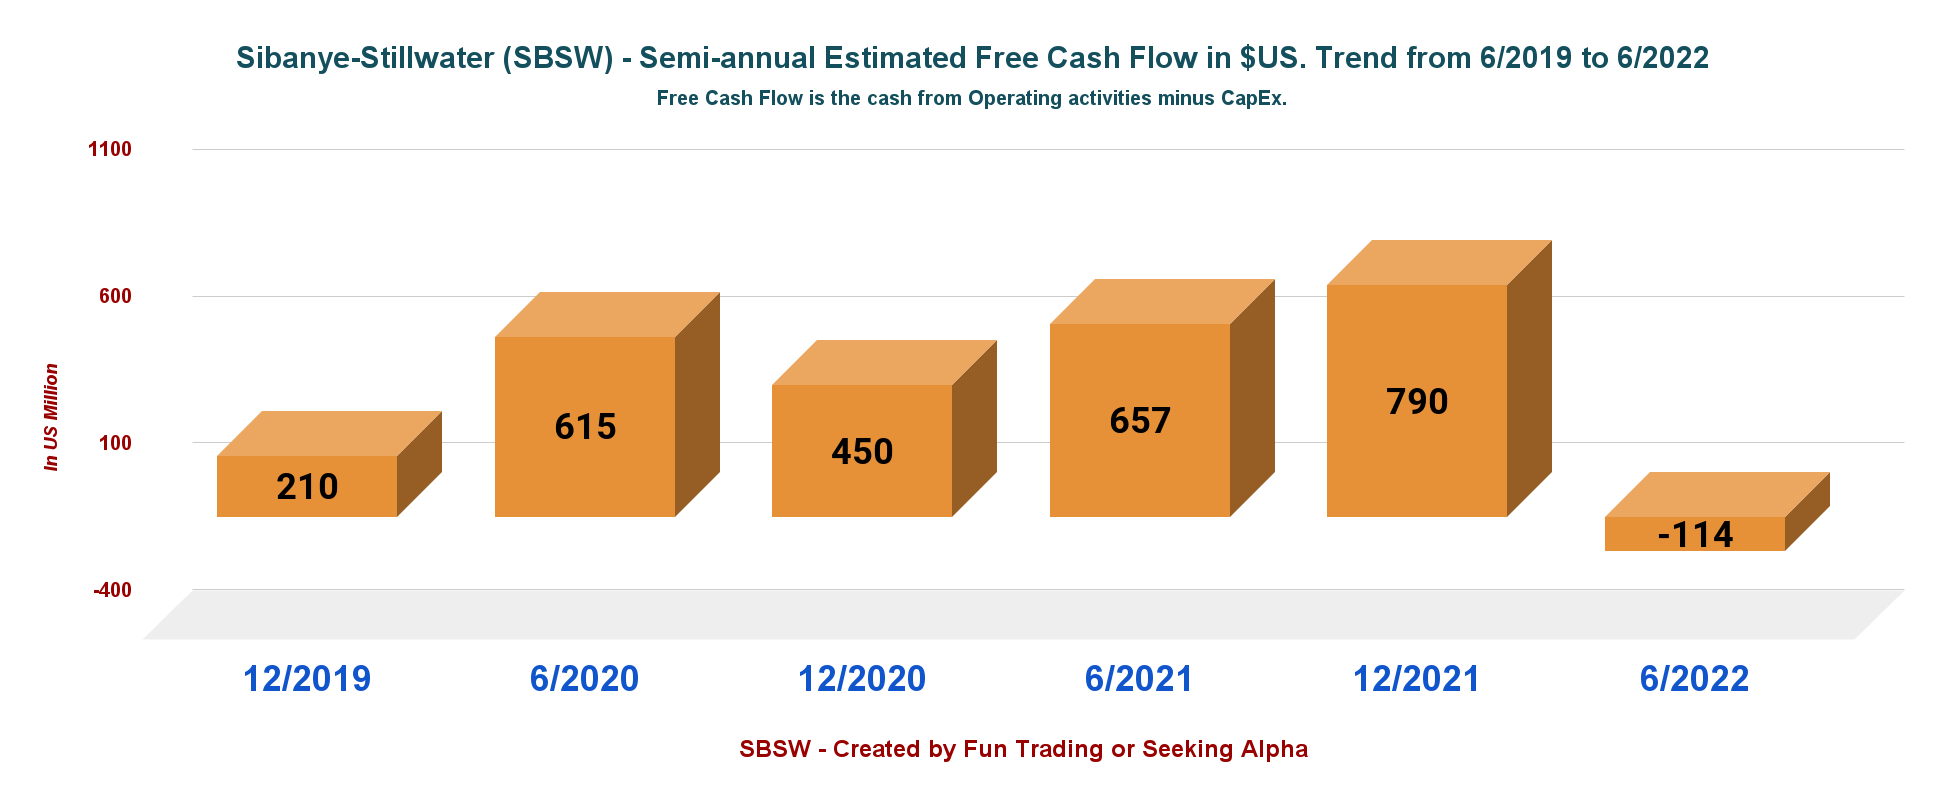
Note: Generic free cash flow is cash from operations minus CapEx.
The 12-month free cash flow is now $676 million, with free cash flow in H1 2022 of $114 million loss.
The dividend for H1 2022 has been set to $0.32 per share, which is a yield of about 9.6% net. South Africa deducts 25% at the source.
Sibanye did not buy back shares this semester.
3 – Gross Debt was $1,282 Million at the end of June 2022
SBSW Cash versus Debt history (Fun Trading )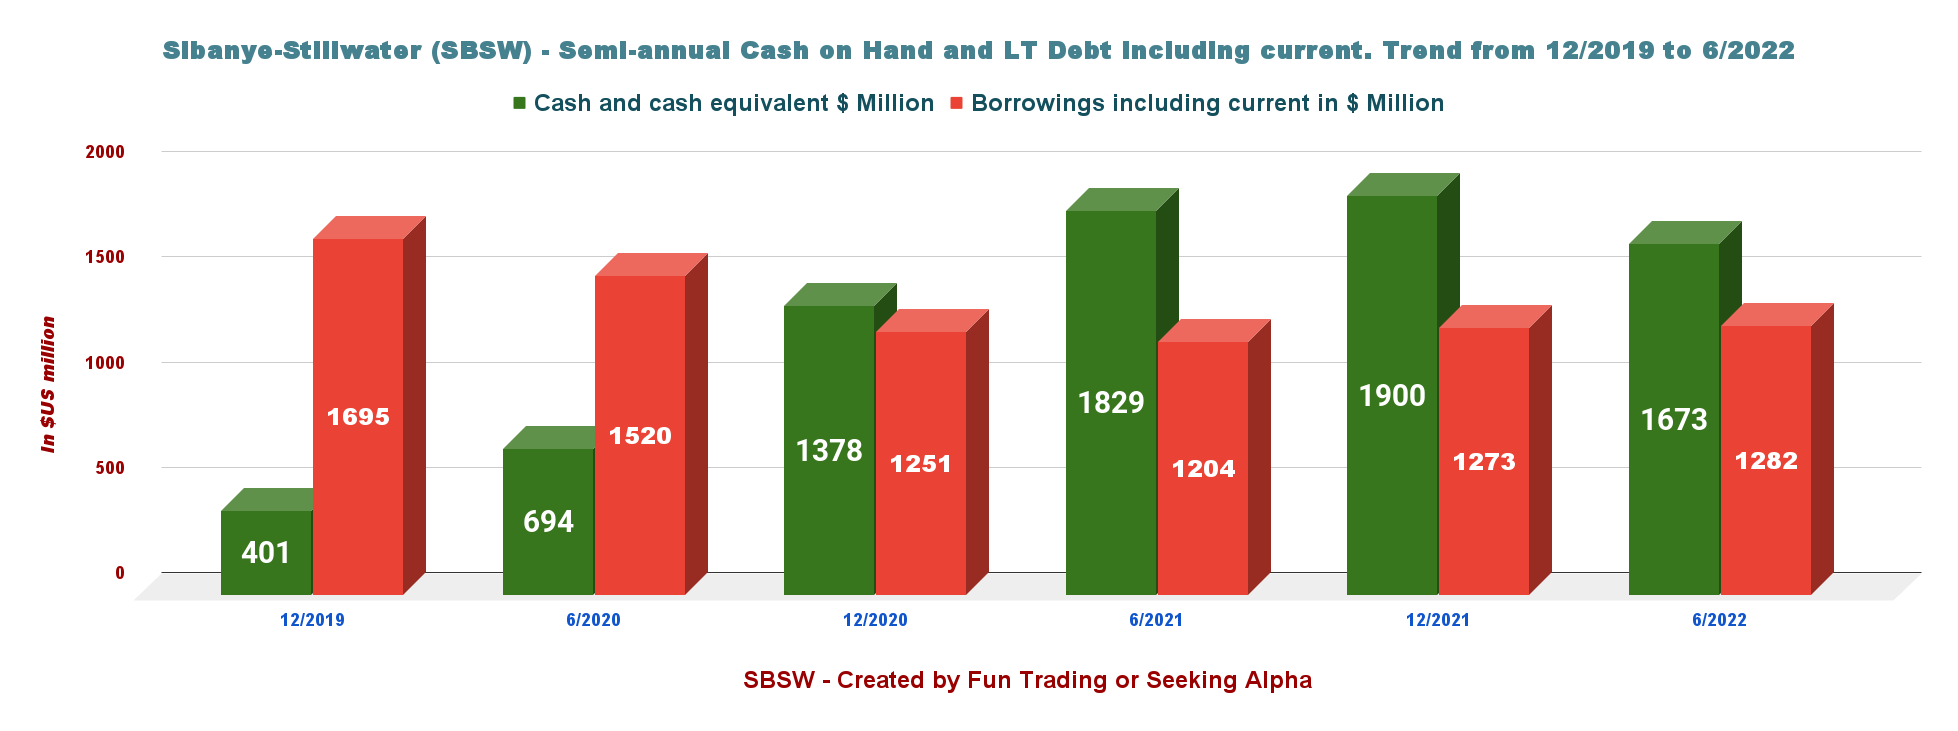
The Cash and Cash equivalents are now $1,673 million, and LT debt, including current (excluding non-recourse debt), is $1,282 million.
The company has an excellent debt profile.
4 – H1 2022 Production Analysis
Sibanye Stillwater is producing Gold and PGM in South Africa and the USA from Stillwater. I have tried to simplify it by showing charts.
Note: The company operates the US East Boulder and Stillwater mines, which produce platinum and Palladium. Also, the company is recycling platinum/palladium/rhodium.
4.1 – US PGM Production 2E PGM Oz And Recycling 3E PGM Oz (“USA”)
The chart indicates the quarterly production and six months of production as well.
SBSW US Production history (Chart)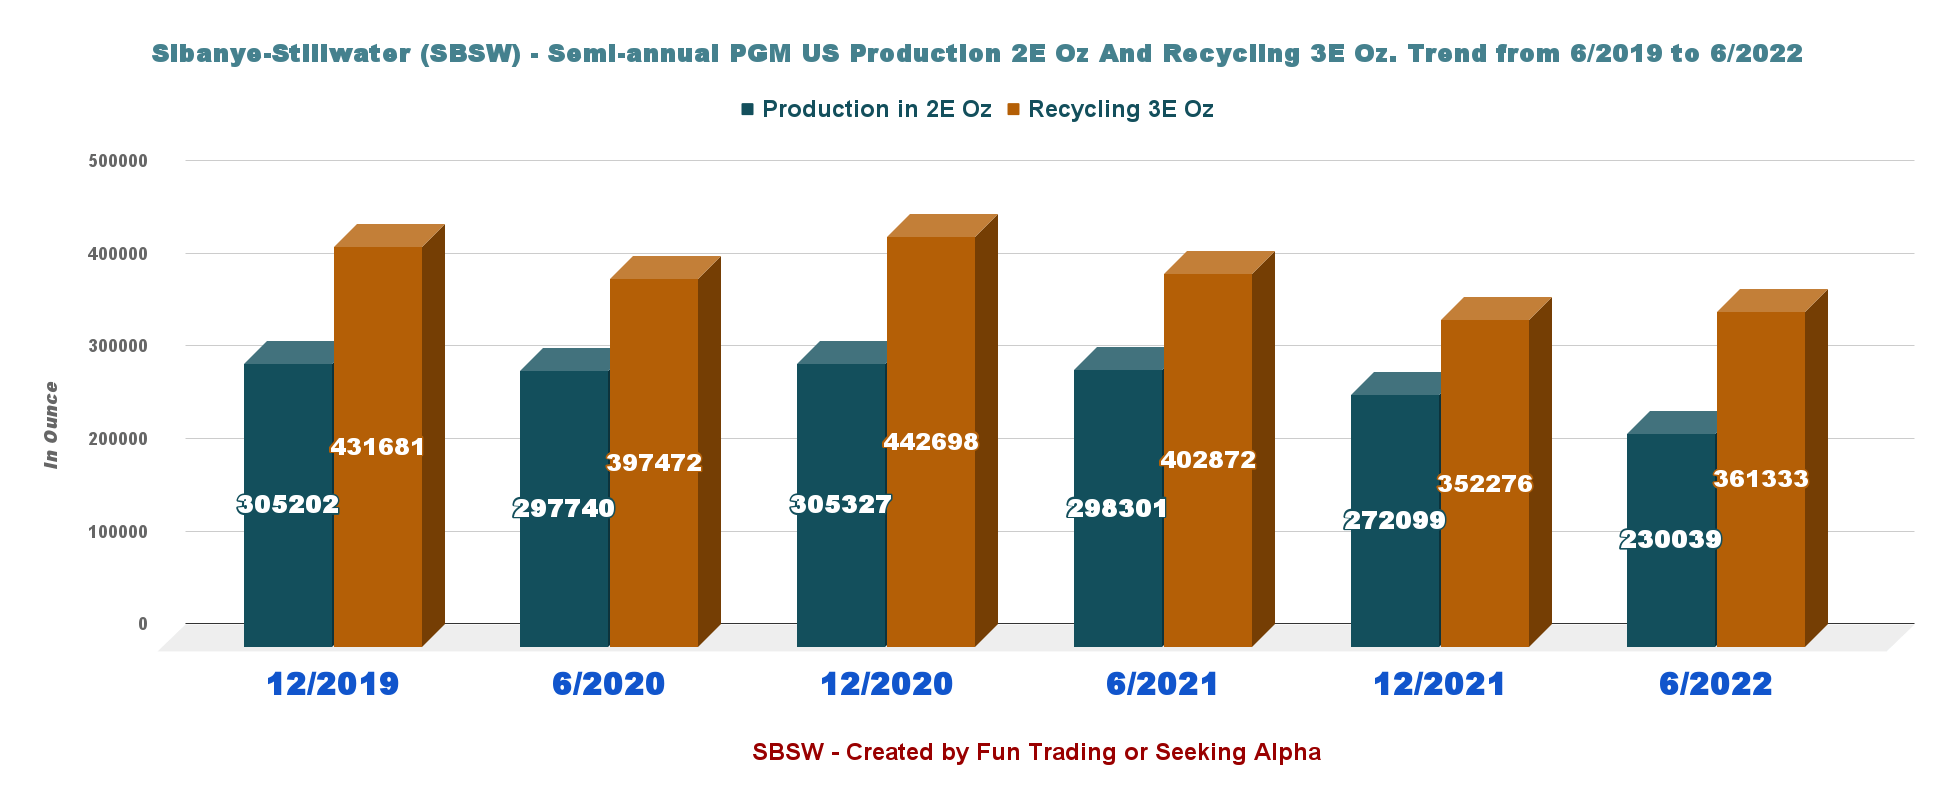
US Production 2E/PM was 230,039 2E Oz, down from 298,301 2E Oz last year, and Recycling delivered 361,333 3E Oz, down from 402,872 6/2021.
Total production in the US was 591,372 3E Oz, down from 701,173 3E Oz in 6/2021.
4.2 – South African PGM Production: 4E PGM Oz And Gold Production
SBSW Production SA history (Fin Trading)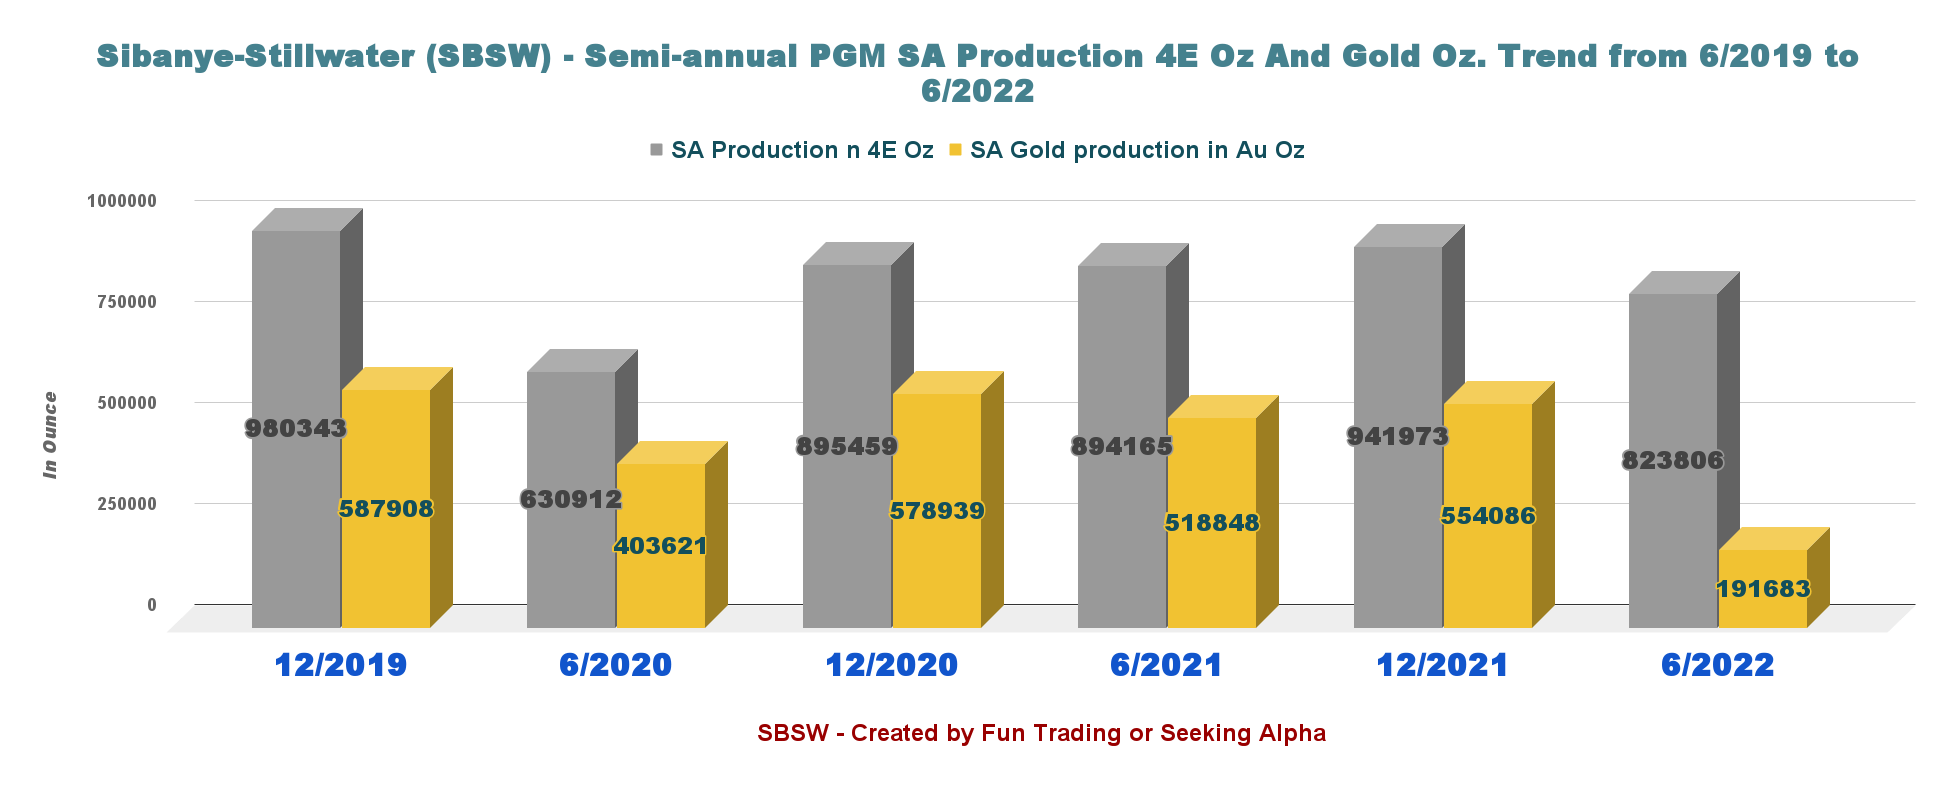
The Gold production was 191,683 Au Oz, down significantly from 518,848 Au Oz in 6/2021 (including Marikana operations), with an average price of $1,864 per Au Oz from $1,792 in 2021. Production for H1 2022 was 63% lower year-on-year due to over 3 months of industrial action.
The 4E PGM production was 823,806 4E Oz, up from 894,165 4E Oz in 6/2021.
Also, the company indicated $2,817 per Oz for the 4E PGM Price basket, down significantly from $3,686 per 4E PGM in June 2021.
There are three different AISCs for Sibanye Stillwater. AISC for gold reached a record high due to the low production this semester.
|
AISC type |
6/2021 |
6/2022 |
| AISC 2E PGM | 973 | 1,366 |
| AISC 4E PGM | 1,163 | 1,179 |
| AISC Gold | 1,691 | 3,115 |
5 – Production Guidance 2022
SBSW Guidance 2022 (Sibanye Stillwater Presentation)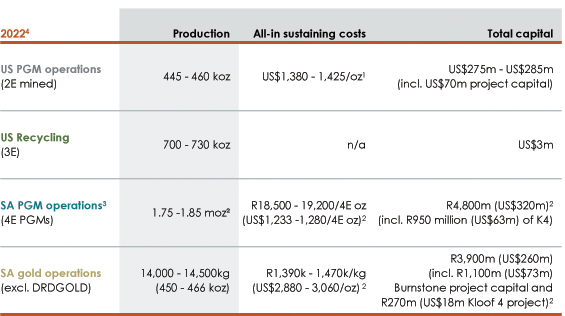
Technical Analysis And Commentary
SBSW TA Chart short-term (Fun Trading)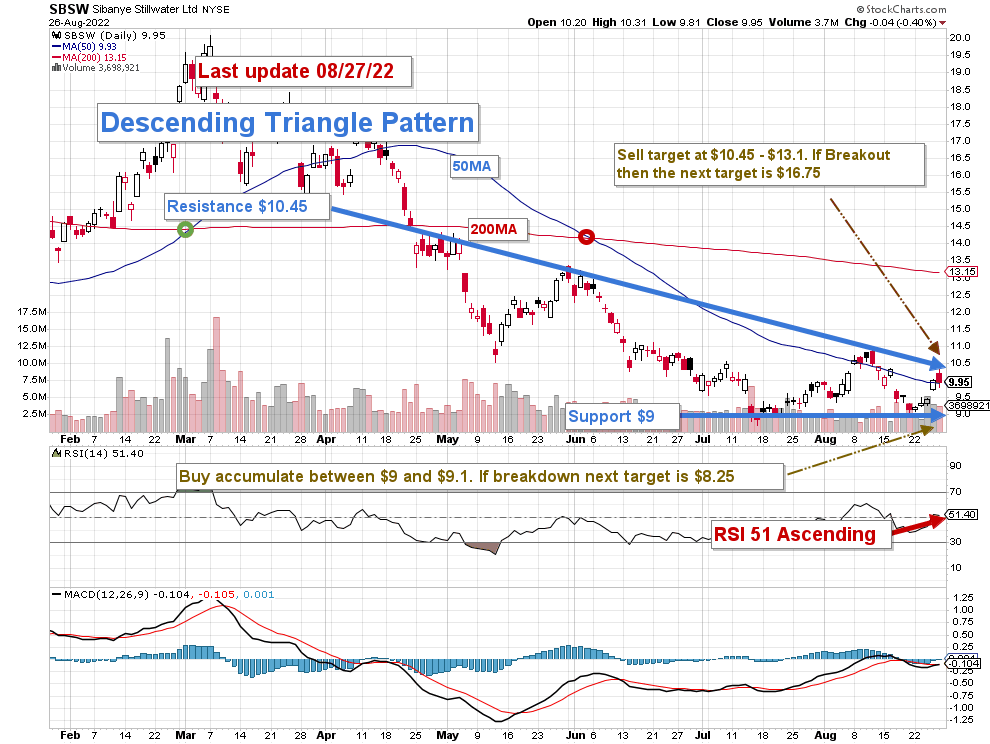
Note: The chart is adjusted from the dividend.
SBSW forms a descending triangle pattern with resistance at $10.45 and support at $9. Unfortunately, descending triangle patterns, in this case, are considered short-term bearish because the graph entered the pattern from the resistance side. However, they often form within longer-term uptrends as continuation patterns. Patience is required.
I suggest trading LIFO and taking profits between $10.45 and $13.1 (about 30%) and accumulating between $9 and $9.1 with potential lower support at $8.25.
Thus, accumulating SBSW now on any weakness is a good idea, in my opinion. For those who want to start a long-term position, I suggest buying and accumulating below $9.95 (50MA).
Note: The LIFO method is prohibited under International Financial Reporting Standards (IFRS), though it is permitted in the United States by Generally Accepted Accounting Principles (GAAP). Therefore, only US traders can apply this method. Those who cannot trade LIFO can use an alternative by setting two different accounts for the same stock, one for the long term and one for short-term trading.
Warning: The TA chart must be updated frequently to be relevant. It is what I am doing in my stock tracker. The chart above has a possible validity of about a week. Remember, the TA chart is a tool only to help you adopt the right strategy. It is not a way to foresee the future. No one and nothing can.
Author’s note: If you find value in this article and would like to encourage such continued efforts, please click the “Like” button below as a vote of support. Thanks.
Be the first to comment