

Zephyr18/iStock via Getty Images
“Copernicus’s model suffered from a small blemish, a lack of proof. In fact, the vast majority of available empirical evidence supported a geocentric system.” “His model was in fact more cluttered and less elegant than the prevailing geocentric model…” – Thony Christie
In January, I wrote at the conclusion of a six-part series entitled “ The Death of Irrational Exuberance”:
This series argues rather that it is likely that this process, whatever its underlying mechanism, has run ahead of itself and is ‘due’ for a severe, multi-decade correction—a ‘hard reversion’—and that the next 20 years are the likeliest time for that to occur. We have been living in Bizarro world for the last three decades, a period of ‘irrational exuberance’. History suggests that this period is drawing to a close.
It is now June, and the S&P 500 (NYSEARCA:SPY) is in an ‘official’ bear market, but stocks continue to be priced for growth that is unlikely to come. This conclusion is based on a series of historical patterns that I have outlined on Seeking Alpha over the last eight months, including the series just mentioned. Although it is possible that we will see markets rally over the next week or month or quarter, the underlying bearish dynamics will likely remain intact, and we will likely see lower levels over much of the remainder of the decade.
Elements of this overall thesis have been presented in previous articles focused on particular sectors, industries, and themes, but the general themes at work have been primarily outlined in three pieces/series which I will briefly revisit below.
A Warning To New Readers
But I first want to warn new readers about the methods employed here.
I have been attempting to create reliable techniques for anticipating both long-term developments and extreme outcomes, especially techniques that interlock with one another and that potentially point to new insights in market analysis, economics, and even social dynamics. Because standard analytical rhetoric has not been well suited to these pursuits, the average intelligent reader is unlikely to find answers to the questions that they think they should be obsessed with: What is the Fed going to do next? How will markets react to whatever path the Fed ends up taking? And then how will the economy react to that? And then how will the Fed react to that reaction? When will CPI inflation peak? Is the US economy in “recession”? Is this “stagflation”? What is the next turn in the Russia-Ukraine War? From an actionable market analysis perspective, in my opinion, most of these issues are of marginal importance and difficult to predict to the degree to which readers are interested. Will inflation peak in August at 8.9% or September at 8.8%? Will the next print be 8.6% or 8.7%? What is the terminal Fed funds rate going to be, 3.5% or 3.75% or 4%? What is the chance of recession? These questions are largely distractions. The most interesting thing about them as focal points for changes in expectations.
If you knew 75% of the answers to questions about terminal rates, peak inflation, GDP prints, where the next geopolitical crisis is going to pop up, and who is going to win the midterms in the US, you would still be none the wiser about where markets will be on any particular date. This is what I like to think of as “champagne tower analysis”. Painstakingly built, perhaps, but unsuited for the rough and tumble of markets, and extremely vulnerable to any flaws or disturbances in the bottom of the tower. But the towers look pretty, and people pay good money for them. There are some, I believe, who can do this skillfully, but they are few and far between (Mohamed El-Erian is one who comes to mind), and because it is more art than science, it is difficult to replicate or generalize. I am fairly stupid, so I am more interested in accumulating as many rules of thumb as I can and then trying to make sure they are interoperable, and I am also interested in robustness across different historical epochs. If a rule is stupid and blunt but appears to have worked over 150 years and different monetary regimes, I am more likely to act on that then a well-crafted and impeccably tasteful bottom-up rationalization. I am not inclined to stop there, however. I want to know why such a rule has worked and under what conditions it might not work. But in most situations, I am unable to truly get to the underlying causal mechanisms. In fact, I would like to propose what is the overarching paradox of market analysis:
The stronger a market pattern is, the less likely there is a coherent explanation for it.
And a corollary:
The more coherent the explanation for a market phenomenon, the less likely that phenomenon matters or even exists.
Take, for example, the laws of supply and demand. Presumably, all you have to do to make money in commodity markets is to correctly anticipate the balance of supply and demand across time. Yet, I have difficulty finding any studies that can establish a clear connection between supply, demand, and price even retrospectively. Look in your Econ 101 textbooks, and you are likely to find theoretical models of this relationship, not historical demonstrations. (If anybody has a historical demonstration of this, please link to it in the comment section). In my old copy of a Samuelson textbook, we never get beyond abstractions of this basic law of price.
Chart A. The law of supply and demand explains everything and nothing. (Samuelson and Nordaus, Economics)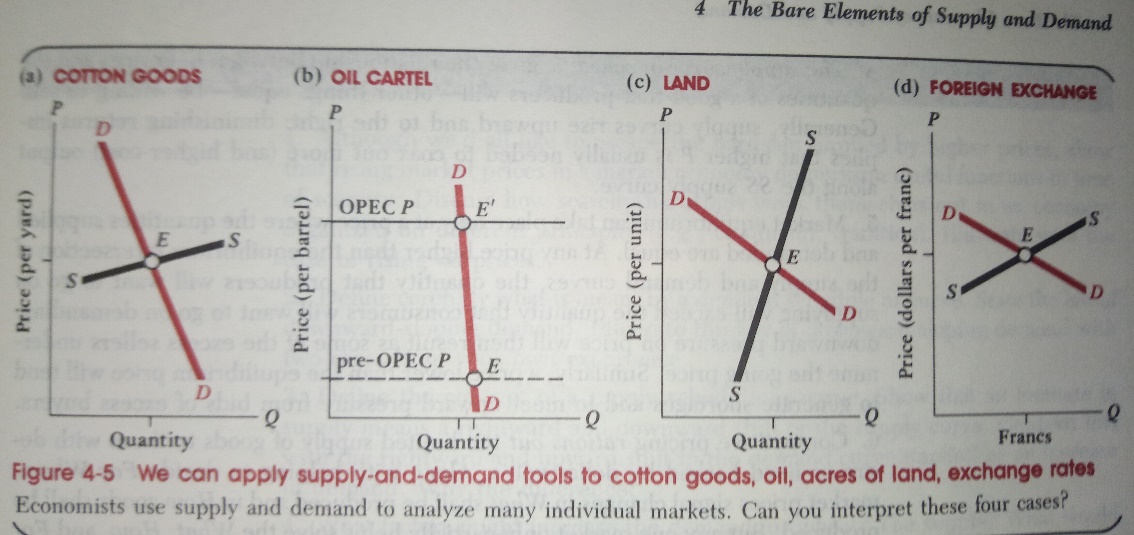
In the caption, Samuelson assures us that “Economists use supply and demand to analyze many individual markets.” For example, “We can apply supply-and-demand tools to cotton goods, oil, acres of land, [and] exchange rates”. The chapter is titled (emphasis mine) “The Bare Elements of Supply and Demand”, a modest nod to the near-uselessness of the theory, I believe.
Let me be clear. I think supply and demand do determine price to some degree. For example, I have written about how stable the relationship between relative price and relative production has been in commodities in Water And Diamonds, Iron And Gold: The Problem With Commodity Prices. But I cannot find data that shows a relationship with absolute real or nominal prices. Instead, curiously, I found that the real price of gold seemed to move with the level of production in cheap commodities. I also found that the greater the degree to which a given commodity was correlated with an index of commodities, the greater the likelihood that that commodity was correlated with the earnings yield on stocks. It is almost as if one could have predicted long-term changes in commodity prices, if one could have predicted the future PE ratio for stocks (the inverse of the earnings yield), or vice versa. And, this is indeed what I have tried to do.
Chart B. The greater the correlation a commodity has with other commodities, the more it is correlated with the earnings yield on stocks. (Shiller; Stephan Pfaffenzeller’s GYCPI data)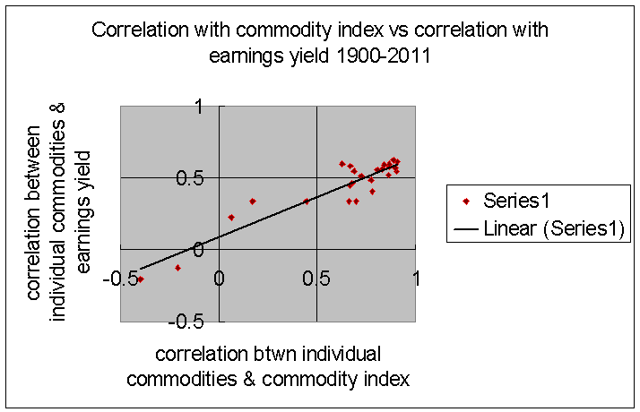
In other words, I have tried to find relationships that actually work rather than those that are likely to be found in the textbooks, since textbooks are catechisms more interested in what you believe than how you think. Ultimately, I am not interested in tricking my way into investor heaven, however. I am interested in primarily economic relationships that suggest the possibility of a fundamental mechanism, and I am not going to ignore a relationship simply because the textbooks (and the academics who write them) do yet not make any allowance for it.
The risk here is not that you and I are going to lose money in the process (let’s take that as a given for now). The risk is how you are going to feel about it. If, for example, you told yourself and others that you were going to make a long-term investment in nickel because of increased demand from battery production or because you expected supply constraints after an election of a communist in some poor, benighted nickel producer, you are going to sound pretty smart. With every layer of detail you add, you are going to sound that much smarter. “The Juan Valdez faction of the FLNP has been less radical than the Stalinist-Trotskyite faction, but in recent weeks, they have made overtures to anti-mining activists in the Urubura region”. Mmm, smart! Even if you do lose on your investment, nobody can blame you. As nickel prices fall, and the experts come out and explain that that is because of some cheaper, nickel-free way of producing batteries invented by some obscure lab, you can rest comfortable in the theoretical soundness of your loss.
On the other hand, if you bought commodities because FANG PE ratios were so high—wait, what? Even if your bet paid off, you are more likely to feel as if you won a game of Russian roulette. You would feel better if you had tossed a coin, because even that logic is more congruous with our perception of reality. The future is ultimately unknowable. You know what your chances are in coin toss. If you bet on commodities because FANG PE ratios were high and then that bet did not pay off, you would be inconsolable.
The following analyses are built on the unlikely propositions that markets are constantly emitting signals about both long- and short-term developments, that those signals are tied to fundamental developments across a variety of social phenomena (which we will briefly mention below), and that those signals are virtually unknown by people smarter than you and me who would have presumably greater social and economic interests in discovering such relationships. Again, this is all very unlikely.
If you have still read this far, let me be even clearer about how unlikely this enterprise is by presenting the following chart. I first presented this in January, and it shows what I called a “hard reversion scenario” for the 2020s in which markets (in this case, the price and earnings per share for the S&P 500) were to revert to long-term historical means. To put this another way, something like such a scenario ought to occur if the long-term equilibria I have tried to identify should unabashedly reassert themselves. For reasons I will rehash below, I have been arguing that now (that is, this cycle of this secular bull market) has been the likeliest period for such a reversion to begin.
Chart C. Historical patterns during this stage of a technological/geopolitical/market supercycle suggest this outcome. (Author)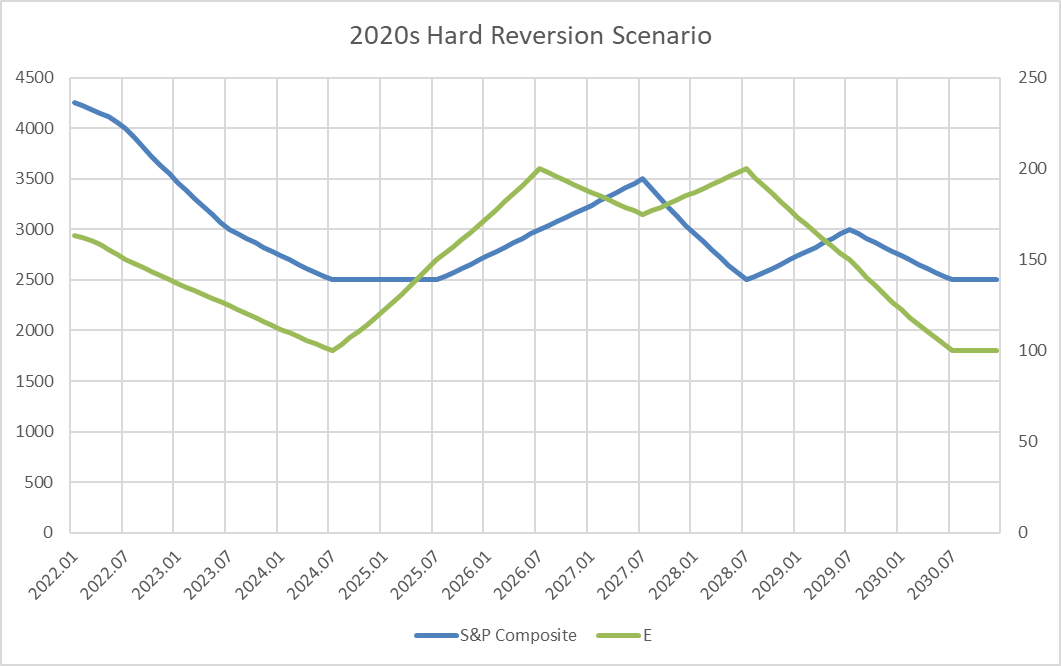
To put this another way, my argument is that this is what history suggests ought to happen if historical patterns persist and that I do not see compelling evidence of a move away from these patterns. I would not describe myself as especially confident about this outlook. The future is unknowable. But, this scenario has a higher probability than any other outlook I can find, because most long-term outlooks are variations on straight-line extrapolations from historical returns. Every bear market is a bull market in disguise by this logic, because the “mean” is growth.
In contrast, I am betting that markets do not always go up over the long term and that I can guess when, because market participants do not know how markets work and there is a vested interest in not knowing. That is somewhat unfair. It is not that we, collectively, do not want to know but rather that we are not interested in foregoing either the collective sense of control that we are accustomed to feeling or the faith in absolute, straight-line progress.
Technology, War, And Markets
Most recently, in “Conjunction and Disruption: Technology, War, and Asset Prices”, I showed how stock prices have nonlinear relationships with innovation supercycles, global political stability, commodity prices, and earnings going as far back as we have reliable data (that is, 1871). PE ratios have historically been strongly negatively correlated with the emergence of disruptive innovations, commodity prices, and political instability; PEs tend to rise during the mass diffusion phase of disruptive innovations (rather than the high-growth phase), falling commodities, and rising political stability.
But, stock prices are more than just a function of PE ratios. If earnings collapse but PEs remain constant, stock prices must collapse in perfect sympathy with earnings. This was what happened in the 1930s and in 2008-2009.
In the last century, we only have a single instance in which stock prices largely rose in “secular” sympathy with rising commodities, falling PE ratios, rising global political instability, and a new innovation supercycle: the reflationary boom of the late 1930s and 1940s. We are certainly not on the brink of reflation today.
Confining ourselves to markets, we can restate some of this with reference to the relationship between the earnings yield (E/P) and real commodity prices (C/CPI). This phenomenon is “why” stocks do not do well during periods of high inflation, even if earnings are strong. The correlation between a broad, equal-weighted index of World Bank commodity prices and the earnings yield of the S&P 500 from 1960-2022 is 0.77. For reasons I argued in a series a decade ago, this relationship has been consistent for multiple centuries. Despite its remaining robustness, it stopped being fashionable to mention it in the last 50 years. I presume that we live in an age where if something cannot be explained, then it cannot exist. Call it “Peak Technocracy”.
Chart D. Real commodities have always been highly correlated with equity yields. (Pfaffenzeller, Shiller, St Louis Fed, Warren & Pearson)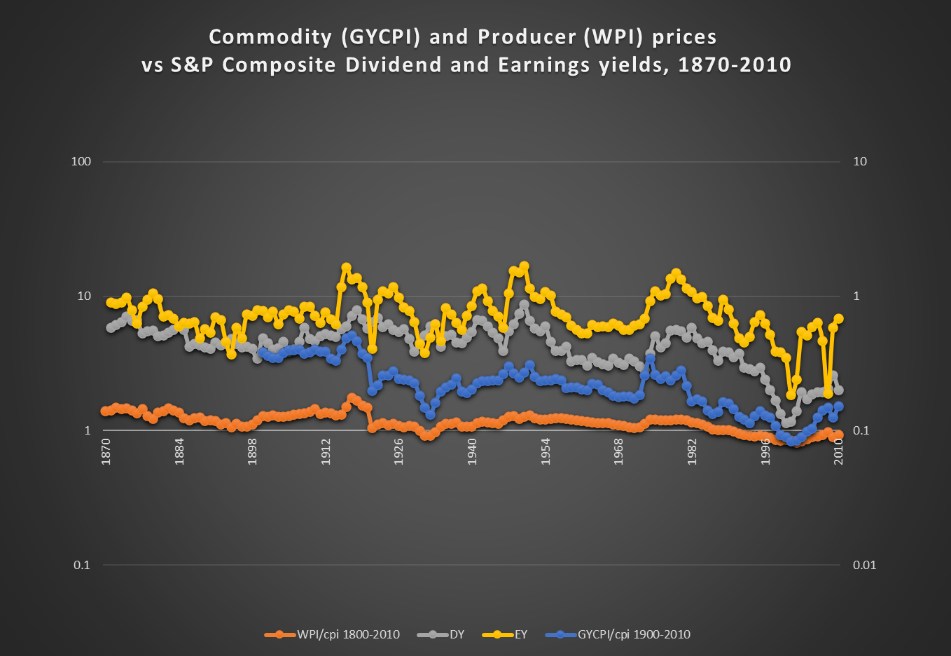
Implicitly, the correlation between the real price of stocks (P/CPI) ought to approximate the ratio of earnings to commodity prices (E/C), and as the following chart shows, that has indeed been the case.
Chart E. The reaction of stock prices to earnings appears to be affected by commodity prices. (Shiller, World Bank)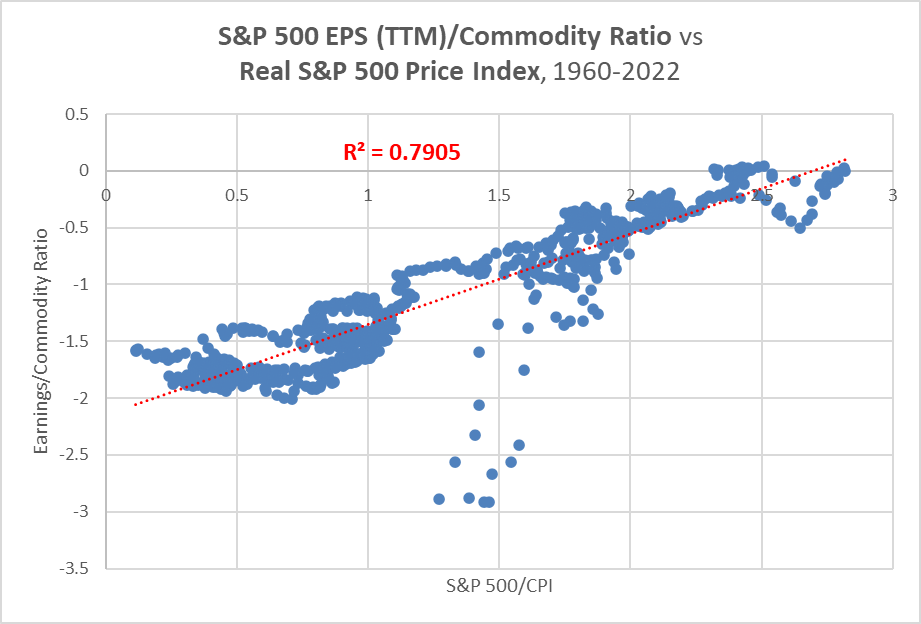
Why would stocks “care” if commodity prices are high so long as profits remain high? Some things we have to take on faith (for example, that stock prices are functions of the market’s pure anticipation of future cash flows), and other things we have to take as stylized fact. In economics, there are very few consistent relationships. That this one has existed, it seems, for as far back as we have data, suggests that it is unlikely to be coincidental, despite our inability to explain it.
We will come back to these relationships in a moment.
Sector Rotations
Last November, I wrote “A Primer on Long-Term Sector Rotations”. In that article, I showed that, by and large, over the long term (say, five to ten years), all stock market sectors move together. (In other words, there may actually be a “stock market”, not just a “market of stocks”). However, when the relative long-term performances become too imbalanced, there is typically a long-term inversion in the sectoral hierarchy.
Chart F. High degrees of sectoral dispersion are typically followed by inversions of sectoral hierarchies. (Fama-French data)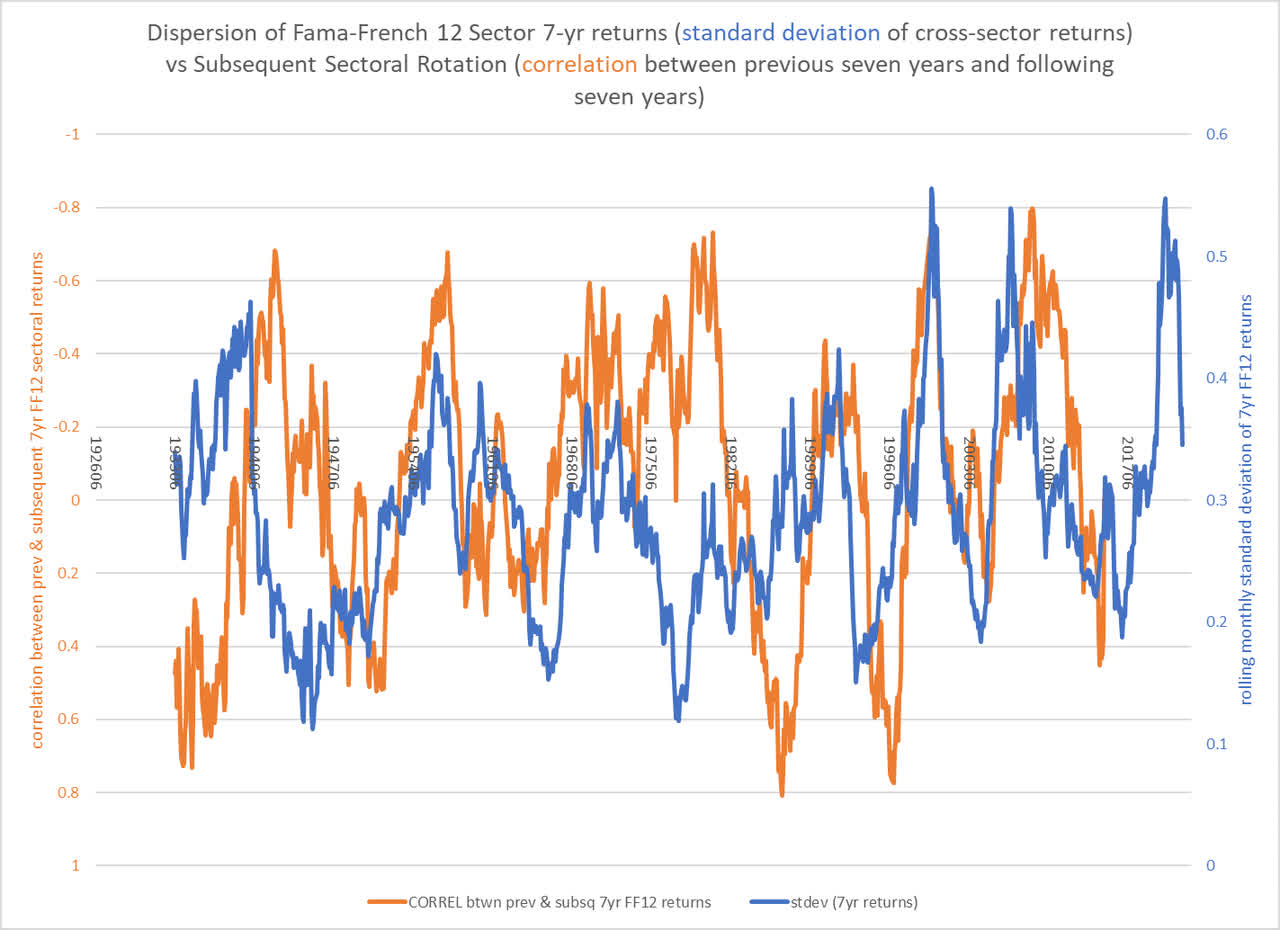
This is especially true when either the technology (XLK) or energy (XLE) sectors are in charge. The last three decades have illustrated this quite nicely. The 1990s were a period of tech boom/energy bust. This was followed by an energy boom/tech bust in the 2000s, and this, in turn, was followed by a tech boom/energy bust up until about a year ago. As I argued in “A Primer”, and as early as February and March of last year, energy and tech were likely to switch places again in the 2020s. Historically, markets have not been so kind as to always provide a decadal rotation between energy and tech, but in the last three decades, they have.
If sectoral imbalances are the dry brush waiting to be lit, oil shocks appear to be the spark that starts the fire. Energy shocks and sector rotations have occurred at nearly every sectoral transition going back over a century. It does not matter which sector is in charge or whether oil prices are coming out of a bullish supercycle or reviving from a secular downturn or even just transitioning from secular collapse to secular stability. Major energy transitions have coincided with major sectoral transitions. Think, for example, of the 1999-2000 oil spike, the 2008 oil spike, or the current one.
Chart G. Long-term sectoral rotations often begin with oil shocks. (Fama-French; St Louis Fed)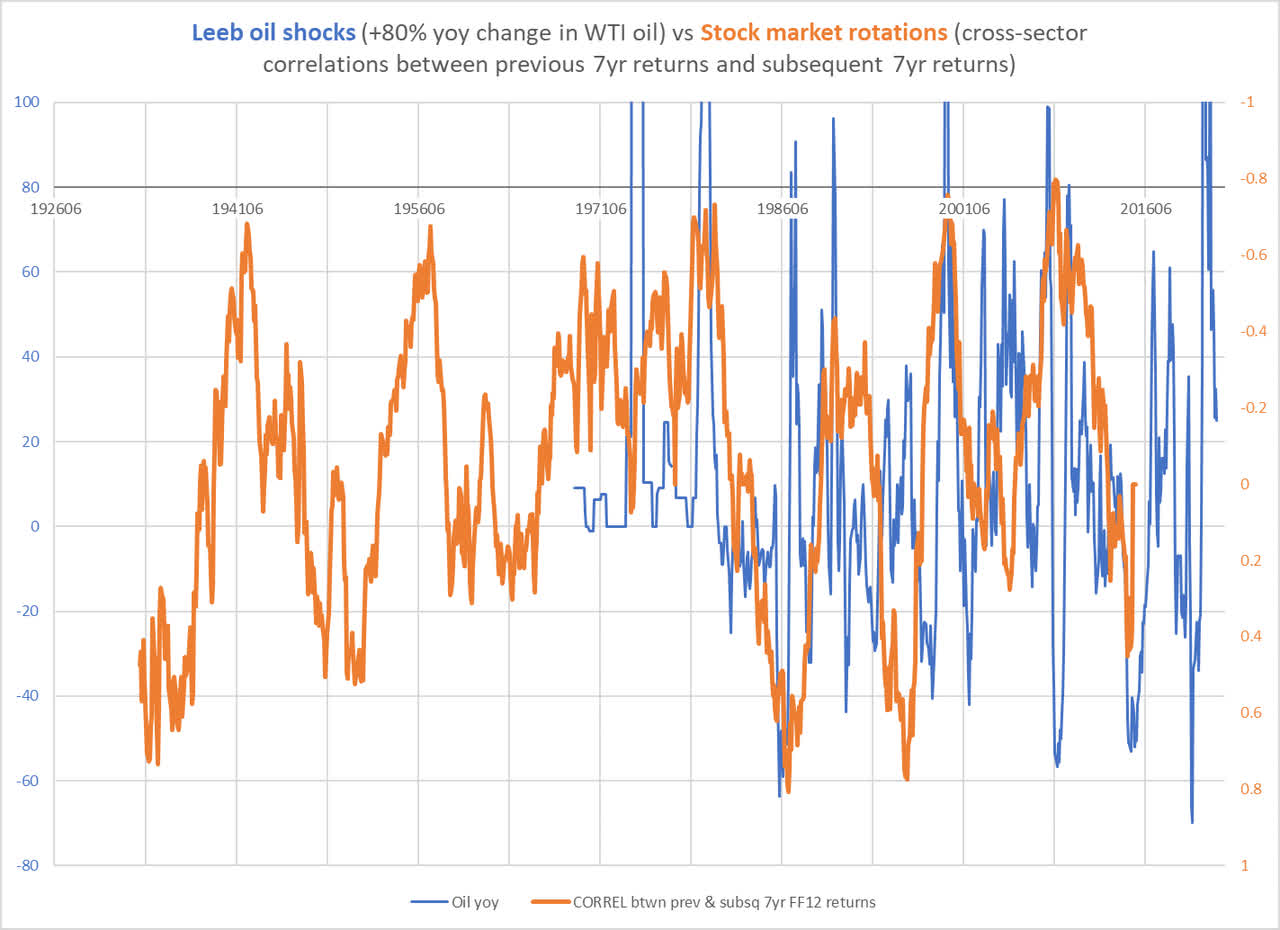
Each of those spikes not only coincided with the beginning of sectoral transitions (again, most obviously played out in the tech and energy sectors), but they also preceded cyclical stock market shocks, or “crashes”, if you like.
Oil spikes generally precede market crashes, but sectoral transitions also tend to experience market crashes during the early stages of the rotation. The transition from one energy regime to another and from one sectoral regime to another is marked by market chaos, almost as if crashes were a natural part of market ecology. For readers of the “Conjunction and Disruption” series, this will be a familiar theme. The consistent relationships between innovation supercycles, yields, commodity prices, and global political instability suggest the existence of a coherent but dynamic (and thus subjectively chaotic) system.
Chart H. Stock market crashes appear to play a role in market rotations. (Fama-French, Shiller)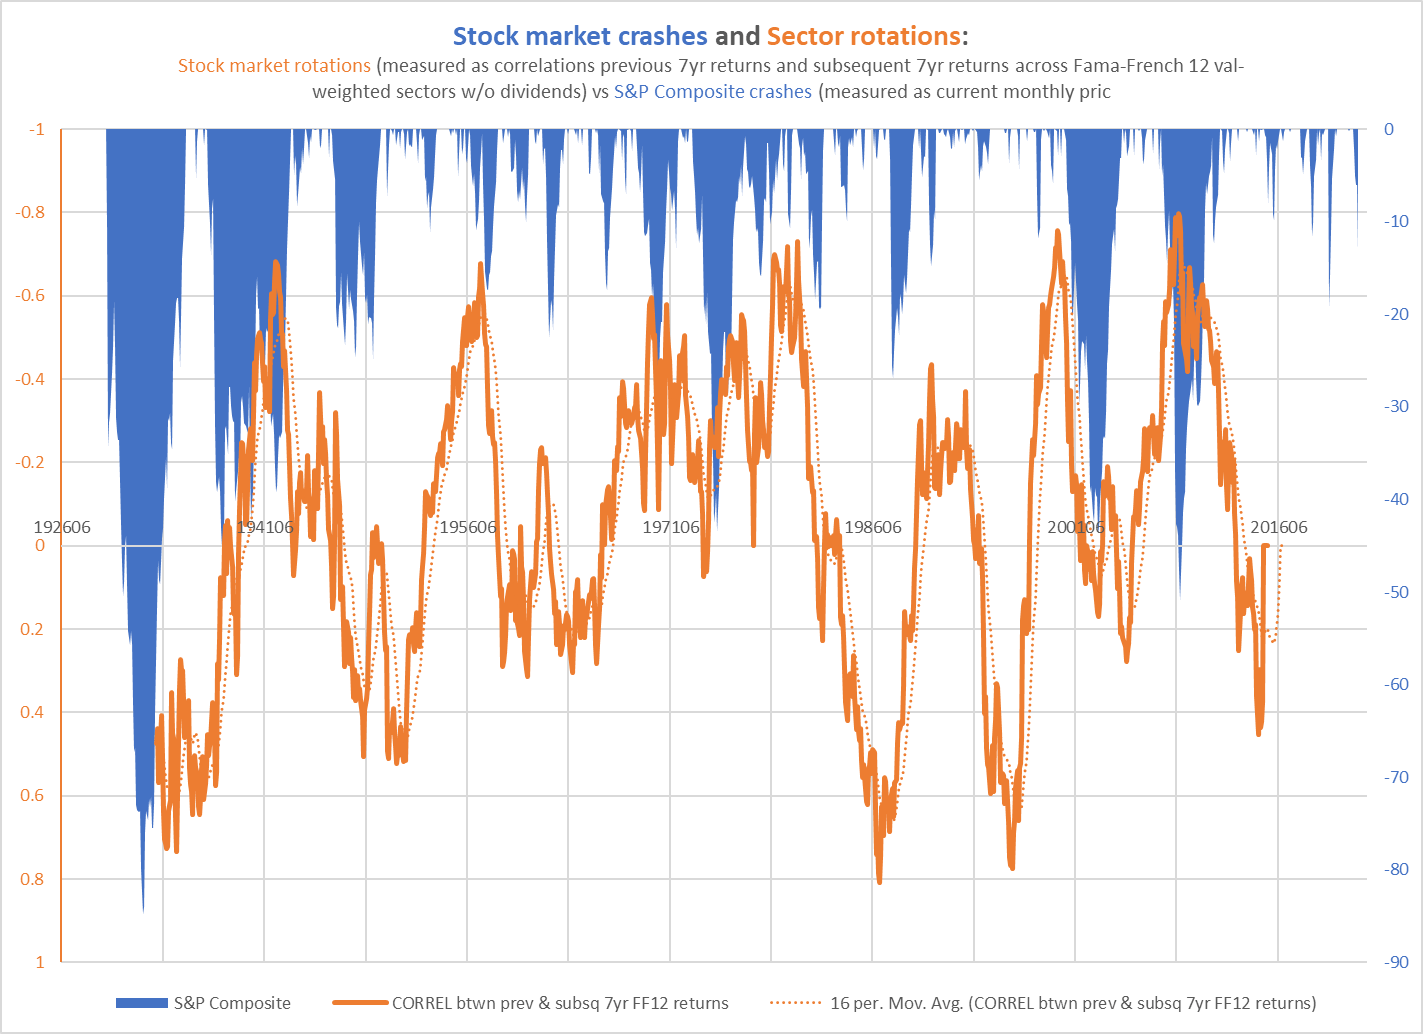
But to stick with our theme of sectoral rotations, we have had a decade of tech-led stock market booms and unusually depressed energy prices and energy sector returns. Since the 2020 super-lows in oil prices, energy prices have roared back with a vengeance. So, we have a severe, long-term sectoral imbalance punctuated and then punctured by a cyclical energy shock. Sectors are already rebalancing, but a stabilization in energy prices is not likely to reverse the mechanisms already in motion. We “need” a cyclical market crash first, but more importantly, it takes years for these sectoral imbalances to unwind, and “secular” trends do not typically stop until the inverse imbalance has set itself up. In other words, tech is not likely to become a long-term buy until you are reading 20-page essays in The Atlantic about how delusional and civilization-crushing the technological trends of the last 20 years have been. Whether or not those concerns are valid is not the point; it is the change in perception that is likely to be an indicator. Right now, it is still too fashionable to be a techno-bull.
There is one more conclusion we can draw from the reversal of the tech-boom/energy-bust trend: stocks generally are likely to do poorly for as long as the energy sector is in the ascendant. This is not because energy prices will necessarily be high. The energy sector outperformed the tech sector during the Depression not because energy and other commodities were hot but because earnings were cold. More to the point, commodity prices were just a bit warmer than earnings.
There is a modest inverse correlation (-0.45) between energy sector dominance and overall stock market performance under both high-inflation and deflationary market regimes over the last century. Why might this occur?
If we assume that sectors with high profitability ratios and higher growth prospects (like tech stocks) are likely to have higher PEs, then periods of either very high inflation or very low inflation would likely have a relatively negative impact on high-profit industries. If inflation were very high, we could reasonably expect commodity prices, even real commodity prices, to be very high. A boost to commodity prices would have a tendency to disproportionately lift the margins of commodity stocks, which then feeds into the price and dividend performances of those stocks. The notion that cyclical and commodity stocks would outperform in a commodity supercycle is probably not very controversial, but I want to show that there may be an orthodox justification for expecting the same outcome during a sustained, disinflationary growth shock.
The table below is from a white paper on the relationship between PE ratios, growth prospects, and profitability (measured as return on invested capital (ROIC) by Epoch Partners called “P/E Ratios: A User’s Manual”. It illustrates the notion that companies with higher profitability are likelier to have disproportionately higher PE ratios for each incremental increase in their expected growth rates. The reason is that “Every company…faces the same dilemma: the faster you want to grow, the more of this year’s earnings you need to reinvest. But the more you reinvest (to generate higher g [earnings growth]), the less free cash flow that leaves for you to distribute to shareholders”. Pursuing growth always involves tradeoffs. If your ROIC is near or below your cost of capital, you will have to rob Peter’s dividend to pay for Paul’s CAPEX.
Chart I. A decline in growth may impact companies with high profitability more dramatically than it does companies with low profitability. (Epoch Partners (link in text))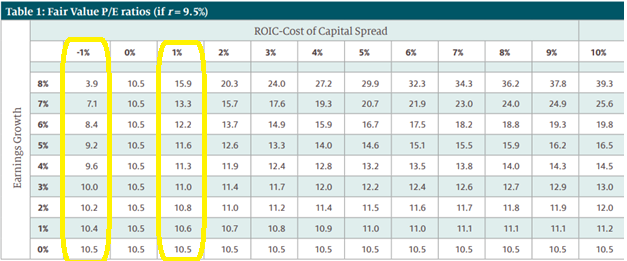
I have highlighted two columns to try to illustrate the point with respect to the way different industries might react to secular deflationary shocks. Imagine two industries with ROICs of 10.5% and 8.5%, respectively, where the cost of capital is 9.5% for each (as in the table). Assuming that growth expectations declined uniformly, the PE ratio for the low-profitability industry would actually rise while that for the high-profitability industry would fall. Costs of capital and growth expectations in the cyclical and tech sectors, respectively, are likely to differ by significant margins. If we imagined that ROICs, which are normally stable across industries over the long term, might also be in greater danger during a general deflation, this could amplify the process we just described. A simultaneous contraction of ROICs and growth, in other words, would most likely do greater damage to tech companies (including advertising, entertainment, and discretionary goods and services) than to those which provide cyclical but essential physical needs (energy, foodstuffs, chemicals, metals, etc.).
This model, especially as I have construed it here, is a narrow construction of the relationship between growth and relative prices across firms and sectors. It potentially explains why the first slight whiff of a general growth slowdown would disproportionately impact tech sector stock prices. In the column that shows a theoretical company with a ROIC 1% higher than its cost of capital, a decline in growth from 8% to 0% would see a roughly 33% fall in its PE. But, a company with a 6% spread would see a 66% decline. In the great tech declines of the 1930s and 2000s, declines were even steeper than this.
My suspicion is that, in the last six months, we have sort of been caught in the transition from a high-inflation scenario to a deflationary shock. The massive boost in energy prices is a boon to long-maligned energy stocks and a likely dampener on consumer sentiment and profit margins. If investors, even at the margins, are expecting lower growth rates for stocks generally, that growth fear is going to be disproportionately felt in high-ROIC companies. Ultimately, I expect that the energy sector will succumb to a growth shock, as well, but at least up until a few days ago, energy stocks continued to soar. This is, in part, why I disagree with those who think that an outperformance in the cyclical sectors necessarily implies a high-inflation, high-commodity environment. We can get a similar relative outcome in a deflationary shock.
To recap the two theses covered thus far, in “Conjunction and Disruption”, we cover the broad, overarching principles governing the relationships between markets, political stability, and technological progress, and in “A Primer on Sectoral Rotations”, we focus somewhat more on the internal sectoral dynamics and their implications for broader market outcomes. The first suggests that we are still in the high-PE phase of what I believe is a Kondratiev/Schumpeter supercycle in markets, innovation, and geopolitics. The second suggests that the contribution of tech stocks to the lofty PE ratios of the broad indexes is coming to a close. Thus, if high PEs are going to be maintained for the S&P 500, either other sectors will have to do the heavy lifting (again, on the ‘P’ side) or that earnings growth will have to come to a halt. In the next section, I argue that history suggests a long-term halt to earnings growth is the likeliest outcome.
Irrational Exuberance
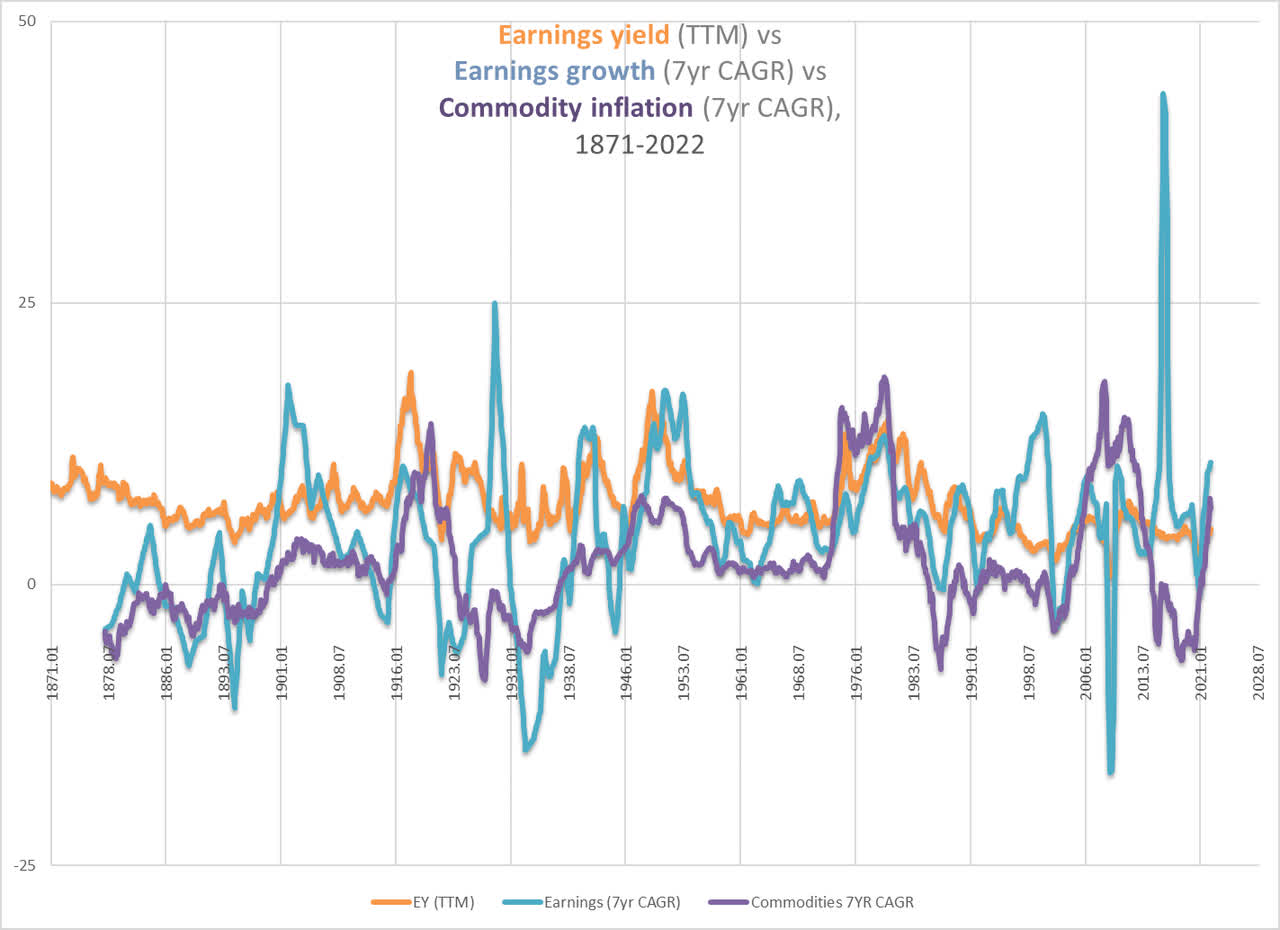
In “The Death of Irrational Exuberance”, I argued that not only do commodity prices closely track the earnings yield but so do earnings themselves. More specifically, the rate of earnings growth has historically had trouble sustaining levels higher than the earnings yield. When it has managed to sustain a level above the earnings yield for more than a few years, the result has been the same each time: collapses in both earnings and stock prices.
Difficulty breaking above the level of the earnings yield is curiously a struggle for Treasury yields and consumer inflation, as well. In other words, commodity prices, consumer inflation, bond yields, and earnings growth all behave as if they were being ‘regulated’ by the earnings yield.
Chart J. Long-term consumer inflation has largely converged towards the earnings yield. (University of Michigan, Shiller) Chart K. Commodity inflation, the earnings yield, and earnings growth tend to be correlated except in the final years of a stock market boom. (Warren & Pearson, St Louis Fed, World Bank, Shiller)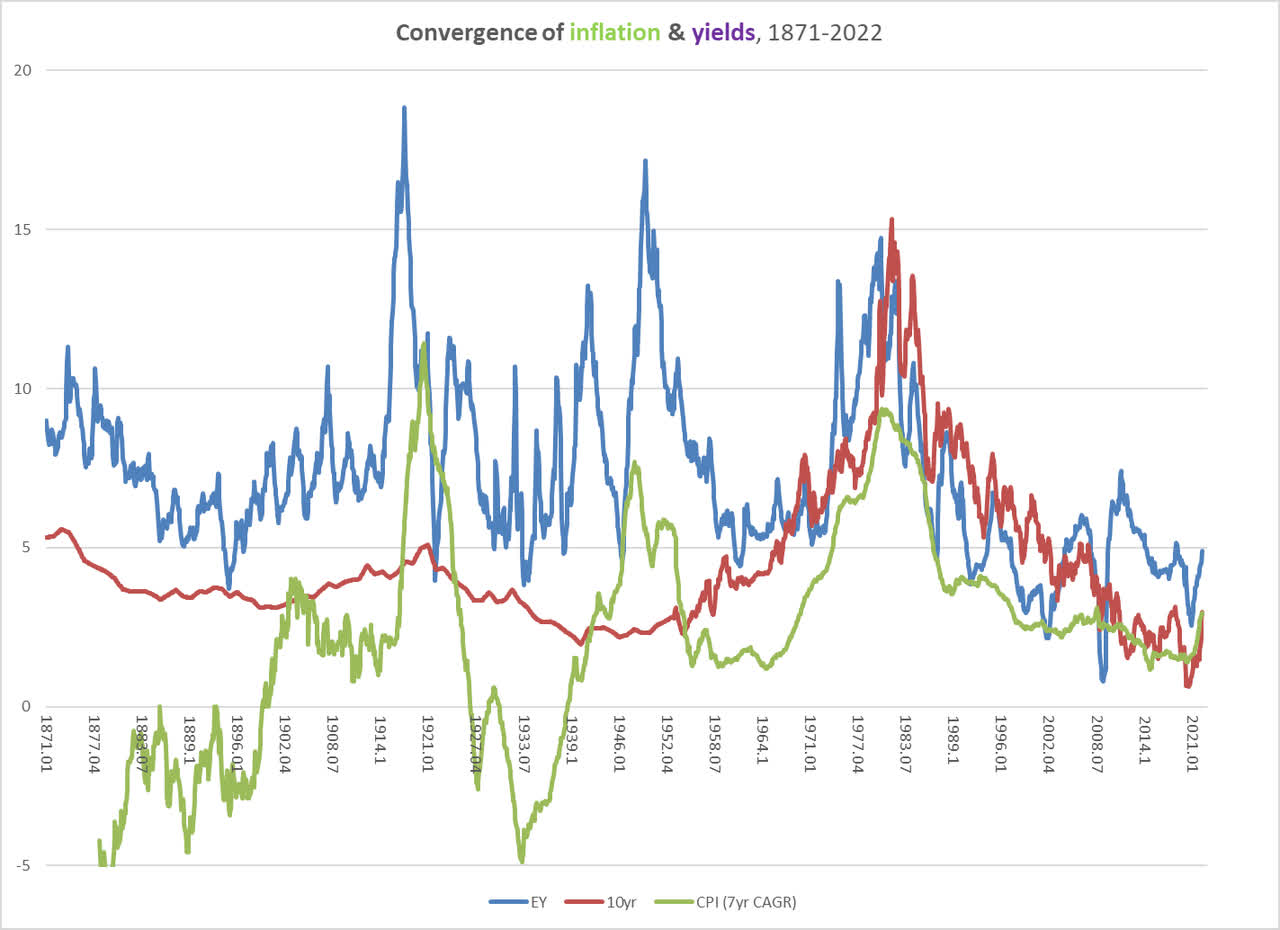
There are a handful of reasons I think this is not absolutely nuts:
The earnings yield already has uncanny relationships with other factors discussed above (war, innovation cycles, and commodities); earnings growth does not fundamentally alter that. Breakdowns in the relationship have been consistently followed by long-term bear markets, which suggests the possibility of a connection between the yield and growth. This relationship is actually implied in Shiller’s CAPE. The CAPE ratio is mathematically nothing other than long-term earnings growth divided by the earnings yield. Thus, we find that very high CAPE ratios have historically been combinations of a low earnings yield and high earnings growth rates. Earnings growth rates have a curious habit of significantly breaking above the earnings yield exactly once during each supercycle in yields, typically at the peak of the CAPE ratio, and typically near a market top.
Less surprising perhaps is that PE ratios have a modest capacity for anticipating future earnings growth. If we calculate historically realized PEG ratios, we find that they are pretty good at anticipating price returns. To put this another way, stock prices appear to respond to earnings beats, if we assume that PEs are themselves expressions of market expectations of long-term earnings growth.
Chart L. Breakdowns in correlation between earnings and yields has historically occurred near peaks in Shiler’s CAPE ratio. (Shiller)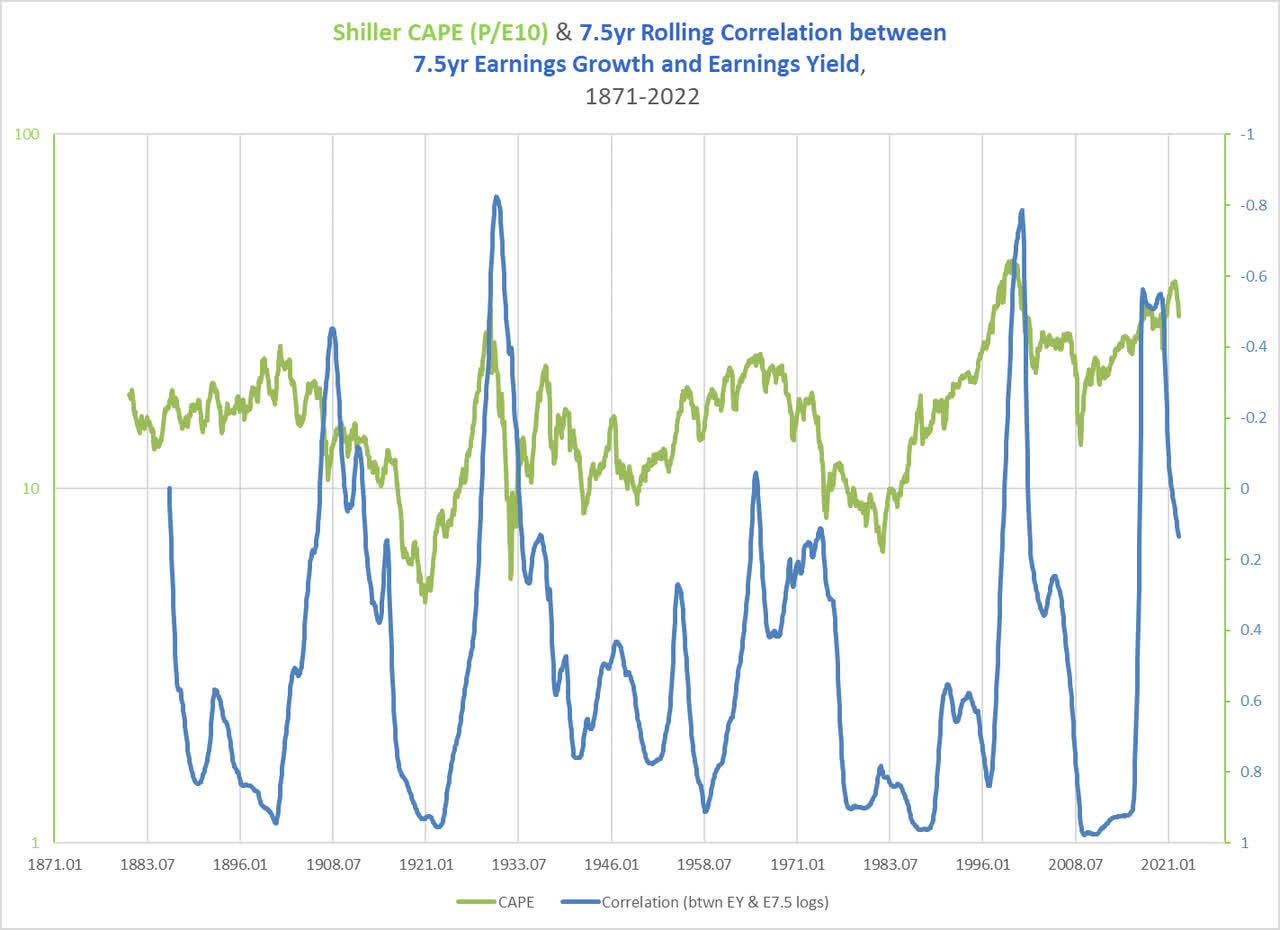
What we are left with is the implication that, for whatever reason, in the late stages of a bull market, earnings growth tends to exceed implied expectations. PEs rise with earnings growth, thus raising expectations even higher, but since earnings growth appears to either be limited somehow by the level of the earnings yield or simply because earnings growth has a tendency to mean revert, expectations are suddenly dashed and markets crash.
Curiously, these imbalances in the relationship between earnings growth and the earnings yield typically arise at the same moment that tech performance has attained unsustainable levels vis-à-vis the other sectors. The 1920s, 1960s, 1990s, and 2020s each have experienced broadly similar patterns. Tech dominance, energy weakness, stock market booms, high PEs, and unusually high earnings growth in a low-inflation environment followed by an energy transition, an earnings collapse, and a market crash.
Based on the patterns laid out in “The Death of Irrational Exuberance”, I produced the “hard reversion” chart in this article. It is less a prediction than one of the few scenarios that would fulfill all of the historical conditions described in the series.
Chart M. Do central banks have the power to will higher earnings in case of a depression? (Author)
Thus far, that scenario has proven to be too conservative on price declines and too aggressive on earnings declines.
If the S&P 500 closes below 3000 in the coming months, it will be necessary to revisit the analysis to start thinking about whether adjustments need to be made. For the moment, with both the long-term backdrop and momentum so negative, I think there are not many good reasons to be long the market as a whole (and few sectors, either).
The Next Big Thing: Earnings
The next shoe to drop should be earnings, especially as commodities, especially industrial metals, come down. If this seems counterintuitive—after all, reduced price pressure should theoretically be good for margins—it is nonetheless the historical norm. As I discussed in DBB: The Cyclical Downturn Has Likely Begun, industrial metals price cycles have always been highly correlated with earnings cycles (just under 0.6 since 1960).
To be clear, just because metals fall, it does not mean that earnings must fall, but when metals decelerate, it is typical for earnings to decelerate, as well. If we throw in high energy inflation, this pressure becomes even more severe, and in an overall bearish environment susceptible to major earnings shocks, a fall in metals prices typically coincides with a fall in earnings. That does not have to be this quarter, but we ought to see deceleration.
The more important question is the long-term outlook for earnings. This is, in my opinion, the “craziest” part of my forecast. A secular bear market is certainly not good, but it is not necessarily a world-shattering event, even if it might feel like it at certain moments. As horrifying as 2008 was, it was not the beginning of a global depression. But, a long-term decline in earnings might be.
We have only had one secular decline in earnings since 1895. That was the 1930s, of course, and if it were just a decline in corporate profits and stock prices, it might not have been such a big deal, but it coincided with global economic and human calamity.
Chart N. We have not had an earnings depression since the Great Depression. (Shiller)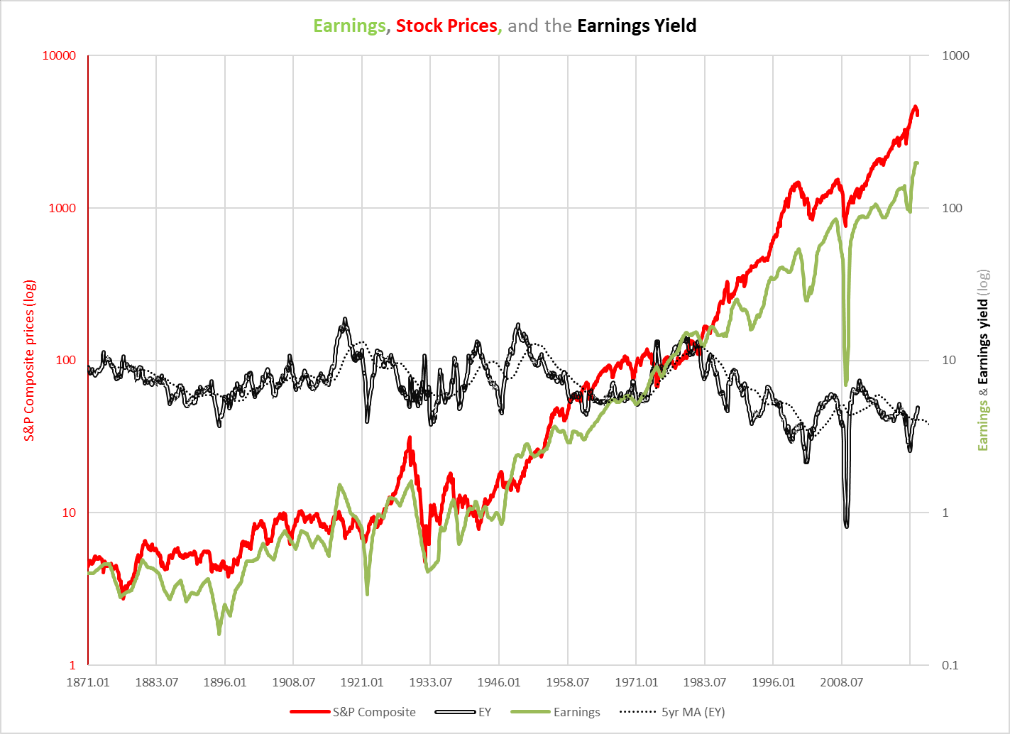
The primary “risk” to this outlook for a secular decline in corporate profits presumably comes from the ability of global governments and central banks to print their way out of such an outcome. If there is anything that seems to have been established in the last two years, it is that these institutions have the capacity to surprise even themselves with their ability to unleash a whirlwind of inflation. Because there is a close connection between the long-term rate of inflation, real commodity prices, and the earnings yield (see Charts J and K), the capacity of fiscal and monetary authorities to create inflation would primarily be felt in earnings rather than equity prices.
In other words, we seem to have a confrontation brewing between the stability of historical patterns and the apparent capacity of these institutions to reverse such patterns. Up until a few months ago, these institutions seemed to have control of the ball, as prices for stocks, commodities, and bonds remained simultaneously elevated. But, they appear to have quickly lost control of the narrative, both on the strictly economic side and, increasingly, on the political and geopolitical side. As El-Erian has argued, the likelihood is that the Fed “flip-flops” once the “growth consequences become clear”.
Conclusion
With attention still primarily directed towards high inflation, it seems unlikely that global institutions are going to try to inhibit deflationary impulses. If anything, they are eager to amplify them. For the reasons explained above and in recent articles, the deflationary impulse should expand from stocks to metals to earnings to agriculture and energy to Treasury yields.
Over the short term, the main question is how intense the deflationary impulse is going to get, and while stocks and metals will give important clues about that, earnings are likely to be the more critical factor. A substantial decline in earnings over the next two years (to $100 per share) would be within the historical range. The cyclical deflationary pressure could conceivably turn out to be worse than is portrayed in the “hard reversion scenario”. It is, after all, a “hard reversion scenario” and not a “worst-case scenario”.
The long-term question is more important. We can expect a tremendous rally off of whatever cyclical lows are finally put in (presumably over the next two years), but history suggests that such a rally in this environment will be unsustainable.
That is, we appear to be at the conclusion of a tech-led “secular” bull market but still closer to the middle of a high-multiple, low-inflation supercycle. The degree to which one accepts these two propositions is the degree to which one has to accept a long-term future of virtually no growth in earnings. If the stock market were to simply oscillate at the current level over the next 8 years and PEs were to remain effectively the same as well, that is by definition a zero-growth scenario for earnings.
This has not happened in nearly a century, and this analysis could be wrong. But how ought one think about depressions? Are we sure that we know how they happen and how they can be stopped? We know too much about markets and economics today to fail to force a reflation if necessary? I am skeptical.
As I attempted to show in “Conjunction and Disruption”, inflation, commodity prices, and yields have been closely connected to supercycles in innovation and global political stability over the last two centuries at least. It is not that our modern institutions and technocrats necessarily are incapable of mashing the correct levers to achieve certain outcomes, but it is also possible that they could wreck their own machinery in the process.
If it turns out that the 1930s are the closest analog to our decade, we might expect to see greater assertions of state power coupled with greater divisiveness. In the late 1930s, the economy began a process of reflation—most conspicuously in corporate profits—that has been maintained ever since. No cyclical deflation has managed to metastasize into a general deflation in that period.
As part of the US government’s efforts to reflate markets, through a declaration of a national emergency, the state seized publicly held gold in 1933. Whether the government would attempt that particular action again in a deflation is not the point. Rather, the question is the capacity of the government today to take action that is both drastic and effective. The state is much larger than it was in 1933, but the country and global politics generally are more divided. It is not clear to me that the state has the capacity to take radical action that would not further destabilize political order. Were governments to start desperately printing money, even in a deflation, memories of the 2008 bailouts, Covid mandates, and the current inflation would probably feed into a general disgruntlement that began perhaps as early as the Iraq War.
My effort is not to game everything out but rather to make a case for a possibly reduced capacity for the state to produce economic outcomes. In a period where the power of political institutions is expanding at the top, their authority has been corroding from below. This is not only because the institutions themselves are seen as suspect but because political factions see them as captured by nefarious forces. There is no need to name those forces, since nearly every reader will have their own ideas about what they are depending on where along the ideological spectrum they find themselves.
Chart O. How much room to maneuver would institutions have in a depression? (Pew Center)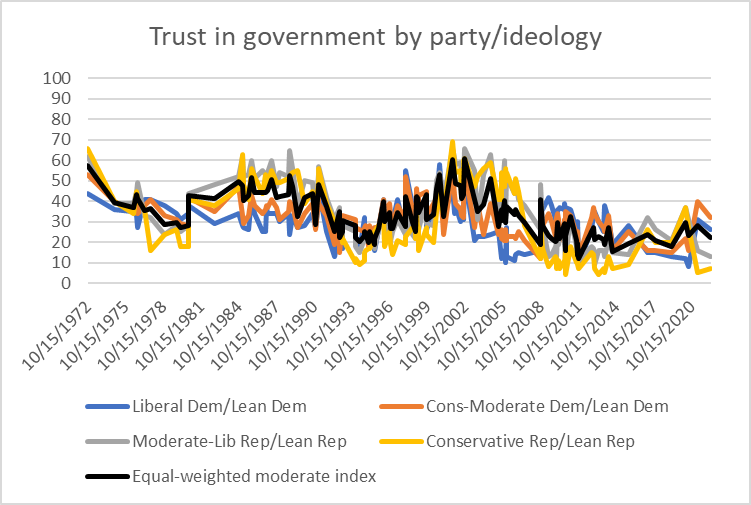
The ultimate point that I draw from the patterns I found in “Conjunction and Disruption”, particularly with regards to the apparent connections between innovation arcs, war cycles, and asset classes, is that we, even collectively, have a lot less conscious control over economic and market outcomes than we think.
From the research for “A Primer on Long-term Sector Rotations”, I learned that sector prices behave as if they were conscious of one another and the macro environment. I suggested one possible and limited mechanism for that in the aside on the relationship between ROICs, expected growth, and PEs above. A key relationship at both the cyclical and supercyclical levels appears to be energy prices. In “The Death of Irrational Exuberance”, I concluded that the S&P 500 would need to see an unprecedented extension of historically high earnings growth to sustain its price performance and that in a PE supercycle this was the least likely period in which high growth ought to be expected, especially as cyclical pressures or patterns came to bear (primarily in the form of high commodity inflation and rising yields). Now that stocks, commodities, and bond yields appear to be decelerating (albeit to different degrees), earnings are likely the next shoe to drop.
On a personal level, I have shifted out of especially high-risk bearish bets on tech and semiconductors like the ETFs QID and SSG and into the ProShares Short QQQ ETF (PSQ) and long-term Treasury ETFs like TLT and ZROZ. I have also closed my remaining long commodity positions in favor of bonds. If the Nasdaq 100 were to rebound 20%, I would likely shift back to taking more downside risk. Over the short term, I am more worried by a rebound in tech stocks than a fall in Treasuries while in the long term, I am more confident in a steeper decline in tech stocks than I am a rise in Treasuries. The right mix depends, of course, on risk tolerances, investment horizons, and personal investment requirements. In the articles cited here as well as in others, I have suggested a variety of ways to attack a long-term bear market over different time horizons. For now, earnings are the thing.
I began the article with Thony Christie’s description of Copernicus’s initiation of the debate on the respective merits of heliocentrism and geocentrism in the 16th Century. I think we are in a similar crisis today. We have lots of pat, commonsensical explanations about prices, inflation, long-term returns, long-term growth, the role of the Fed, and the nature of progress. But, as I have tried to show, especially in “Conjunction and Disruption”, Nikolai Kondratiev and Joseph Schumpeter pointed to an economics centered around the human as constituted in history rather than the human as more or less rational economic automaton, and their formulations from a century ago are a much closer approximation of markets and history than our more modern theories. Not only was Copernicus’s hypotheses messier and less substantiated than the prevailing Earth-centered science of his time, there was no apparent need for his revision. Yet, once this breakthrough was substantiated, or rather in the process of substantiation, we were put on the path of the Scientific Revolution that culminated in Isaac Newton’s theories 200 years later. The methodology I am employing here is not well founded theoretically and it does not offer clean, intuitive explanations of the factors involved, but I think it is a more comprehensive model of “nonlinear outcomes” than is offered by any other models available, and I think it deserves consideration by investors looking for new paradigms.
Be the first to comment