

Shutter2U
In my article “SPY: 2008 Vs. 2022, Does History Repeat Itself?” published on October 7, 2022, I explained the technical similarities but also the differences in the underlying situation characterizing the price-action of the S&P 500 Index (SP500) tracked by the SPDR S&P 500 Trust ETF (NYSEARCA:SPY) when compared to the crash in 2008. My analysis led me to conclude that it was the right time to consider a position in SPY, which has since reported a performance of over 10%. I now want to give an update on my opinion, as the time has come to assess the situation, and underscore the upcoming opportunities and risks.
An overview of the actual situation
In this section, I analyze the relevant indicators I observe when assessing the situation of the major indexes in the US financial markets.
I consider the Market Breadth to be a very important sentiment and momentum indicator, especially when measured by the 50-day and 200-day moving averages (MAV). The MMFI index shows the percentage of stocks above their 50-day MAV, while the MMTH reports those over their 200-day MAV at the NYSE.
Author, using TradingView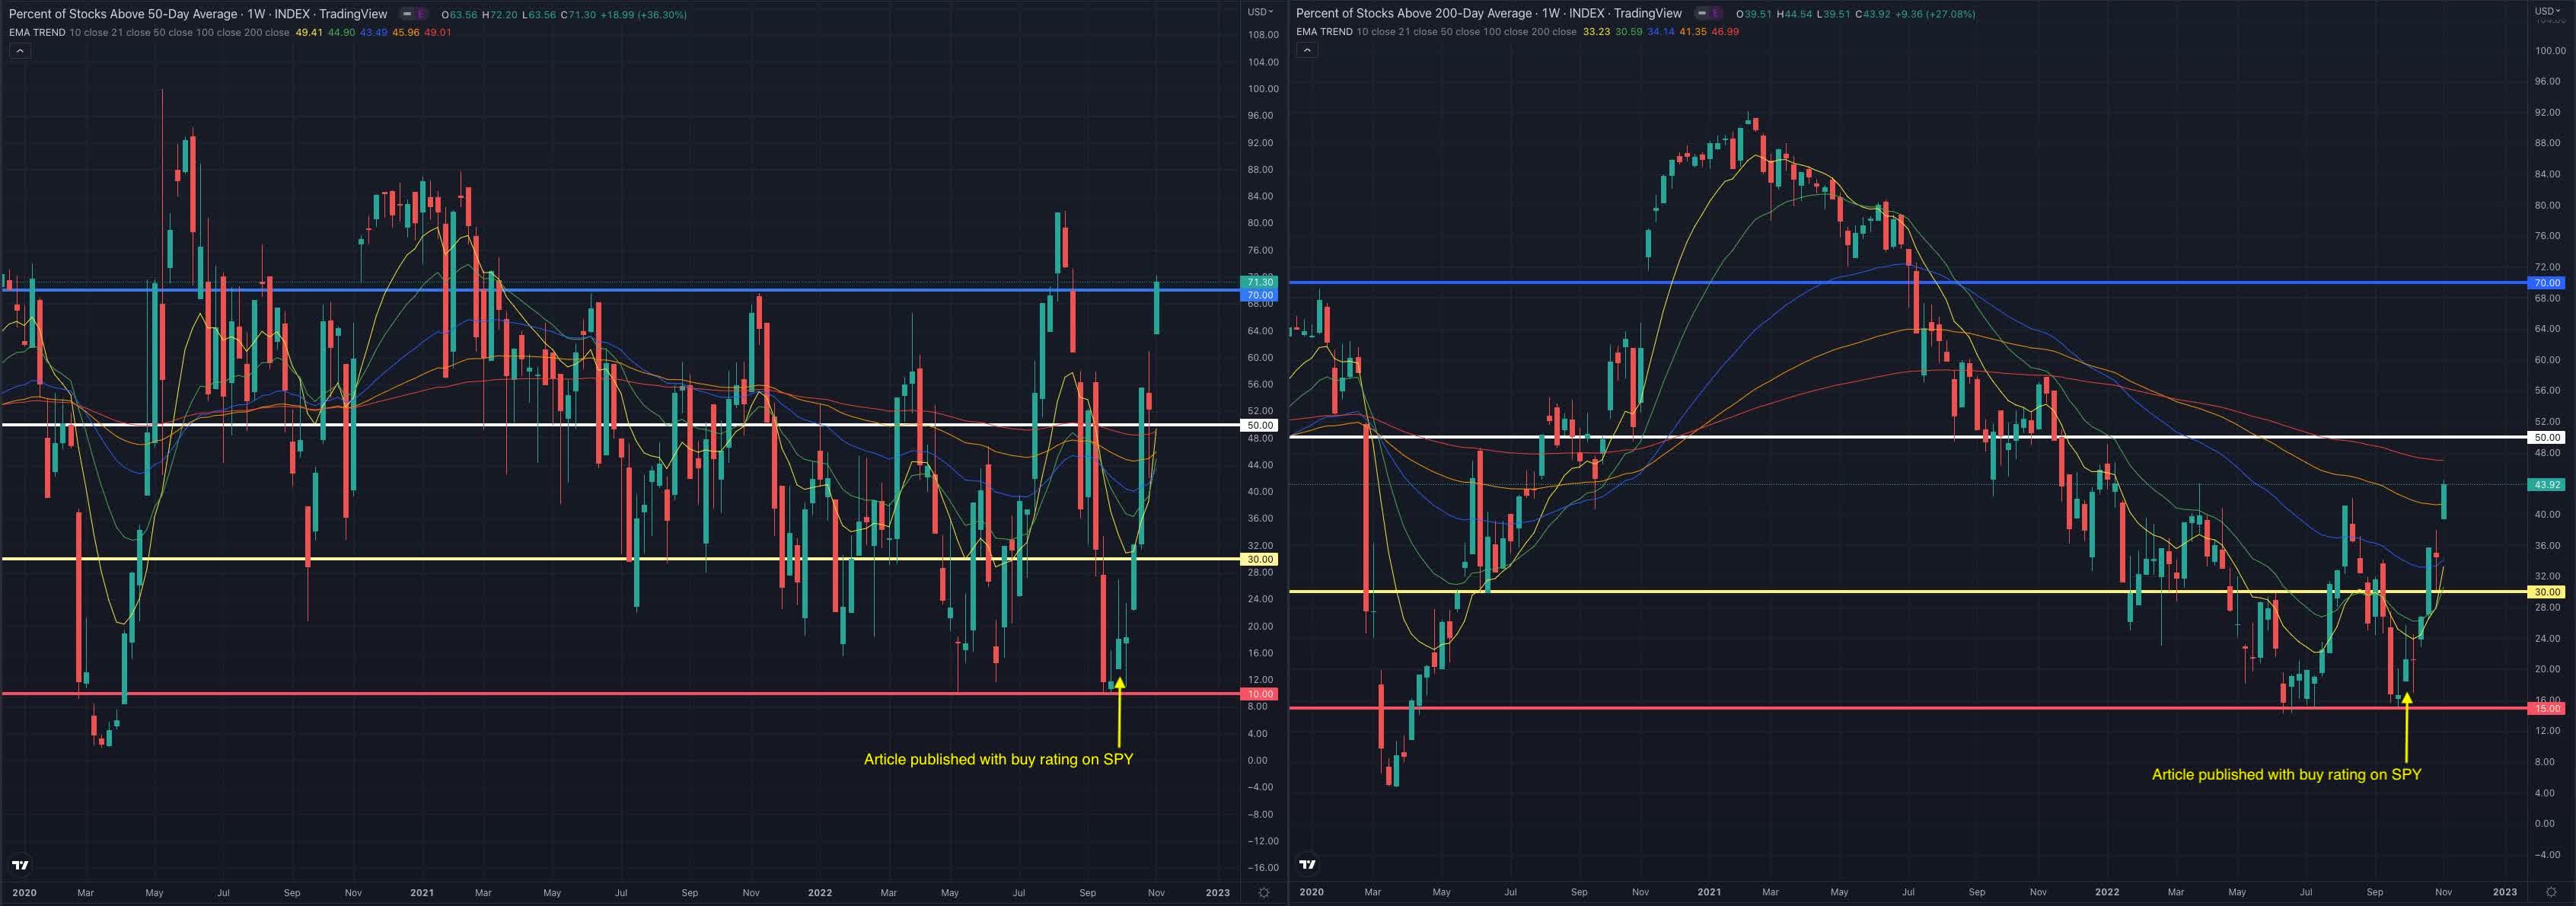
It’s important to notice that despite over 70% of the stocks trading above their 50-day MAV, just about 44% have climbed over their long-term moving average, as the massive sell-off in entire industries will need more time to recover, and new leaders will likely emerge not only from a sector rotation but because of their intrinsic positioning on strong secular growth vectors. Despite it being still early to profile any of those, a closer look at the sectors that lead the recent reversal in the major indexes, and an analysis of the relatively strongest stocks in the most robust industries, can give an idea about the most likely outstanding future opportunities.
finviz
The CBOE Volatility Index (VIX) tends to be lower in bull markets and higher in bear markets, with spikes seen in case of extreme panic, as last seen during 2020, and also observed when measuring its relative strength compared to SPY. Over the whole of 2022, the index was hovering between levels of 20 and 30, with sporadic spikes signaling an increased nervousness among investors.
Author, using TradingView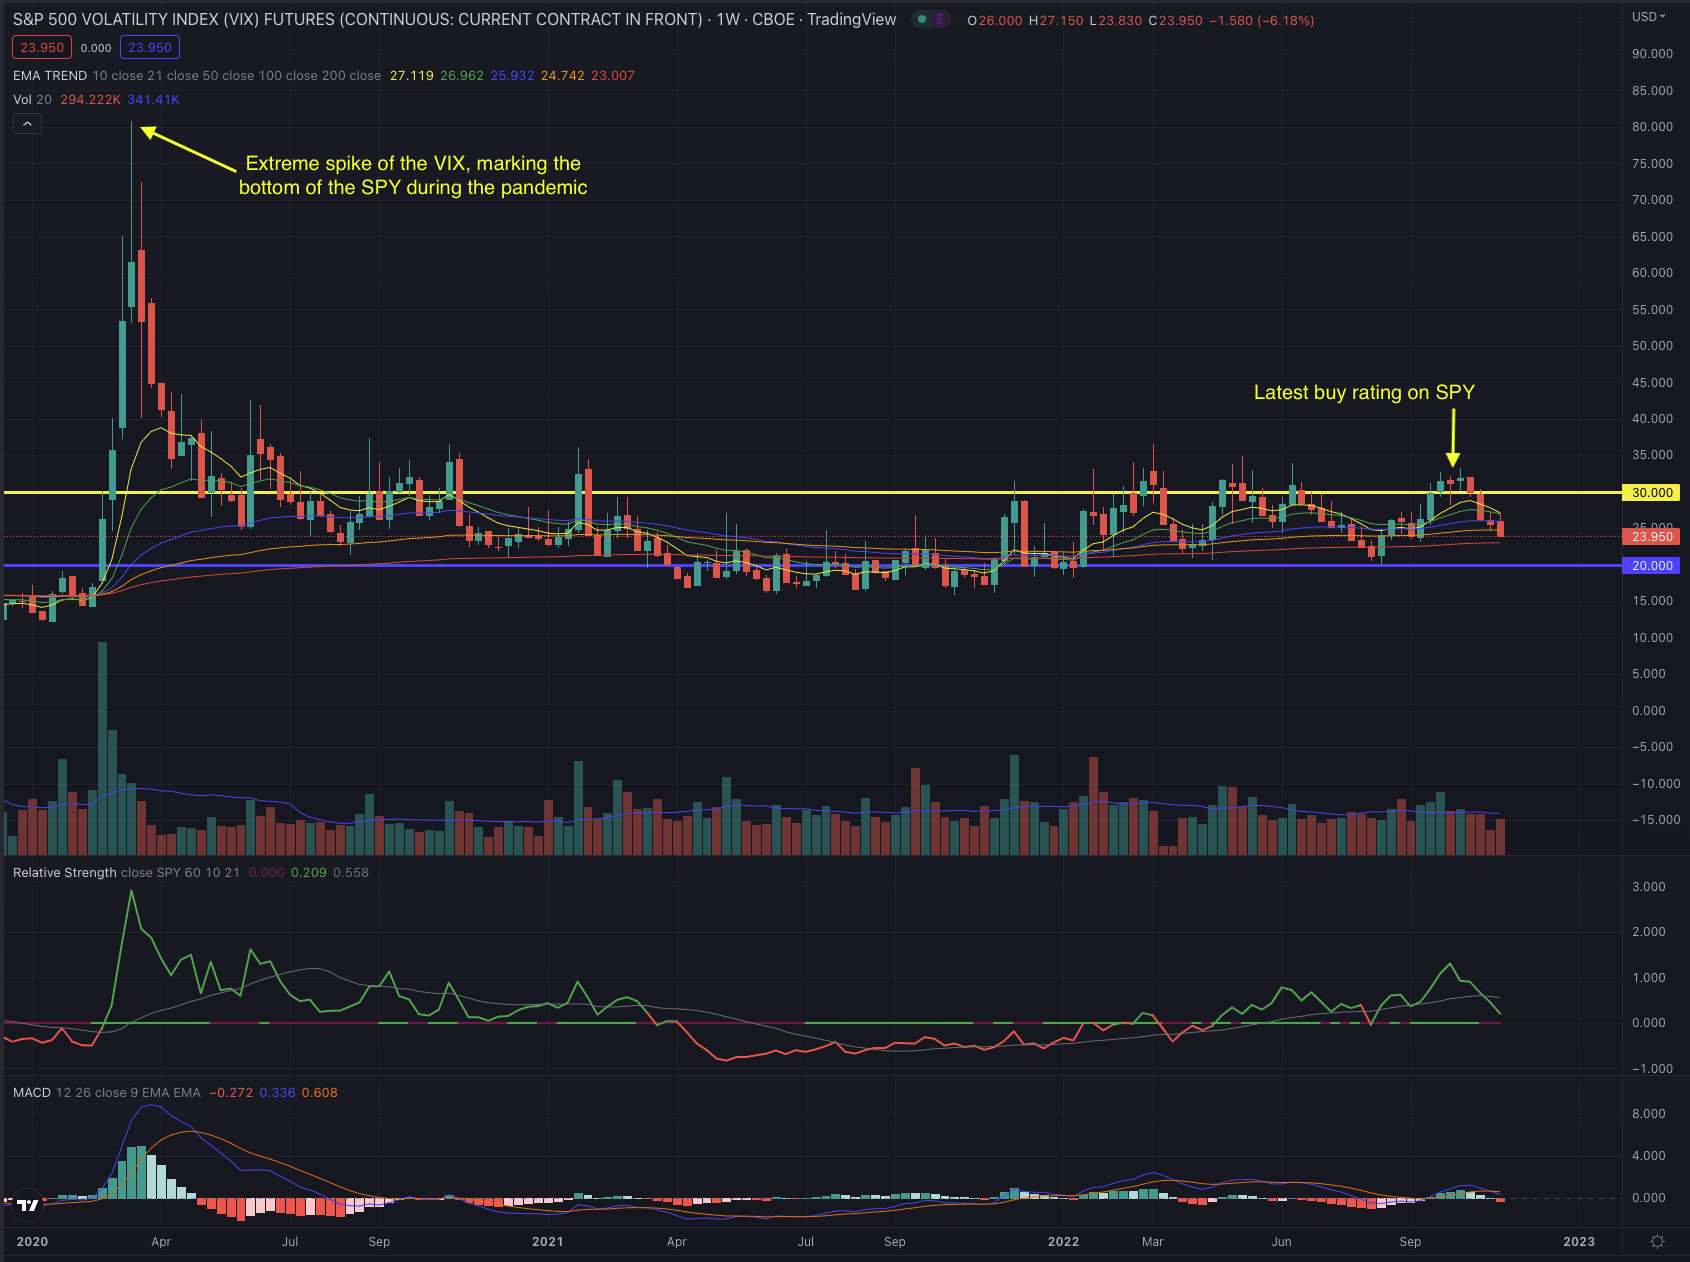
The SPDR Bloomberg Barclays High Yield Bond ETF (JNK), which tracks highly liquid, high-yield, US dollar-denominated corporate bonds, despite having given some signs of a possible bottom, is struggling to significantly recover, signaling the unceasing high risk-aversion in the markets. JNK has been extremely extended on higher trading volume, while it reached even lower levels during the COVID-pandemic or the market crash in 2008.
Author, using TradingView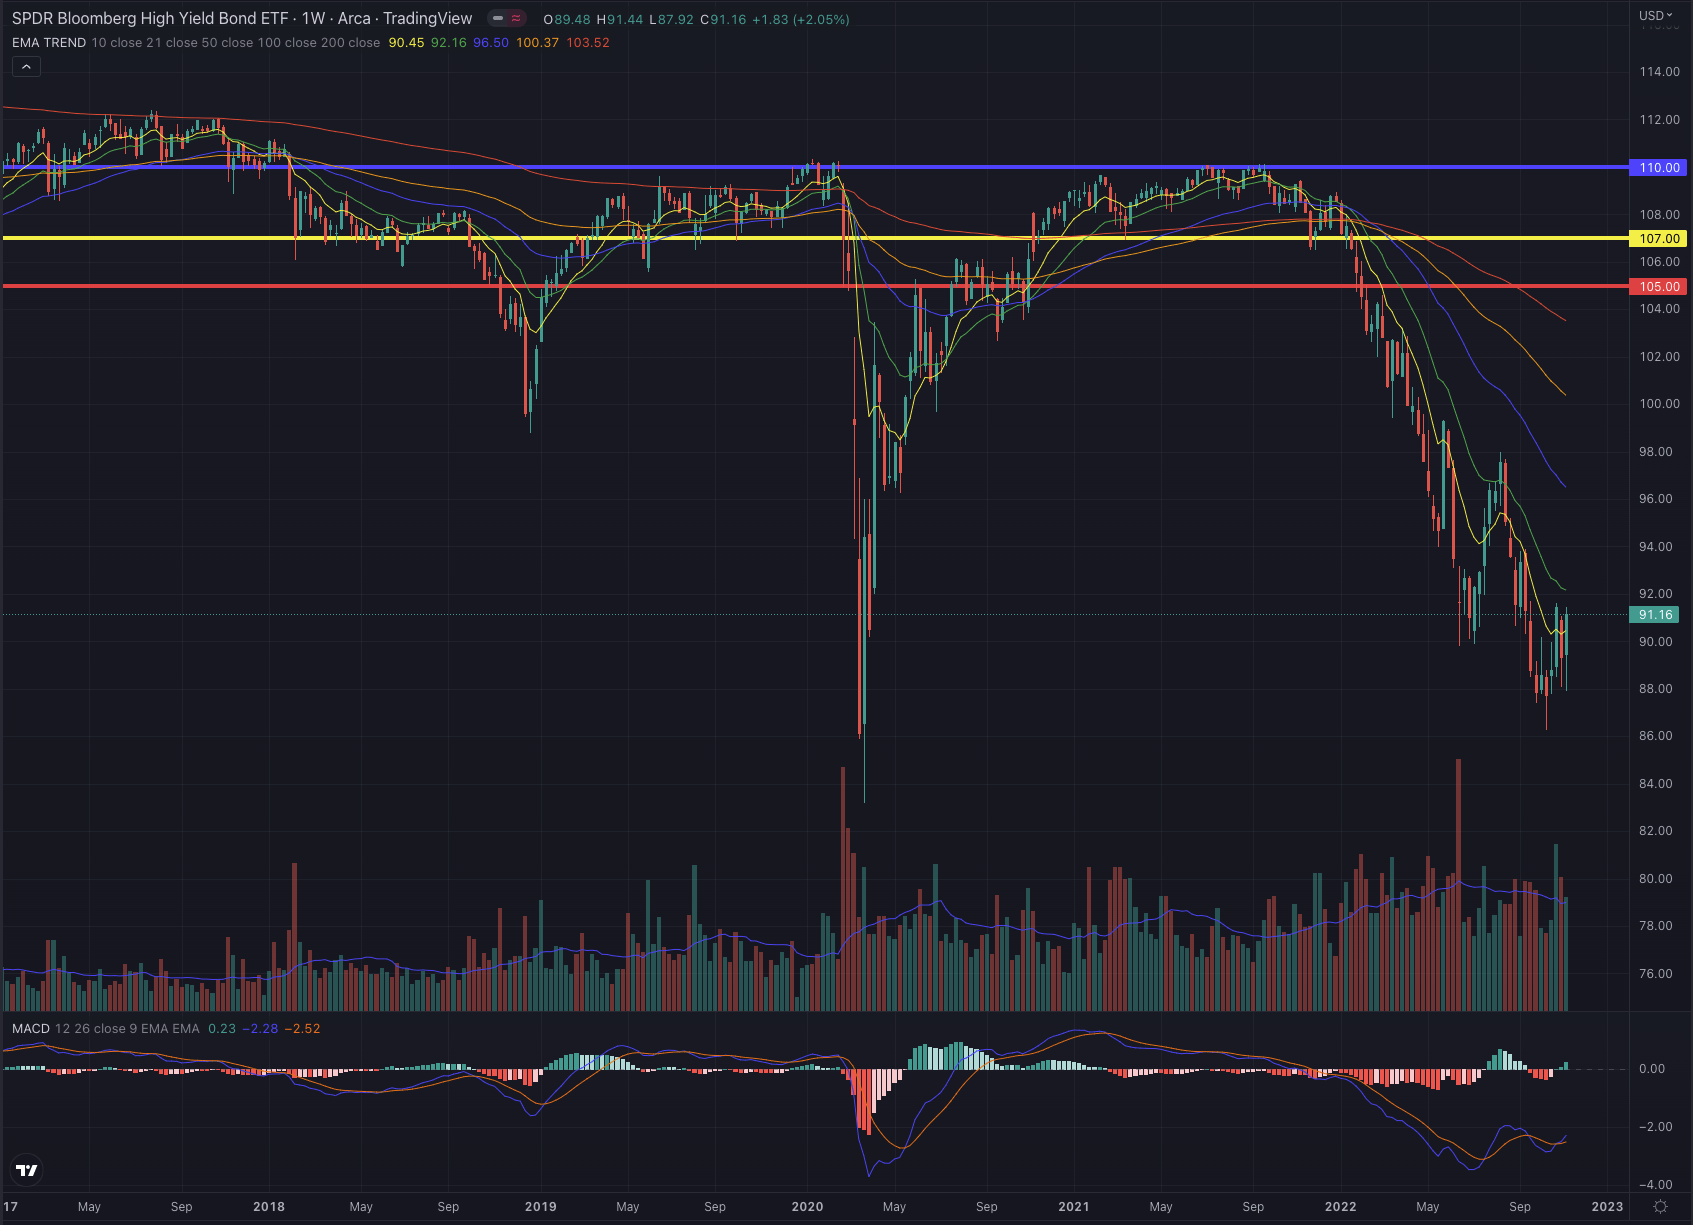
SPY bottomed on October 13, 2022, temporarily breaking under its EMA200 on a weekly time frame, and has since reversed until reaching its EMA100 at the end of last week. While on its daily chart, the index reference is facing its most important overhead resistance, marked by its EMA200. It’s in this kind of situation where investors should pay particular attention to the technicals in different time frames, as the price action may be more straightforward when analyzed from different perspectives.
Author, using TradingView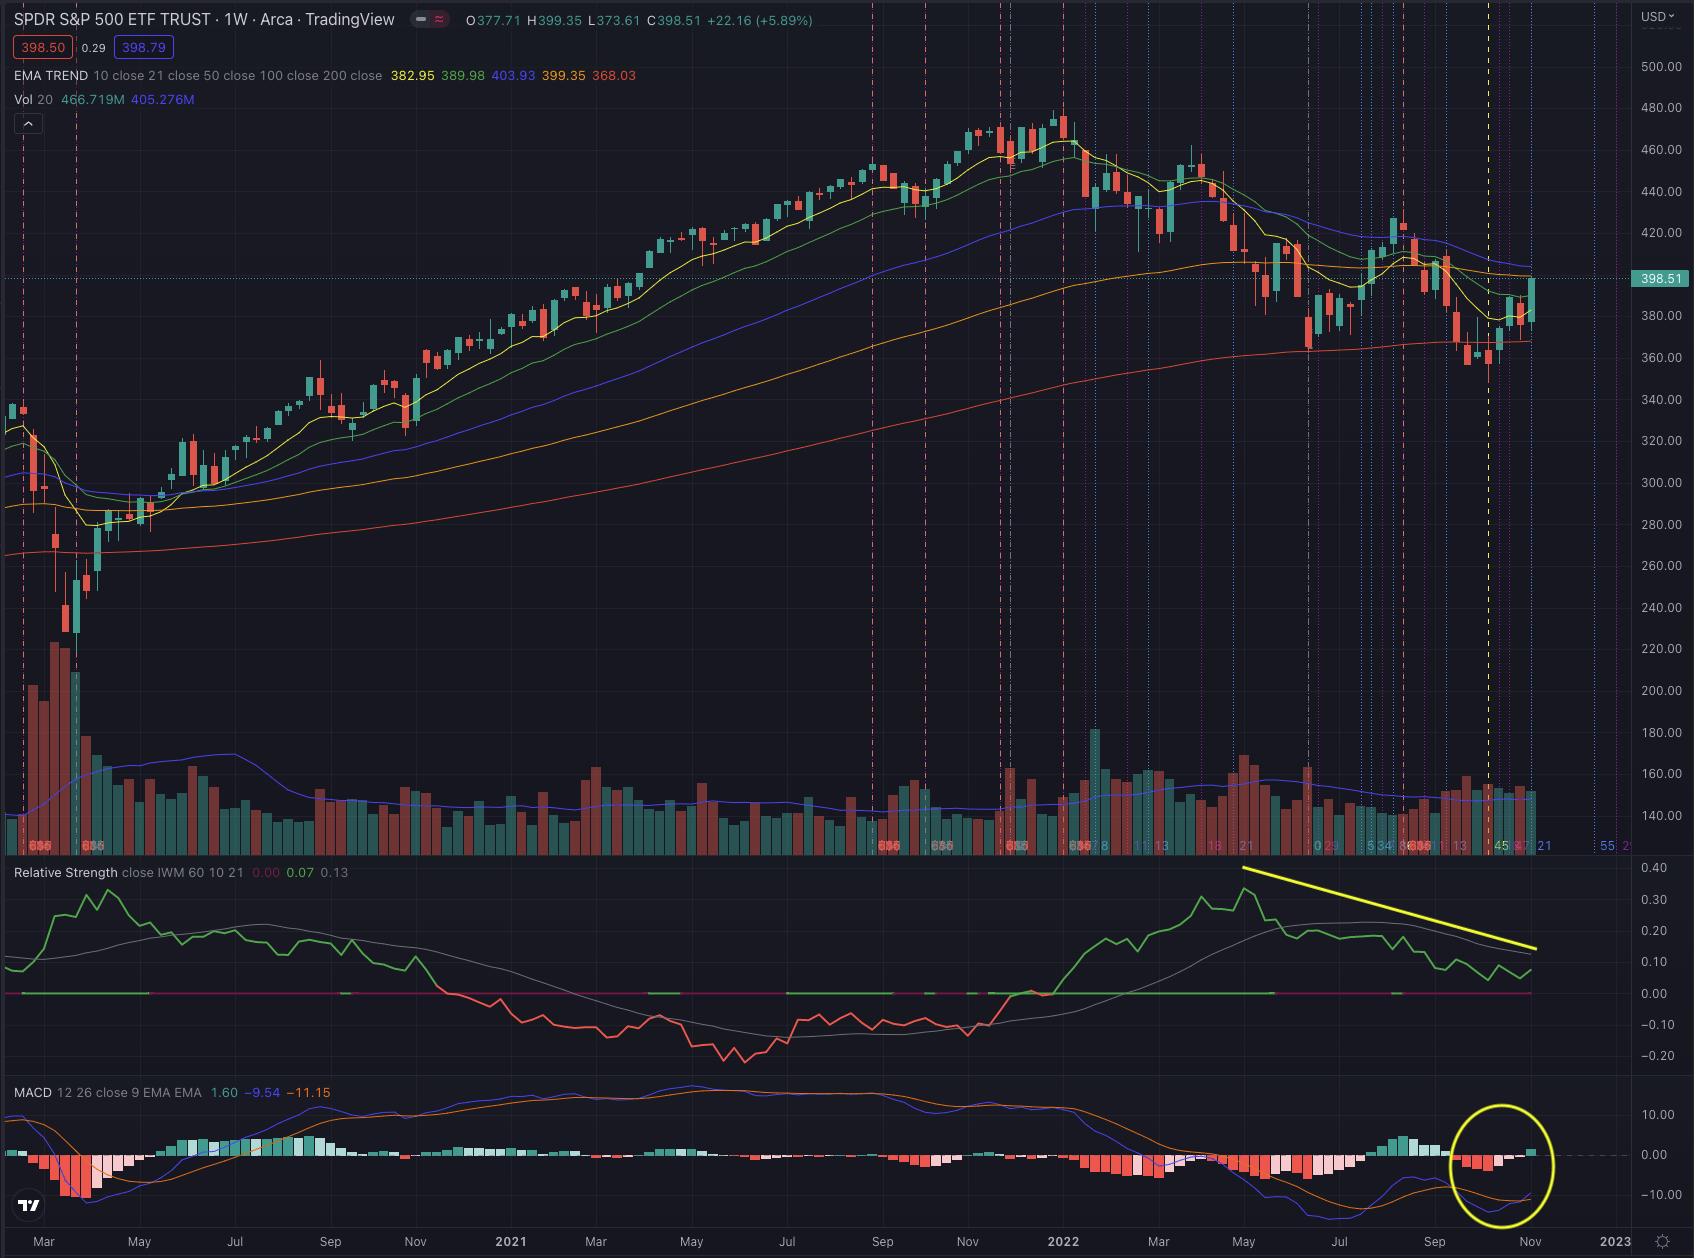
Despite the recent rebound, SPY is still struggling to build relative strength, measured toward the broader small-cap market tracked by the iShares Russell 2000 ETF (IWM), and its momentum is seemingly still not suggesting a strong reversal.
Additionally, the short interest on SPY is tendentially increasing since the rebound of the index during August, hinting at intensified selling pressure and seemingly some disbelief that the recent rally could lead the reference significantly higher.
nasdaq.com with data from FINRA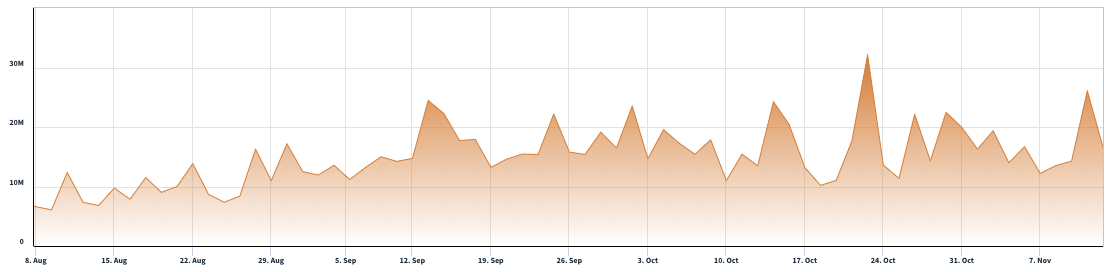
What is coming next?
SPY has completed its Elliott impulse wave sequence and has seemingly formed its corrective wave sequence, despite it is still not clear if the recent formation is still developing into a more significant extension of its C-wave, or if maybe even a new upward impulse wave is forming. SPY also broke out of its downward trending channel despite its volume declining under the average in the last market session.
In this market turmoil, I am quite satisfied with a performance of 10% in a little more than one month, since my last call on SPY. Although I don’t exclude a further improvement in SPY’s price, after the rapid surge in the past week, I expect the market to at least partially consolidate, and digest the recent events. Most importantly, SPY faces its EMA200, a price level that will likely need massive momentum and volume to be overcome consistently, as it now represents the reference’s most important overhead resistance. My target, fixed at $395, has been reached, and while observing the recent wave formation, I now estimate the short-term downside risk being more significant, while the index may search for some support in order to confirm its recent price action.
Author, using TradingView
If the recent formation is effectively only a corrective wave sequence, investors should be prepared for another likely downward impulse sequence that could start as soon as SPY would be rejected at its EMA200. I see the actual situation as increasingly risky and as SPY has reached my target, I change my rating to a hold position, until the situation will be clearer and the rejection or breakout from the EMA200, is confirmed. Despite this, for short-term investors who believe in more momentum build-up, a possible way to trade this situation, could be to set a stop-loss order under the EMA50 or for more risk-tolerant investors, under the level of wave B, as SPY may test those levels before setting up for more upside.
Long-term-oriented investors who acknowledge the recent price levels as an opportunity could ponder sizing their long positions accordingly, by considering a first position at the actual levels, and by gradually increasing their exposure if SPY manages to overcome its EMA200. I would not consider any major position until SPY has confirmed a significant breakout over its long-term moving average.
The bottom line
Technical analysis is not an absolute instrument, but a way to increase investors’ success probabilities and a tool allowing them to be oriented in whatever security. One would not drive towards an unknown destination without consulting a map or using a GPS. I believe the same should be true when making investment decisions. I consider techniques based on the Elliott Wave Theory, as well as likely outcomes based on Fibonacci’s principles, by confirming the likelihood of an outcome contingent on time-based probabilities. The purpose of my technical analysis is to confirm or reject an entry point in the security, by observing the underlying factors, and most of all its price action. I then analyze the situation of that security and calculate likely outcomes based on the mentioned methods.
My approach in this article is strictly pondering indicators that I consider the most important when assessing the situation of the major indexes in the US financial markets, as this is not a macroeconomic analysis, and instead focusing on SPY, it is consciously ignoring other economic indicators that may be relevant under another perspective.
SPY is facing its EMA200 which is now being tested as the most important resistance. As I have discussed in my previous article, the average bear market extends over 288 days, and despite the actual already running since 311 days, it will most likely need some time to build a strong and consistent uptrend, while the SP500 index and other major references may still test their support levels and could face more downside risk if the underlying conditions worsen. Based on the described indicators, I don’t consider the actual price level of SPY as a buy position, categorizing the index reference as a hold. Investors who followed my last call could achieve a performance of 10% and could now decide to take the profit off the table, or at least strictly limit their downside risk. As the actual situation is more uncertain, I would now wait for better visibility before entering any new position in SPY.
Be the first to comment