

Olivier Le Moal
Here come July earnings reports and the market (NYSEARCA:SPY) is enjoying a little technical bounce, targeting $404 and anticipating that earnings will be as expected. The jobs report was good. Consumers are still spending and, other than an inflation pinch from rising prices, they don’t feel any recession yet.
Bearish Earnings Forecasts
Meanwhile, some companies are having layoffs and hiring freezes. July earnings will probably be as expected, but most of the forecasts will have recession caveats. Those July forecasts will include challenges like the higher dollar, supply disruptions, higher costs, lower revenues, reduced margins and rising interest rates. All of these are having a negative effect on future earnings. Some companies will decline giving any forecast in this disruptive environment. They are looking out long term at a coming recession where things are unpredictable.
Is $364 The Bottom?
Is all of this already priced into the SPY? Probably, but what is not yet priced into the SPY is how low are PEs going and how low are forecasted earnings going. That will determine where this bear market bottom is. On the chart, you can see our line is drawn at $341. There is no bottom in place yet, and we can see that on the monthly SPY chart shown below. We will draw a blue, vertical line after the bottom is in place. The signal will tell us.
Where Is The Bull Market Signal?
At the bottom of the chart is the trigger signal for a bull or bear market. The red vertical line is the bear market signal. We are waiting for the blue vertical line to appear marking the start of the next bull market, probably sometime in 2023.
On this trigger signal at the bottom of the chart, you can see that this bear market is worse than the last pandemic bear. The signal has broken below the dotted line and is in oversold, deep Supply territory. It can stay oversold for months. We will draw the blue vertical bullish signal when it turns up, with the black line breaking above the red line as it did at the last bottom. We don’t think $364 is the bottom of this bear market.
When Does This Bear Market End?
You can see this bear market has started its 7th month and still no bottoming formation. There is no reversal of the falling signals shown on this chart. There is no buy signal, yet, on this chart.
At the top of the chart is Chaikin Money Flow. I knew Marc Chaikin when he developed this signal. It needs to turn up as it did in the last bear market bottom.
Below money flow is another popular signal, the MACD. It is two signals actually. We need to see the black line breaking above the red line as we saw when the last bear market ended. The bar chart just below this crossover signal is a leading indicator to the crossover Buy signal we are waiting for, and you can see that this leading indicator for the next bull market is still bearish.
Conclusion
This bear market will end when the signals on our monthly chart turn up. They are still pointed down and that is why we don’t think $364 is the bottom. Even the leading indicator signal has not even started improving. The SPY is enjoying a little, technical bounce, reflecting the jobs report and July earnings as expected. That jobs report means that the Fed has to raise interest rates 75 basis points at the end of July. That, along with all the caveats on future earnings forecasts, tells us that this bear market is targeting a test of $341. We don’t think this bear bottoms until October. After July earnings, the SPY will start thinking about the coming recession again, and that doesn’t make for a bull market move. A drop in inflation, an increase in unemployment or an end to the war would potentially change the timeline.
SPY Looking For A Bottom (StockCharts.com)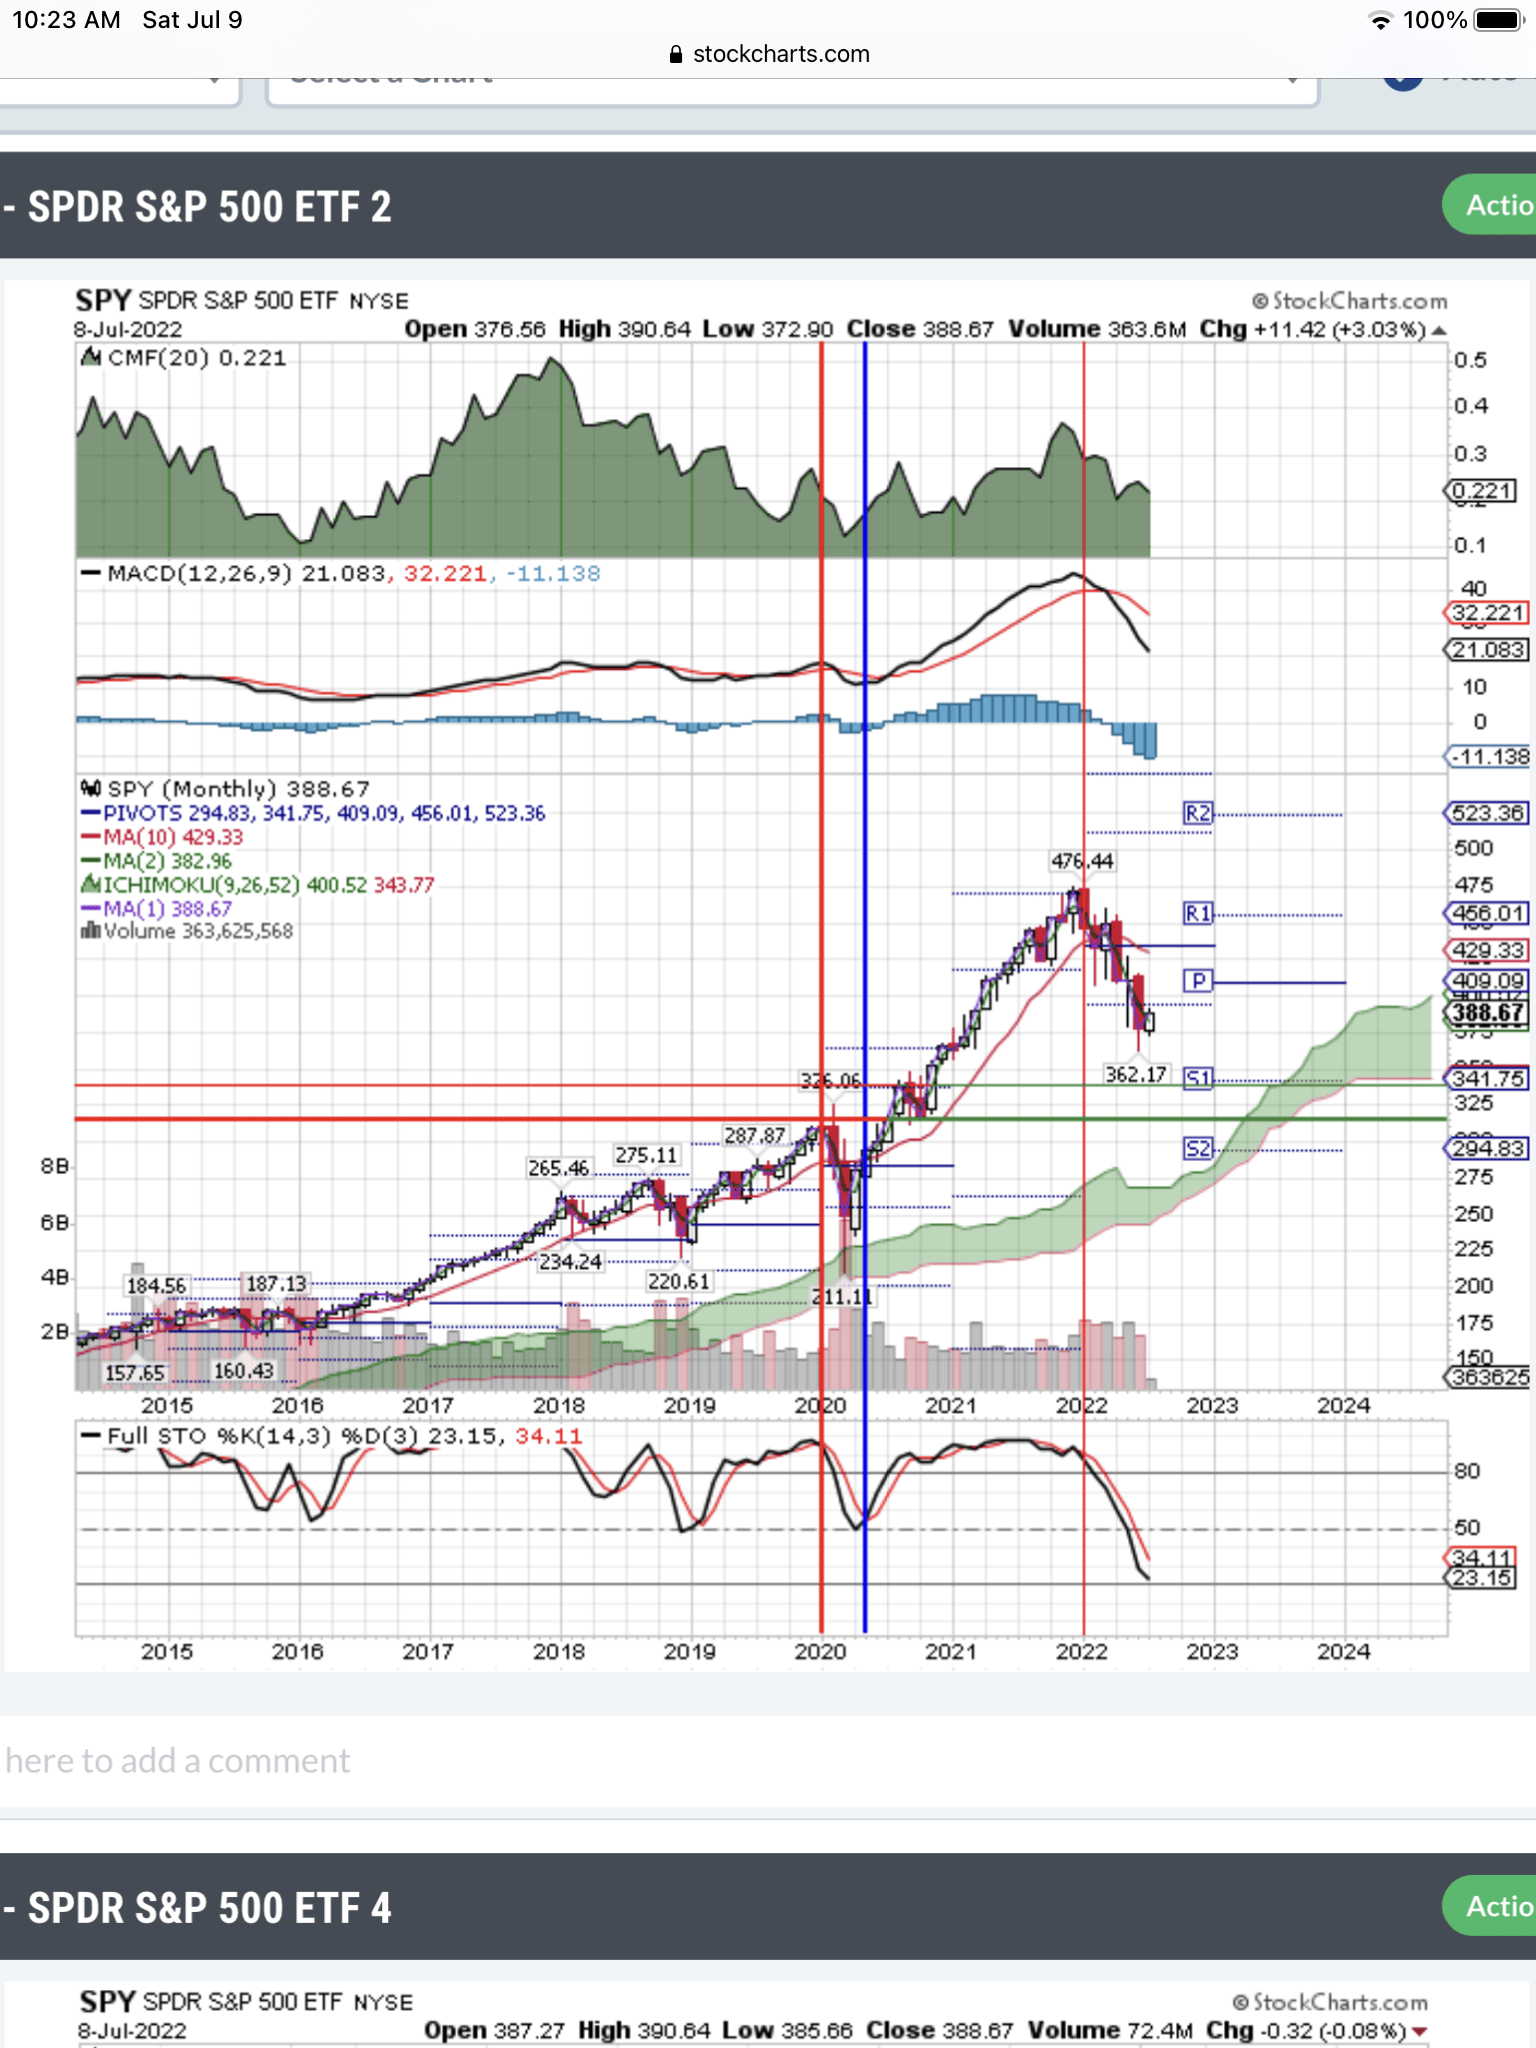
Be the first to comment