

damedeeso
Investment Thesis
This article will take a look at Eaton Vance Tax-Managed Global Diversified Equity Income Fund (NYSE:EXG). I last wrote about EXG at the start of 2021. At the time I had some concern about its distribution coverage, but it looked to be covered after the distribution cut in 2019. My thoughts on the distribution being covered were born out when EXG bumped the distribution up last August. Since the beginning of this year, the NAV has declined, but the fund has been generating enough cash to cover the distribution. At its current price, I think EXG offers a good value and a reasonably covered distribution.
In my series of articles on CEFs, I explain that I look for a CEF that can provide a stable flow of income. I have developed a method of determining whether a specific CEF could provide a reliable stream of income. I developed my method after reading this article.
The basis of my analysis is that my thinking is that how the portfolio of the fund behaves and the income it generates is the determining factor in the reliability of the distribution that is the NAV. It is a mistake to see the fund’s NAV as the sole component of the fund’s value. I think it is more productive to look at a fund’s NAV as the means of generating cash. So while it is bad if the fund is eroding NAV, it is the fund’s ability to generate cash that is the true value.
I look at a specific CEF and apply my method to determine if the fund has been supporting the distribution. If the fund’s NAV has been increasing, it is fairly easy to determine if the fund has been covering its distribution. It gets more complicated when the NAV is declining.
Then based on current holdings and past performance, I try to determine whether or not the fund will be able to support the distribution in the future. You can read an explanation of my method and get links to the other articles in the series (published before March 27, 2022) here.
Eaton Vance Tax-Managed Global Diversified Equity Income Fund
How management handles the portfolio is critical to obtaining the reliable stream of distributions that I want from a CEF. To determine if a fund is covering its dividend, I compare the total NAV return with the yield on NAV. This lets me see if the fund is overpaying the distribution.
So, how did the fund do on a total NAV return basis over the last 12 months?
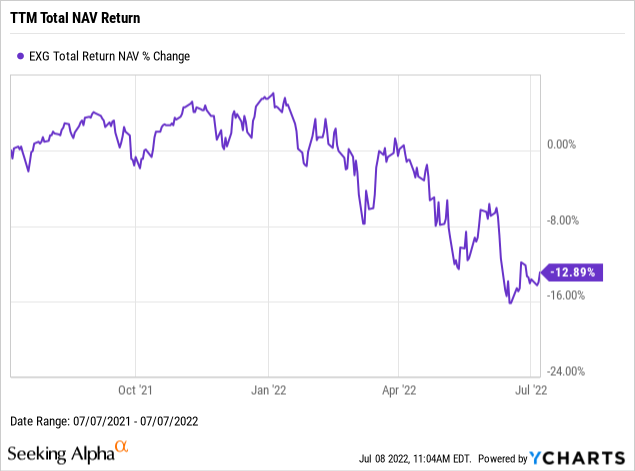
Not so good as it turns out. The total return on NAV was down almost 13%. Looking at the returns over the course of those 12 months, it looks to me like the returns started turning south around the beginning of the year. Much like the rest of the market. So this isn’t necessarily a sign that management is doing anything wrong. Let’s look at how NAV did as our next step.
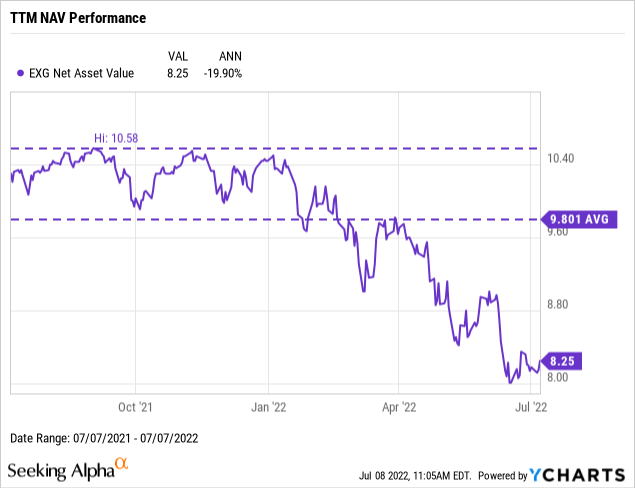
Not surprisingly, NAV also declined. It is down nearly 20%. But what does that mean about distribution coverage? If NAV is increasing, the distribution is covered by the income and gains the fund’s portfolio is generating. If the NAV is declining, the situation is more complex.
EXG Distributions (CEFData.com)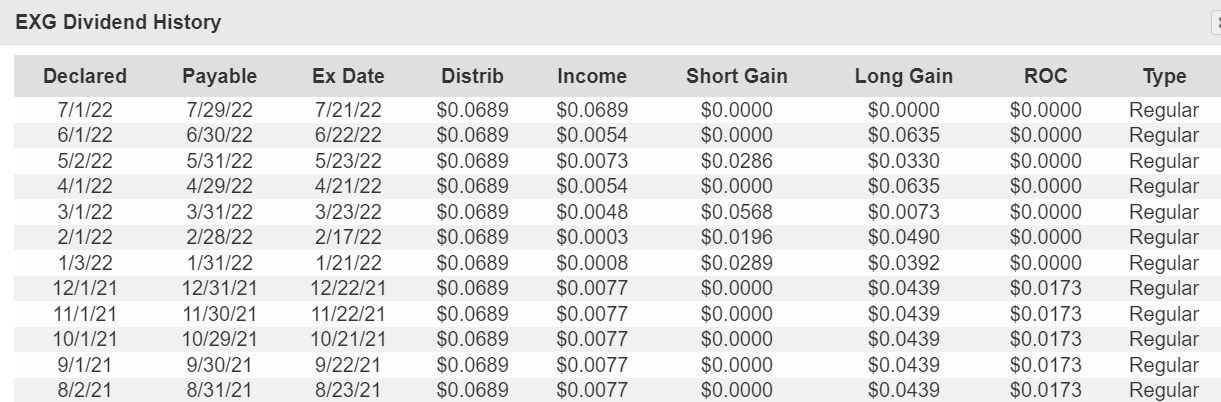
Looking at data from CEFData, we can see the distributions over the last 12 months. Starting with the payment last August, EXG bumped up the monthly distribution from 6.16 cents a month to 6.89 cents a month. While this isn’t a huge increase (it is an increase of 11.8%, so it isn’t as tiny as it seems), it is a sign that management thought they could cover a larger distribution. I see that as a good sign for distribution coverage.
I also note that in the CEFData data, starting with the beginning of this year, the distribution no longer had a ROC component. That indicates to me that the distribution was entirely covered by actual income and net realized gains. Again a good sign for distribution coverage. But this is in 3rd party data which can be less accurate than I like. So what does Eaton Vance say?
EXG Distributions and Sources (Eaton Vance)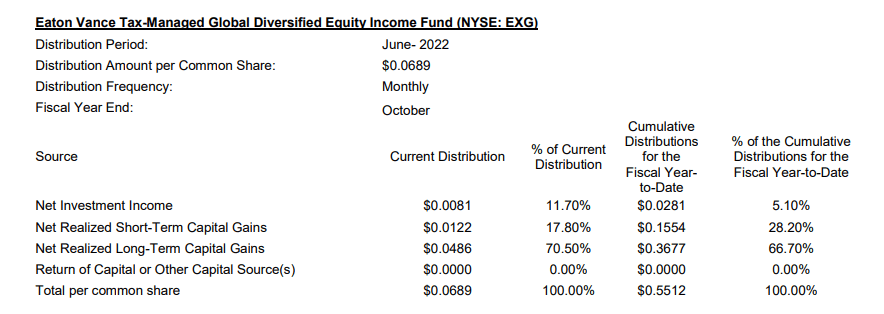
So as of the June payment, the fund is not designating any of the distribution paid this year as ROC. And it has indicated that the distribution has been covered by NII (Net Investment Income) and realized capital gains (both long and short term).
So based on the increasing NAV last year, the lack of ROC so far this year, and the increase in distribution last August, I see the distribution as covered. I don’t say the distribution is well covered because the declining NAV gives me some concern as to how long the fund will be able to cover the distribution.
Long-Term Trends
In any given year, a fund can do exceptionally well or poorly. So I like to look at longer-term trends. Three years seems to be a good balance between getting enough data and getting recent data. So how did EXG do over the last 3 years?
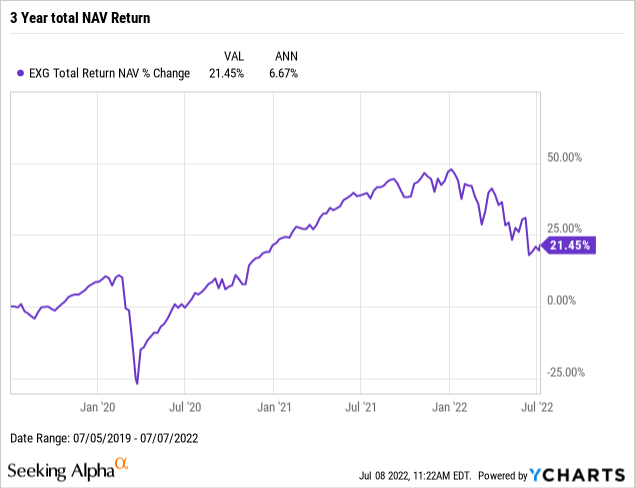
While 6.67% CAGR in total NAV returns is not bad, it isn’t all that high either. I do note however that prior to the hit NAV has taken in 2020, the total return on NAV was running over 16%. Let’s next look at how NAV did during this period.
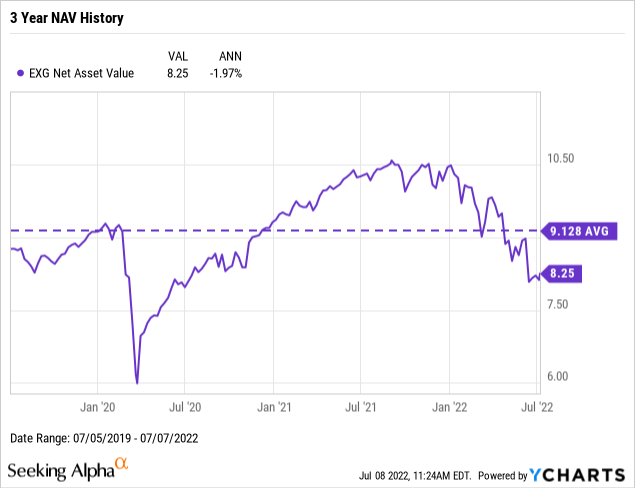
Well, NAV declined, but this was due to the big decline in NAV since January. Over the last 3 years, distribution payments have totaled $2.3052. Using the average NAV of $9.128 produces a total yield on NAV of 25.25% or an average of 8.42% per year. Both of those numbers are less than the total return on NAV (both total and yearly figures).
I have to say that EXG has had weak distribution coverage. While it has covered the distribution YTD, it seems to not leave much room for error in how much it pays out. That has led to distribution cuts in the past. So caution is warranted here.
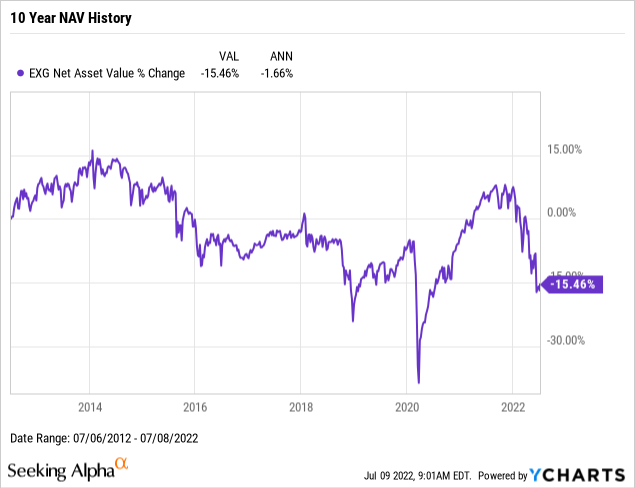
As for NAV performance over the last 10 years, I see more reasons for caution in its slow decline. It very much looks to me like buying only at very attractive valuations will produce the results I want. But let’s take a look at distributions over the long term.
EXG Distribution (CEFData.com)
I like plotting the distribution so that the payment frequency is shown. That way one can see that what looks like a big cut at the start of 2013 was just the change from paying quarterly to paying monthly. But while that takes out one big drop, there is still a history of multiple cuts. And that is only partially offset by the increase last August.
Future Distribution Coverage
As I regularly point out at this point, investing is about what the future will bring. The past is useful only as a guide as to what that future might be. So, what I want to look for is evidence that the most recent distribution coverage will continue. Do I see that? Let’s first look at the fund’s holding and see if we can see any red flags that might indicate it won’t be able to continue to cover the distribution, and for signs it might continue to do so (or even do better).
EXG Portfolio Details (Eaton Vance)
As I wrote before, EXG has a lot of exposure to the FAANG stocks. While they have been lagging a bit recently, that is likely due more to them getting a bit ahead of themselves than any big problems. So I expect share price growth will soon resume. Walt Disney (DIS) has had a bunch of issues of late, including a poor performance from the Buzzlighter movie, but I expect the worst of that is over. While we might not see any significant improvement, I don’t think things will get much worse.
So I don’t see any red flags, and I do see some signs that we could see improved results from the portfolio. I also note that EXG uses covered calls, and as of the end of March, it had written covered calls representing 49% of the nominal value of its portfolio. Unless we see a big resurgence of the market (and EXG’s portfolio) in the 2nd half of the year, those calls should provide some nice cash flow for the fund. I don’t think we are yet at the market bottom, and I don’t expect to see a big run-up in the market. Perhaps the elections in November might change that, but it is hard to say at this point.
So I generally see a good chance that EXG will be able to continue covering its distribution. And that is a good thing. But how good is the current valuation?
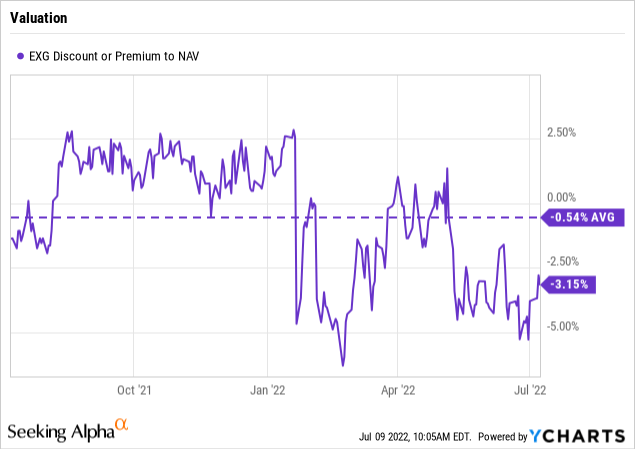
Well, the current discount to NAV is well below the 10-year average. And while it was lower a few weeks ago, it is still very good. So while it is far from a screaming buy, I do think EXG is well worth nibbling on at this time.
Conclusion
EXG has somewhat weaker distribution coverage than I think is ideal. But it is trading at a good valuation and I think a series of small purchases can work well for the income investor.
Be the first to comment