

ayala_studio
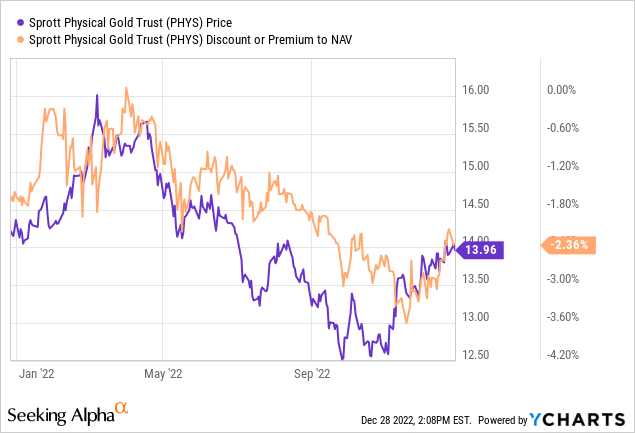
At the tail end of September, I encouraged readers to ‘back up the truck’ for Sprott Physical Gold Trust (NYSEARCA:PHYS). Since that note, PHYS has cruised higher from the $12.91 share price at time of publishing to over $14 as of 12/27 close. After a 9% move up in 3 months, PHYS has been a nice expression of a long Gold wager despite maintaining a discount to NAV that is still greater than 2.3%:
Part of the late-September article acknowledged Gold’s performance difference when measuring the metal in British pounds rather than US dollars:
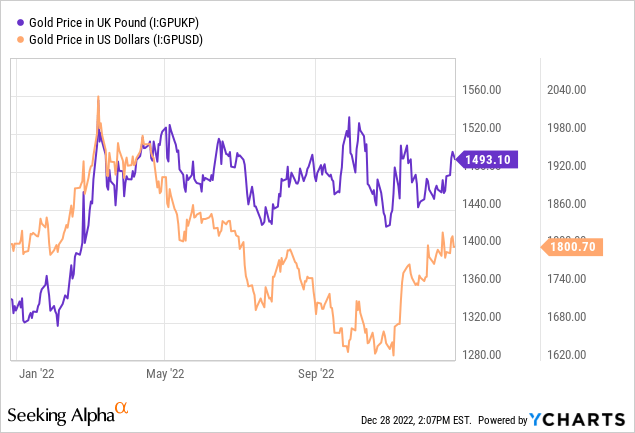
The implication at the time being the metal’s price action was actually strong when measured in foreign currencies. Since then, Gold is roughly flat when priced in pounds but up 9% in dollars. This speaks to the relative weakness in the dollar in the last three months of 2022.
While I’m still incredibly bullish Gold and by extension PHYS for calendar year 2023, I do think it’s possible that we’ll see some weakness in both the metal and the trust shares to open the year. Unlike my previous PHYS article that touched on premiums for physical, discount to NAV, and foreign currency pricing difference, the goal of this article is to simply serve as an update to my thinking purely from a short term technical perspective. From now through the end of this article, all references to Gold prices will be denominated in US dollars.
Gold Charts
After a 22% selloff in Gold from March of this year through September, the metal has found some footing after defending support at $1,615 on three different occasions between late September and early November.
Gold Weekly Chart (Investing.com)
There are three main things I’m trying to show with this weekly Gold spot chart; the support at $1,615 is highlighted with the blue arrow, the successful trend breakout back test is highlighted by the purple arrow, and the general weakness against the 50-week moving average that we’ve experienced for the last month is highlighted by the red arrow. This week marks the fifth consecutive week Gold has tested the 50-week MA and if it closes underneath $1,803 it will be the fifth consecutive week Gold fails to close above it. This recent weakness is corroborated by a series of bearish divergences on the daily chart.
Gold Daily Chart (Investing.com)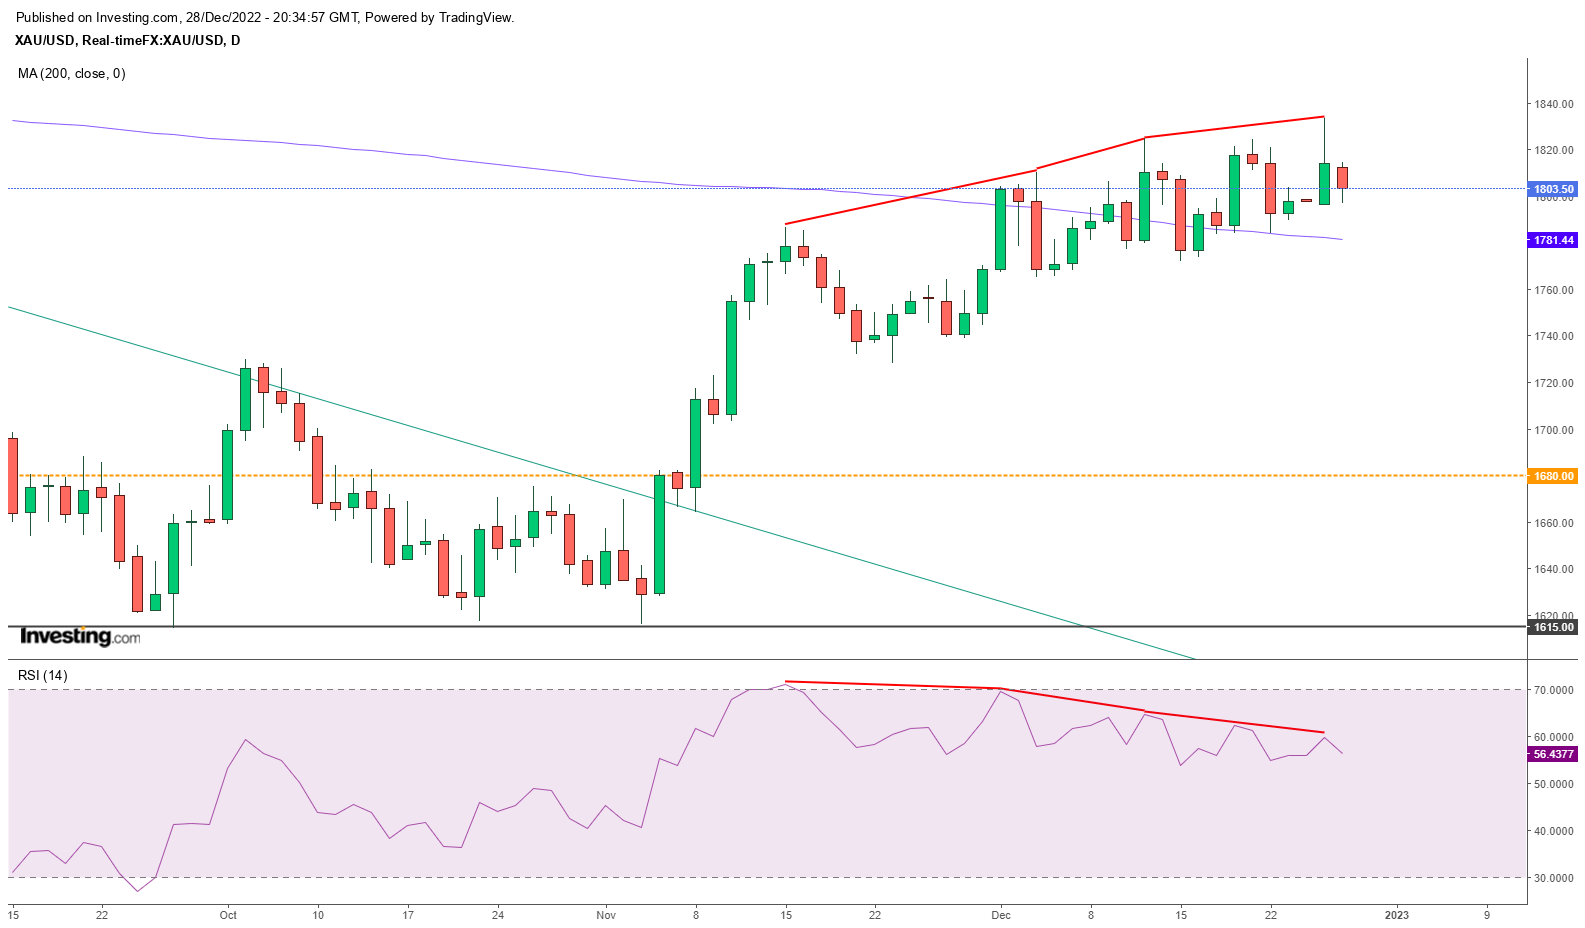
The red lines above show bearish RSI divergences in Gold in the beginning of December, the middle of December, and again on Tuesday. These divergences are evident through higher price highs coupled with lower RSI highs – this is generally a sign of buyer exhaustion and an indication that bears are about to take control back for the time being.
Projecting PHYS
As would be expected, we see some similar RSI divergences on the PHYS daily chart as well:
PHYS Daily Chart (Investing.com)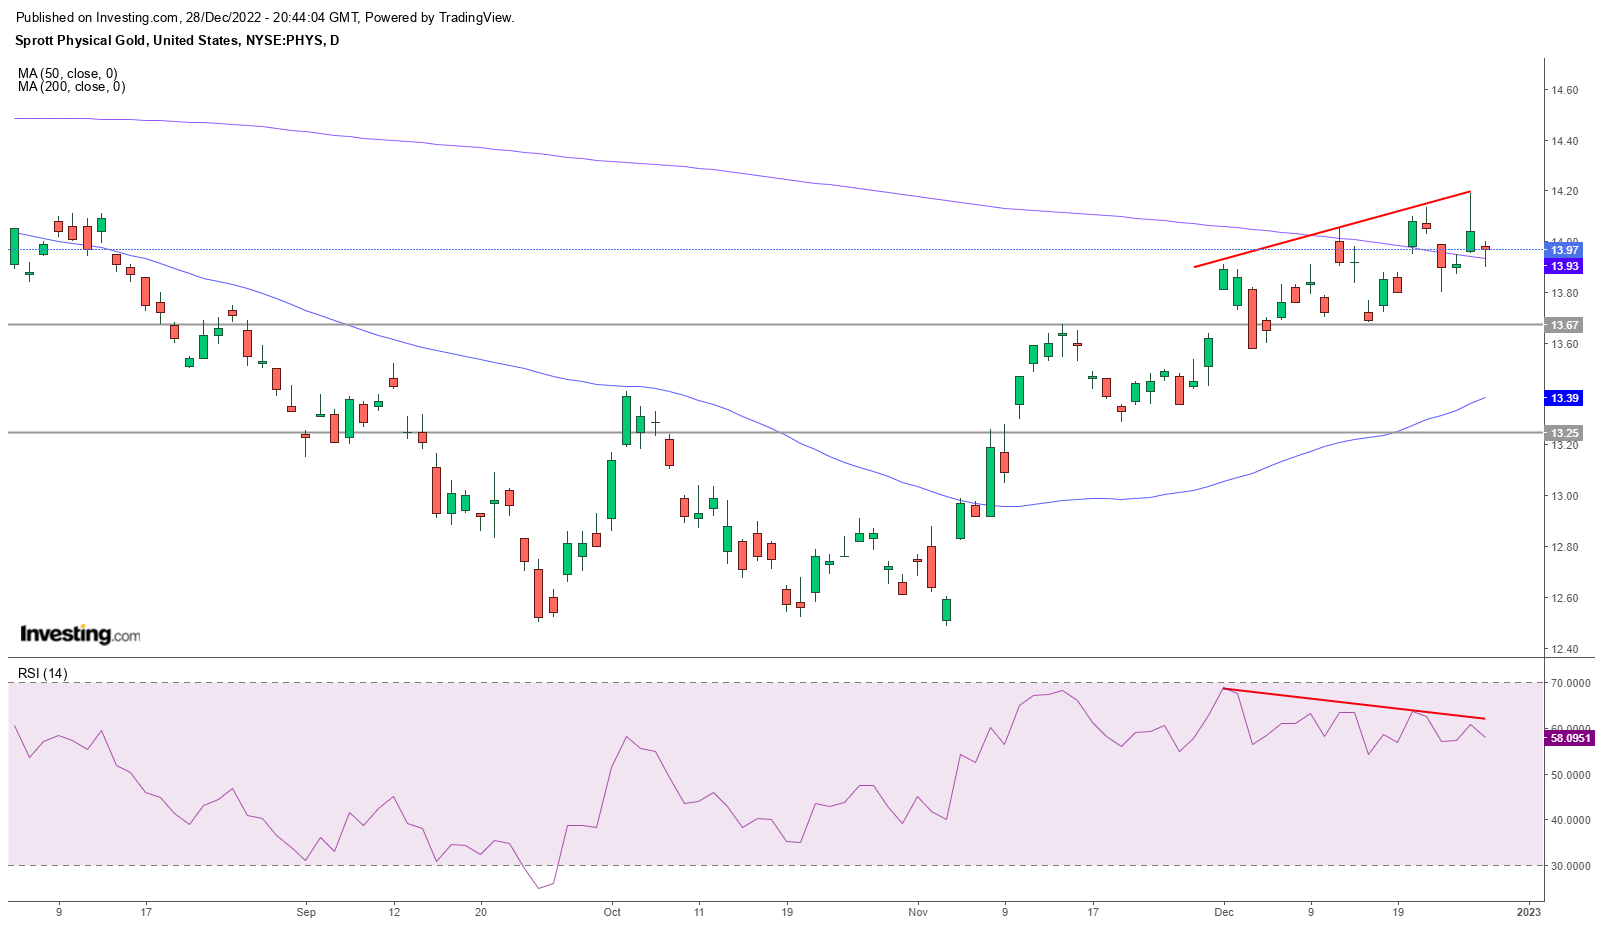
PHYS is actually a little bit closer to giving up the 200 day moving average than Gold is and has several levels below the 200 day that I think would potentially be areas for buyer support based purely on the PHYS chart:
- $13.67 – the November high before the first RSI divergence
- 50 day moving average – currently $13.39
- $13.25 – July support turned October resistance
Given the amount of Gold that each share of PHYS represents, we can project what the net asset value of PHYS shares will be based on what I view to be key levels in the price of the underlying asset:
| PHYS Shares | 397,346,037 |
| Gold ounces in trust | 3,150,155 |
| Gold ounces per share | 0.007927988974 |
Source: Sprott
If Gold does trend down to the $1,730 level, something that I view as possible, PHYS shares could be purchased for $13.44 if they maintain a 2% discount to NAV.
| Gold Price | PHYS NAV | 2% Discount |
| $1,800 | $14.27 | $13.98 |
| $1,730 | $13.72 | $13.44 |
| $1,680 | $13.32 | $13.05 |
That would likely put PHYS closer to the 50 day MA depending on how long it takes Gold to pull back to the $1,730 support level. I believe we will see these prices and probably fairly quickly.
Risks
Of course, none of this actually has to happen and technical analysis is probably more a gauge of trader sentiment than anything else. In my view, the action is telling us a pullback is coming. This would be an opportunity to buy more for long term bulls, of which I am. But there are certainly risks to consider. A dip can quickly turn into a bigger problem if supports don’t hold. So a viable fundamental setup is also something that must be considered.
As I mentioned in my recent technical update to PSLV, Sprott assets are vaulted in Canada; a country where the quality of governance over the last several years can certainly be debated – as such, jurisdiction risk is now also something to be aware of as the Canadian government could opt for confiscation of sound money assets if global fiat issues worsen and inflation continues to be a problem.
Summary
In 1968, Marvin Gaye and Tammi Terrell released the hit “Ain’t Nothing Like The Real Thing.” Certainly not a song about currency but an important reminder that when it comes to precious metals, unless you’re holding it in your hand, you’re holding an IOU. The real thing is still the best way to own precious metal in my opinion but that doesn’t mean there aren’t solid options that are more liquid for investors. I think Sprott shares are the best way to buy Gold in a brokerage account.
A little over three years after Marvin Gaye and Tammi Terrell released that hit song, President Nixon essentially ended what was left of the Gold Standard when he halted US dollar convertibility to Gold. It has been over 50 years since the Bretton Woods system ended and we’re probably going to find out very soon if prosperity can indeed be printed. Personally, I think Gold will move much higher as fiat continues to lose purchasing power and I believe PHYS is one of the best ways to express that idea in an investment account. But the next leg up probably comes after a dip; be ready for it.
Be the first to comment