

welcomeinside
From Neutral to Bullish
Last week, I explained my decision to cover the S&P 500 (NYSEARCA:SPY) short position and move to a neutral position. Basically, I saw the peak in Fed hawkishness and the end of the liquidity-based selloff. Upon further analysis and observation, I bought the dip, with expectations of a sizable bounce.
The contrarian trade
SPY is down by nearly 24% YTD, and I bought the most recent dip. This is definitely a contrarian trade. The SPY downtrend is firmly in place and the leveraged traders (hedge funds) are heavily short S&P 500 Futures (SPX) – obviously expecting the downtrend to continue.
The contrarian trade could be appropriate in a situation where the fear and/or forced liquidations cause an asset to become deeply undervalued. This is not the case now – S&P 500 is still mildly expensive with the PE ratio at 18 and the forward PE ratio at 16.
The contrarian trade could also be appropriate if you are able to correctly identify the trigger (cause) behind the selloff – and correctly predict the trigger fadeout and the turnaround – this is the theme behind my contrarian bullish trade on SPY.
The liquidity-based selloff is near the end due to the peak Fed hawkishness
Long story short, the bear market in SPY in 2022 has been caused by the increasingly hawkish monetary policy expectations since January 1st, 2022. We thought that we possibly reached the peak Fed hawkishness on June 16th (which caused the temporary bottom in SPY), but the negative surprise in the CPI inflation over the summer caused the Fed to turn more hawkish since Aug 26th, which caused another leg lower in SPY and the revisit to the previous lows, and some more.
However, as I explained in my previous article, we are currently at the peak Fed hawkishness, and the Fed-induced liquidity-based selloff (the Phase 1 of the bear market) is likely near the end. Furthermore, the probability of an imminent recessionary selloff (the Phase 2 of the bear market) has decreased as the 10Y-3mo spread is still positive and recently widened – no recession occurred with the positive 10y-3mo spread. More importantly, the credit risk (the Phase 3 of the bear market) is actually decreasing with spreads between the BBB bonds and 10Y Treasury yields decreasing towards the 2% level – which is very low.
Thus, as the Phase 1 selloff eases, without the evidence of an imminent recession (defined as a very sharp increase in unemployment), or the spike in the credit risk, SPY is due for a sizable bounce.
The core CPI inflation prediction
However, in this article I need to dig deeper into my analysis to justify the “peak Fed” hypothesis, which requires the verified peak and a sizable decrease in the core CPI inflation.
I reviewed the San Francisco Fed research “Will Rising Rents Push Up Future Inflation?” from February 2022, and found the following:
Rising rents account for a significant portion of recent inflation. Estimates of how rent inflation typically responds to two leading indicators-current asking rents and current house prices-can help forecast the path of overall inflation for the next two years.
The shelter costs are the key component of the core CPI, and the SF Fed finds that asking rents and current house prices are leading indicators of the CPI. The paper is specifically referencing the Zillow asking rent index and the Zillow current home price index as the leading indicators of the future core CPI. Both of these indices have sharply spiked in 2021, reached the peak, but unexpectedly rose again in early 2022. More importantly, both of these indices have sharply decreased recently, and now back to the “normal” levels.
Here is the chart of the growth in the current home prices (Zillow index). Note, some other data is already showing a negative growth. Slow or negative growth in current home prices is expected to slow the growth in rents (based on the SF Fed’s research).
Global Academic View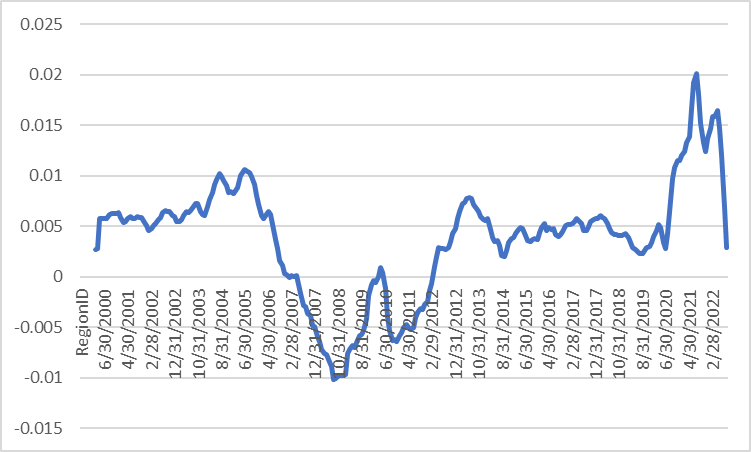
Here is the chart of the growth in the Zillow rent ask prices. Asking rents are still growing near the top of the normal range, but the slowing home prices should cause the rents to further decrease (based on the SF Fed research).
Global Academic View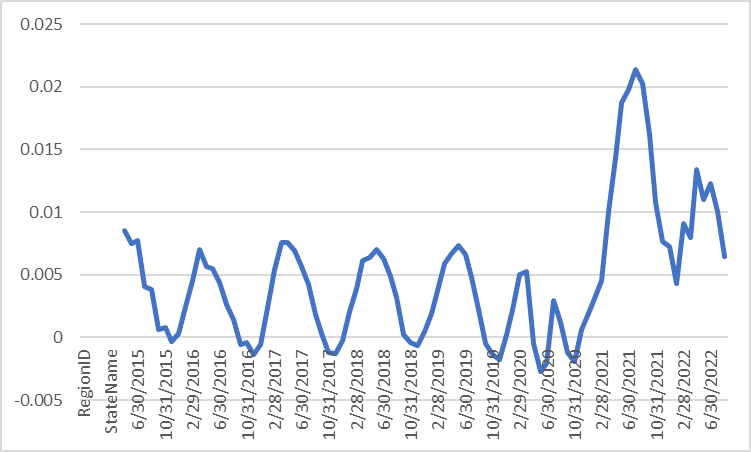
Thus, based on the Zillow current home price index and the Zillow asking rent index, the shelter prices will sharply decrease in the near future, which will cause a much lower core CPI inflation. This supports the peak Fed hawkishness hypothesis and the expectations of a bounce in SPY.
What did Powell say about shelter prices?
The Fed Chair Powell stated at the press conference after the September FOMC meeting:
So the deceleration in housing prices that we’re seeing should help bring sort of prices more closely in line with rents and other housing market fundamentals and that’s a good thing. For the longer term what we need is supply and demand to get better aligned so that housing prices go up at a reasonable level, at a reasonable pace, and that people can afford houses again, and I think we, so we probably in the housing market have to go through a correction to get back to that place.
I think that shelter inflation is going to remain high for some time. We’re looking for it to come down, but it’s not exactly clear when that will happen. So, it may take some time, so I think hope for the best, plan for the worst. So I think on shelter inflation you’ve just got to assume that it’s going to remain pretty high for a while.
Thus, the Powell statement supports the research by the San Francisco Fed – the housing prices “must go through a correction”. The Zillow indices are painting a positive picture on shelter prices, and thus the core CPI – the Fed will have to acknowledge this when they signal the slowing pace of interest rate hikes and the eventual end of the hiking cycle. This supports the contrarian bullish bet on SPY.
What are the risks?
This a contrarian trade – and buying in a downtrend could be like “catching a falling knife”. These are the key risks:
- Rising US Dollar: the most recent selloff in SPY has been caused by the sharply falling British Pound. The broad USD strength can cause a financial crisis in the financially weak geographical areas, like the war-exposed Europe and the Brexit-affected UK. However, the rising USD is tied to the rising US interest rates, and the peak Fed hawkishness hypothesis is likely to at least slow the rise in USD.
- Geopolitical: there is a war in Europe and the probability of the use of nuclear weapon is higher than zero for sure.
- Much deeper US recession: The market is probably pricing an increase in the unemployment rate to 4.4%, but not to 7-8%, so any indication of the crashing economy will cause the Phase 2 selloff of the bear market.
- Trend followers: falling prices invite more short selling, which could push the prices much lower. However, trend-following short sellers can also contribute to the rising prices if they are forced to cover. In fact, the leveraged traders (known for the trend-following strategies) had a near record short position in S&P 500 Futures in mid-August (-600K contracts net short). They still have a very large short position (-350K net short), but have been covering their shorts. The continuation of short covering adds to the contrarian bullish thesis.
- InflationNowcast is predicting a 6.64% core CPI for September. If correct, the market reaction could be negative.
Specific SPY sector analysis
All SPY sectors are down YTD except the energy sector (XLE). The potential bounce is likely to be initially led by the most oversold sectors (such as communications XLC and technology XLK) due to short covering. Energy actually could lag, since we are entering a significant economic slowdown. Real estate is oversold, but the reality of higher interest rates is not changing anytime soon.
SelectSectorSPDR
Some charts for the end
Here is the chart of net positions of leveraged traders (yellow line is the net position). Hedge funds are net short.
CME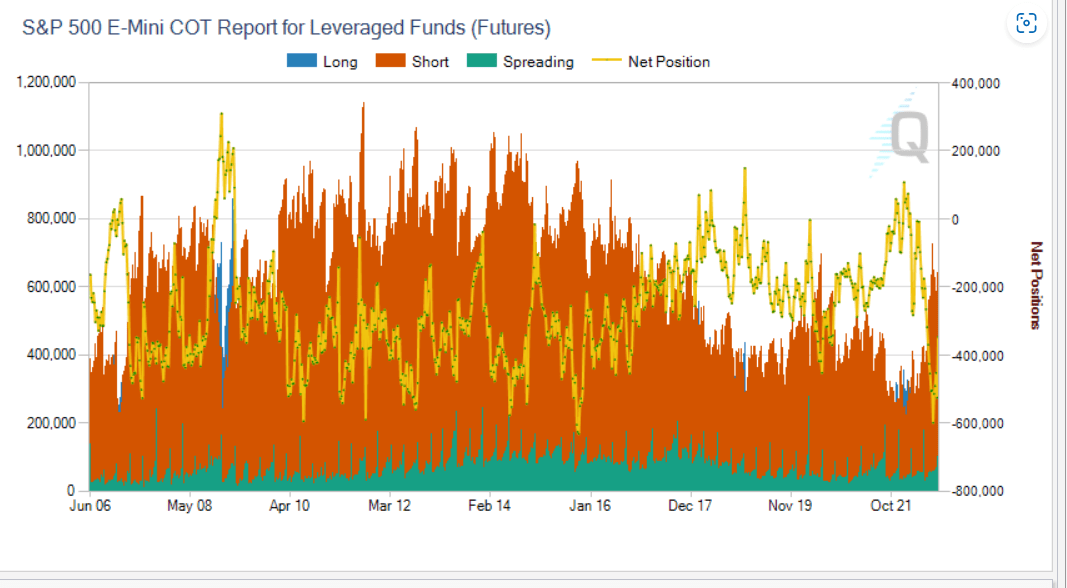
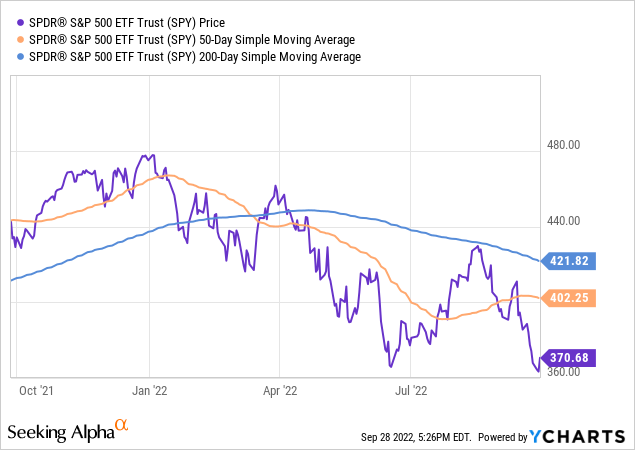
Here is a well-defined downtrend in SPY. Long SPY is a contrarian trade.
Here is the chart of the 10y-3mo yield curve spread (positive and widening), which indicates the probability of a recession within next 12 months. No recession occurred with a positive 10-3mo spread.
FRED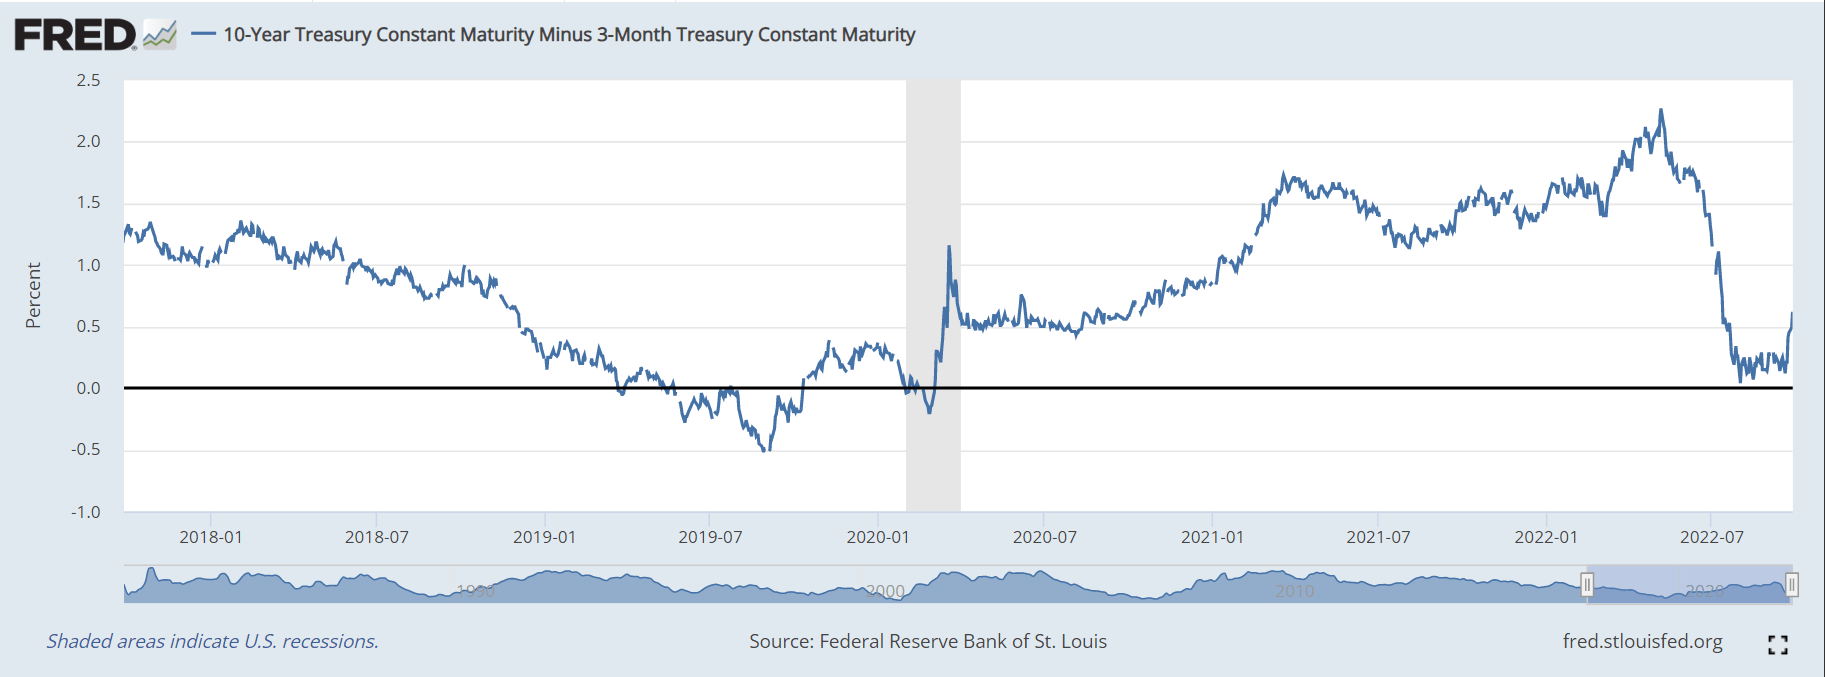
Here is the chart of the BBB-10y spread, which indicates the credit risk. The spread actually decreased, and it’s very low.
FRED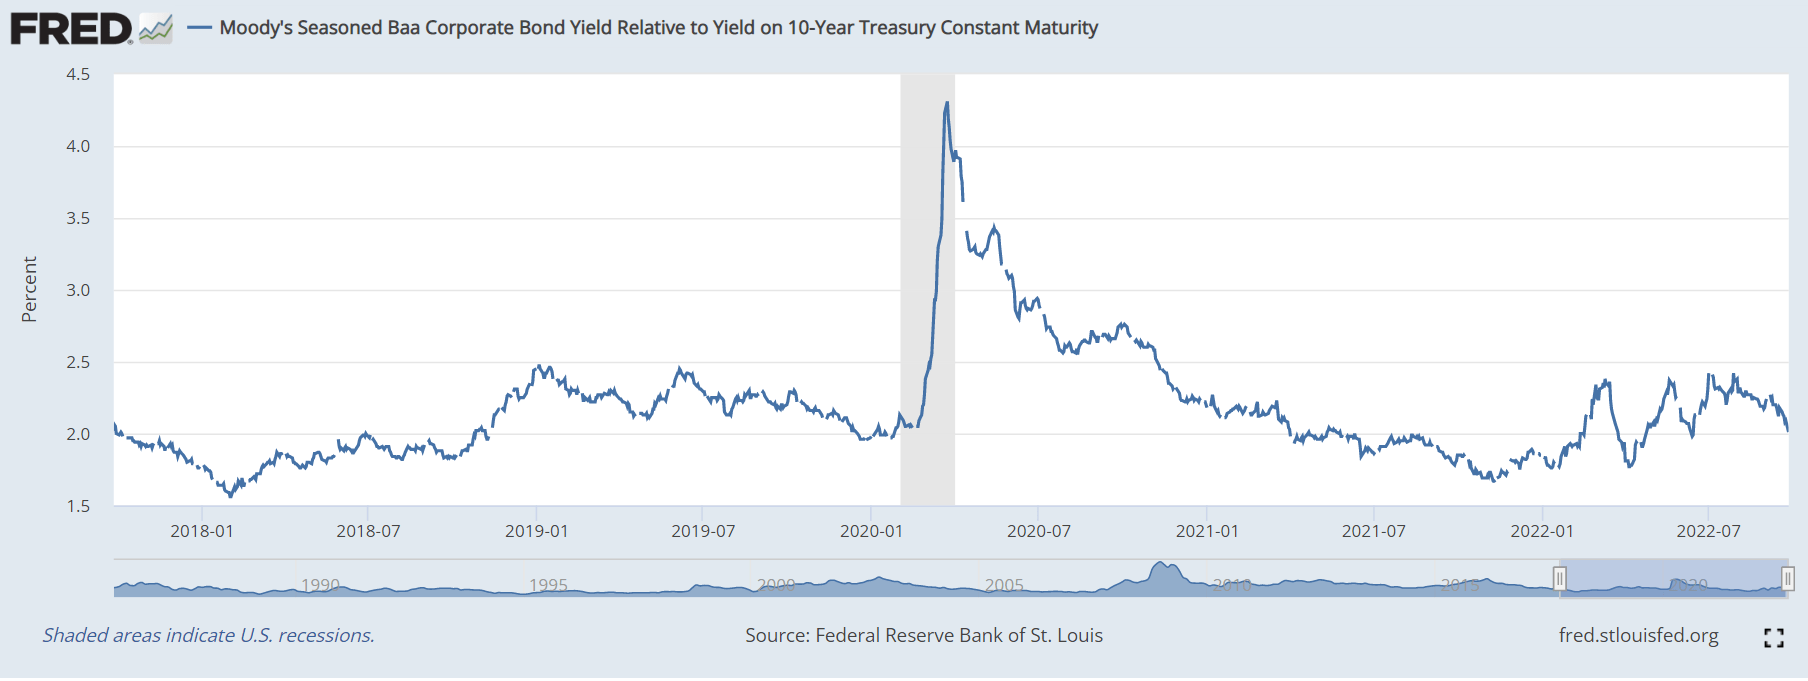
Implications
Given the large net short positions in SPX and a well-defined downtrend in SPY, with the widely expected economic slowdown and possibly a recession, long SPY is a contrarian trade. As a result, it’s extra risky and requires prudent risk management (stop loss order), but also the willingness to take profit.
Editor’s Note: This article was submitted as part of Seeking Alpha’s best contrarian investment competition which runs through October 10. With cash prizes and a chance to chat with the CEO, this competition – open to all contributors – is not one you want to miss. Click here to find out more and submit your article today!
Be the first to comment