

Viktor_Gladkov
It’s raining blue-chip bargains everywhere you look! You can’t swing a dead cat without hitting a world-beater blue-chip that’s getting crushed by the relentless increase in interest rates.
Ycharts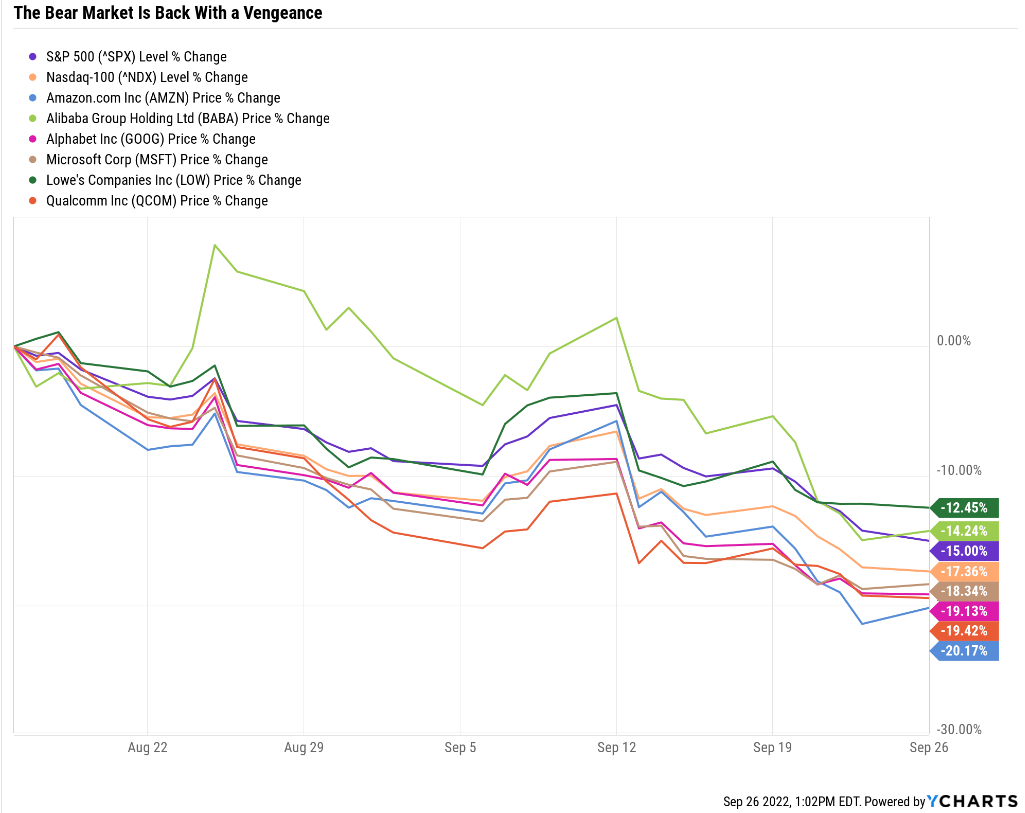
Since its August 16th high, the market is down 15%, the Nasdaq 17%, and many popular growth stocks are down 20% or more. Hope for a Fed pivot? My, oh, my, what a difference just five weeks makes.
CME Group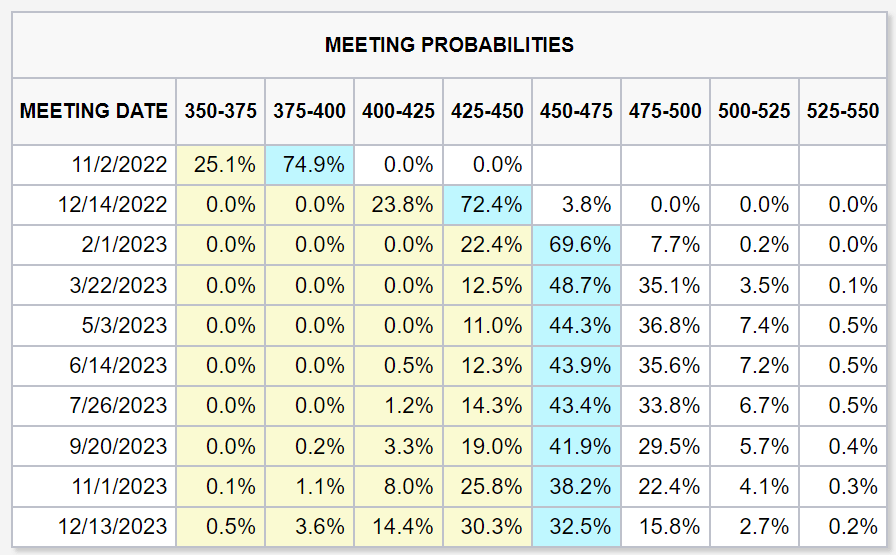
The bond market is now pricing in another mega hike in November, a 50 basis point increase in December, and 25 in February and March. That’s a 4.75% peak rate that the Fed says it doesn’t plan to start cutting until potentially October…of 2024. How much lower could the market fall?
According to Goldman Sachs, Bank of America, Morgan Stanley, Bridgewater, and Carl Icahn, the market will likely bottom at -35% to -40% from record highs if we get a recession in 2023. How much further is that from our -24% levels now?
S&P Correction Watch
| All-Time High | 4,818.62 |
| Current | $3,656.41 |
| Distance From High | 24.12% |
| Pullback Level | 4577.69 |
| Correction Level | 4336.76 |
| -15% Correction Level (Historically Average Correction Bottom) | 4095.83 |
| Bear Market Level (-20%) | 3854.90 |
| -25% Bear Market | 3613.97 |
| -30% Bear Market | 3373.03 |
| -35% Bear Market | 3132.10 |
| -40% Bear Market | 2891.17 |
| Distance To Pullback | -19.1% |
| Distance To Correction | -18.6% |
| Distance To 15% Correction | -12.0% |
| Distance To Bear Market | -5.43% |
| Distance To -25% Bear Market | 1.2% |
| Distance To -30% Bear Market | 7.8% |
| Distance To -35% Bear Market (Average Historical Recessionary Bear Market Low -36%) | 14.3% |
| Distance To -40% Bear Market | 20.9% |
| Decline To Historical Fair Value | -9.1% |
(Source: Dividend Kings S&P 500 Valuation & Total Return Tool)
Higher for longer is the order of the day, and that’s a good thing. Stocks potentially falling another 14% to 21% is also a good thing.
I know what you’re thinking. “Are you high?! How can this possibly be a good thing?!”
According to Societe Generale and UBS, if the Fed gives investors what they want right now, an early pivot and rate cuts, here’s what might be coming in the next decade.
This Is What Stagflation Hell Looks Like:
- inflation doesn’t subside
- inflation expectations start rising
- a decade of spiraling inflation
- several severe recessions
- double-digit unemployment
- much higher interest rates for 10 years
- stocks bottom in 2 to 3 years…at -48% to -53%
- as much as 37% lower than current levels
- a lost decade for the S&P 500
Do you still want the Fed to pivot? Or do you want it to finish the job and kill inflation now? Do you want six to 12 months of pain followed by a 4X to 5X decade-long gain in stocks? Or would you prefer a lost decade?
Do you know the last time the Fed pivoted early and gave investors what they thought they wanted?
Fed Chairman Arthur Burns in 1973 lost his nerve and started cutting rates early, before inflation was defeated:
- we ended up with a decade of stagflation hell
- two severe recessions
- 11% unemployment
- a 54% stock market crash
- the Dow Jones Industrial Average was flat for 16 years
The only thing worse than the Fed pivoting is the Fed not finishing the job right now.
OK, so that’s why higher rates are good for all of us in the long-term. And, of course, the next six to 12 months (how long Morgan Stanley things it will take to bottom) could be a golden age of blue-chip bargain hunting.
And that brings me to today’s topic, a Dividend Kings’ member request for an update on Alibaba Group Holding Limited (NYSE:BABA).
What do current and potential investors in BABA want to know? Three things mainly.
- What are BABA’s growth prospects in the future?
- Is BABA a good deal today? Should I buy it?
- What kind of returns can I realistically make?
Let’s answer those questions, but then answer the 4th and most important question of all?
4. What superior alternatives to BABA can I buy that are likely to earn me higher returns with less risk?
Question One: What Are Alibaba’s Growth Prospects Today?
Last I updated BABA; its growth outlook had fallen to 8.4%. That’s a lot of fundamental risks to take on for a non-dividend growth stock without the growth.
FactSet Research Terminal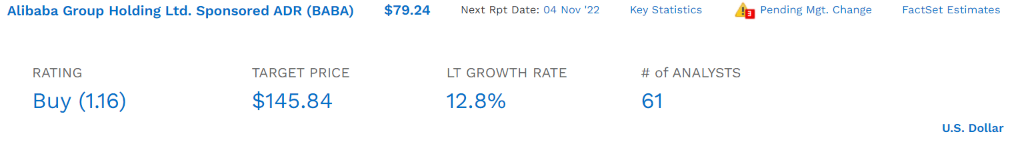
The good news is that BABA’s growth outlook has improved by about 50% in the last few months to nearly 13% CAGR. It’s once more a growth stock.
In fact, BABA’s margins are once more expected to start growing again in the coming years.
Alibaba Profit Margin Consensus Forecast
| Year | FCF Margin | EBITDA Margin | EBIT (Operating) Margin | Net Margin | Return On Capital Expansion |
Return On Capital Forecast |
| 2021 | 15.3% | 20.5% | 9.1% | 10.3% | 2.20 | |
| 2022 | 9.5% | 18.1% | 9.9% | 9.1% | TTM ROC | 40.91% |
| 2023 | 9.3% | 18.5% | 10.9% | 10.5% | Latest ROC | 54.66% |
| 2024 | 9.9% | 19.0% | 12.1% | 11.0% | 2027 ROC | 89.85% |
| 2025 | 14.6% | 20.2% | 13.8% | 13.4% | 2027 ROC | 120.05% |
| 2026 | NA | 25.9% | 18.8% | 16.3% | Average | 104.95% |
| 2027 | NA | 29.0% | 21.8% | 18.3% | Industry Median | 10.58% |
| 2028 | NA | NA | NA | NA | BABA/Industry Median | 9.92 |
| Annualized Growth 2022-2027 | -1.10% | 5.95% | 15.58% | 10.00% | Vs. S&P | 7.19 |
(Source: FactSet Research Terminal)
BABA’s Free cash flow margins aren’t expected to improve much due to high growth spending. But it’s other margins are expected to improve at an impressive rate.
And its return on capital, annual pre-tax profit/the cost of running the business are expected to more than double in the next few years, to 105%. That’s 10X more than its industry peers and over 7X that of the S&P 500.
Alibaba Medium-Term Growth Consensus Forecast
| Year | Sales | Free Cash Flow | EBITDA | EBIT (Operating Income) | Net Income |
| 2021 | $122,778 | $18,726 | $25,208 | $11,212 | $12,669 |
| 2022 | $127,647 | $12,183 | $23,151 | $12,653 | $11,670 |
| 2023 | $138,519 | $12,816 | $25,571 | $15,133 | $14,565 |
| 2024 | $155,150 | $15,435 | $29,442 | $18,763 | $17,136 |
| 2025 | $170,768 | $24,914 | $34,449 | $23,604 | $22,871 |
| 2026 | $177,928 | NA | $46,051 | $33,492 | $28,914 |
| 2027 | $188,949 | NA | $54,875 | $41,137 | $34,540 |
| Annualized Growth 2021-2027 | 7.45% | 7.40% | 13.84% | 24.19% | 18.19% |
| Cumulative 2022-2025 | $592,084 | $65,348 | $112,613 | $70,153 | $66,242 |
(Source: FactSet Research Terminal)
As a result, modest 7% to 8% sales growth is expected to translate into 18% growth in net income and 24% growth in operating income.
Mind you, the days of BABA growing at its former 30% to 55% rates are likely done for good, thanks to stricter regulations and much higher compliance costs.
- including “voluntary” charitable contributions that aren’t really voluntary
So that brings us to the next question, what is BABA worth today with a 50% better long-term growth outlook? And after a 15% decline in the last month, is it potentially worth buying today?
Question Two: Is Alibaba A Good Deal Today?
| Metric | Historical Fair Value Multiples (6-Years) | 2021 | 2022 | 2023 | 2024 | 2025 |
12-Month Forward Fair Value |
| Earnings | 23.46 | $196.59 | $169.15 | $180.17 | $203.63 | $249.15 | |
| Average | $196.59 | $169.15 | $180.17 | $203.63 | $249.15 | $177.63 | |
| Current Price | $79.03 | ||||||
|
Discount To Fair Value |
59.80% | 53.28% | 56.14% | 61.19% | 68.28% | 55.51% | |
| Upside To Fair Value | 148.76% | 114.03% | 127.98% | 157.67% | 215.25% | 124.76% | |
| 2022 P/E | 2023 P/E | 2022 Weighted EPS | 2023 Weighted EPS | 12-Month Forward OCF | 12-Month Average Fair Value Forward P/E |
Current Forward P/E |
|
| $7.21 | $7.68 | $1.66 | $5.91 | $7.57 | 23.5 | 10.4 |
(Source: DK Research Terminal, FAST Graphs)
BABA growing at the approximate rate analysts expect in the future is worth about 23.5X earnings, and today it trades at just 10.4X earnings.
- 7.3X cash-adjusted earnings
This is a 56% historical discount and a speculative anti-bubble blue-chip valuation.
- BABA is pricing in approximately -2.4% CAGR growth
|
Analyst Median 12-Month Price Target |
Morningstar Fair Value Estimate |
| $145.84 (12.4 P/E) | $179.00 (23.6 P/E) |
|
Discount To Price Target (Not A Fair Value Estimate) |
Discount To Fair Value |
| 45.84% | 55.88% |
|
Upside To Price Target |
Upside To Fair Value |
| 84.65% | 126.64% |
(Source: FactSet Research, Morningstar)
Analysts expect BABA to be trading at 12.4X earnings in 12 months and deliver a potential 85% gain.
Morningstar’s discounted cash flow model agrees with my model that BABA is worth about 24X earnings and is 56% undervalued.
Ok, BABA is unquestionably cheap, at least based on consensus estimates (which it’s been missing for over a year).
But given BABA’s higher risk profile than most growth tech stocks, is it a good buy on a risk-adjusted basis? Is the margin of safety high enough to compensate for the very high-risk profile discussed in detail in this article?
| Rating | Margin Of Safety For High Risk Highly Speculative 9/13 Above-Average Quality Companies | 2022 Fair Value Price | 2023 Fair Value Price |
12-Month Forward Fair Value |
| Potentially Reasonable Buy | 0% | $169.15 | $180.17 | $177.63 |
| Potentially Good Buy | 35% | $109.95 | $117.11 | $115.46 |
| Potentially Strong Buy | 45% | $93.03 | $99.10 | $97.70 |
| Potentially Very Strong Highly Speculative Buy | 55% | $49.48 | $81.08 | $79.93 |
| Potentially Ultra-Value Buy | 65% | $59.20 | $63.06 | $62.17 |
| Currently | $78.98 | 53.31% | 56.16% | 55.54% |
| Upside To Fair Value (Not Including Dividends) | 114.16% | 128.12% | 124.90% |
(Source: DK Research Terminal)
Alibaba is a high-risk, highly speculative growth stock with a 1% OR LESS max risk cap recommendation.
It’s risk profile is so extreme that it takes a 35% margin of safety for it to be a potentially highly speculative good buy. But a 56% margin does make it a POTENTIALLY highly speculative, very strong buy IF, and only if you’re comfortable with its complex and extreme risk profile.
- including regulatory risk
- and a high degree of uncertainty surrounding its long-term growth prospects
What does a 56% margin of safety potentially mean for short and long-term return potential? Some very impressive potential returns.
Question Three: What Kind Of Returns Can I Expect From Alibaba In The Future?
Alibaba 2025 Consensus Return Potential
(Source: FAST Graphs, FactSet)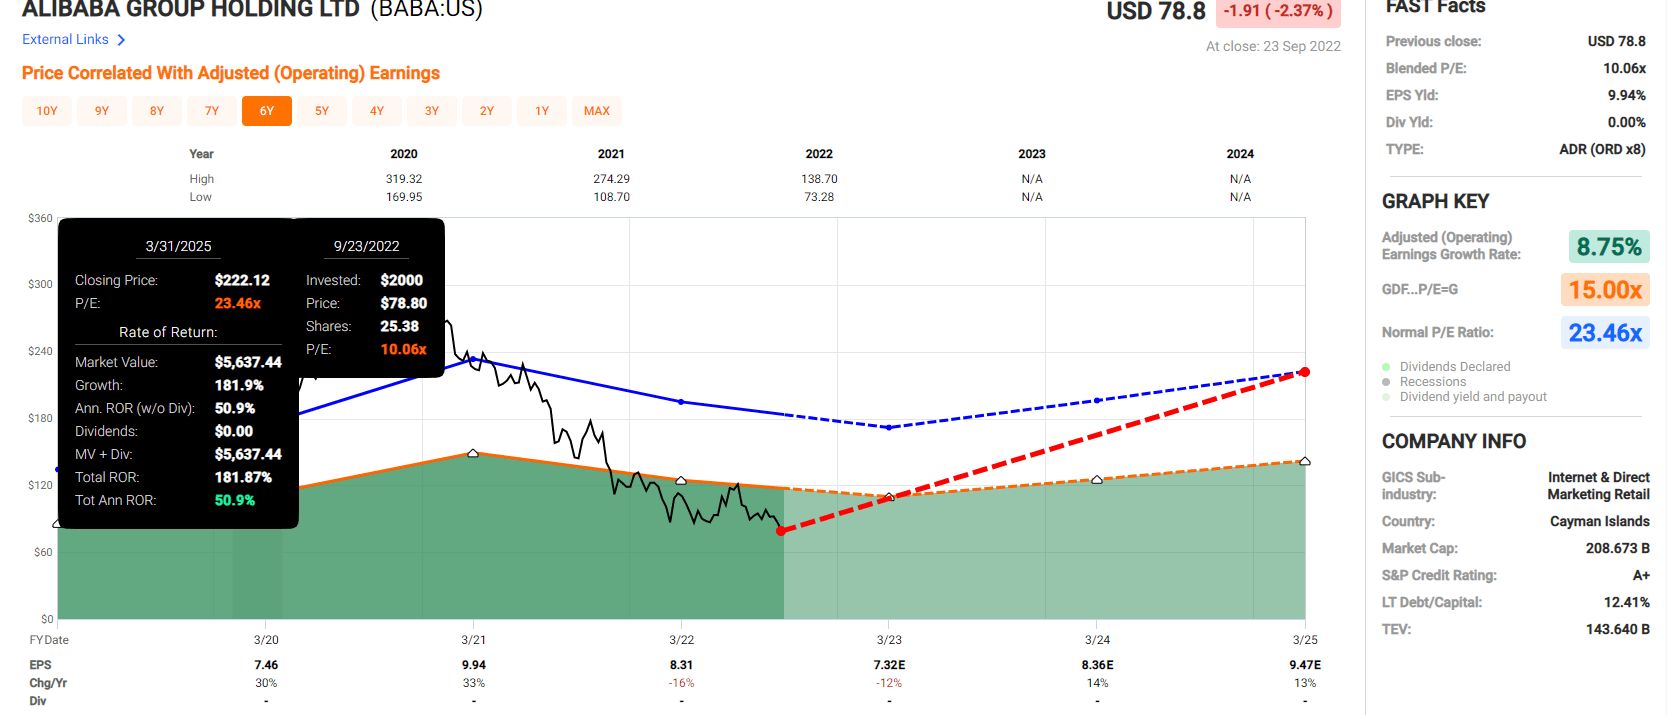
A 56% margin of safety means that BABA has the potential to nearly triple in the next three years, delivering potentially Buffett-like 51% annual returns.
Alibaba 2028 Consensus Return Potential
(Source: FAST Graphs, FactSet)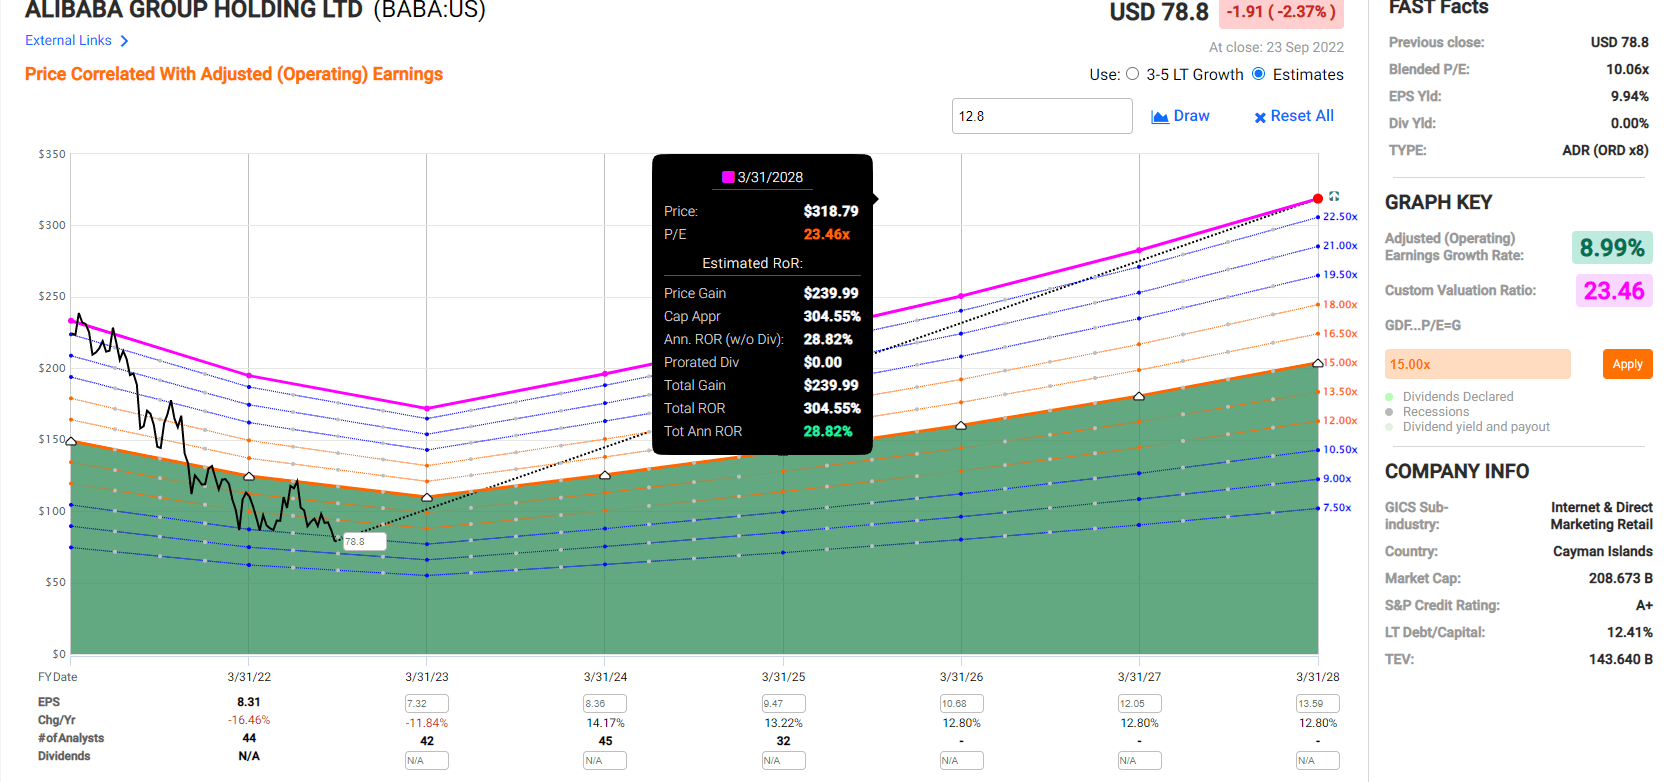
An anti-bubble valuation means that BABA could potentially quadruple over the next few years, delivering Buffett-like 29% CAGR total returns.
- -8% CAGR to 30% CAGR is the 5-year consensus return potential range
- high growth uncertainty
Now compare that to the S&P 500.
S&P 500 2024 Consensus Total Return Potential
(Source: FAST Graphs, FactSet)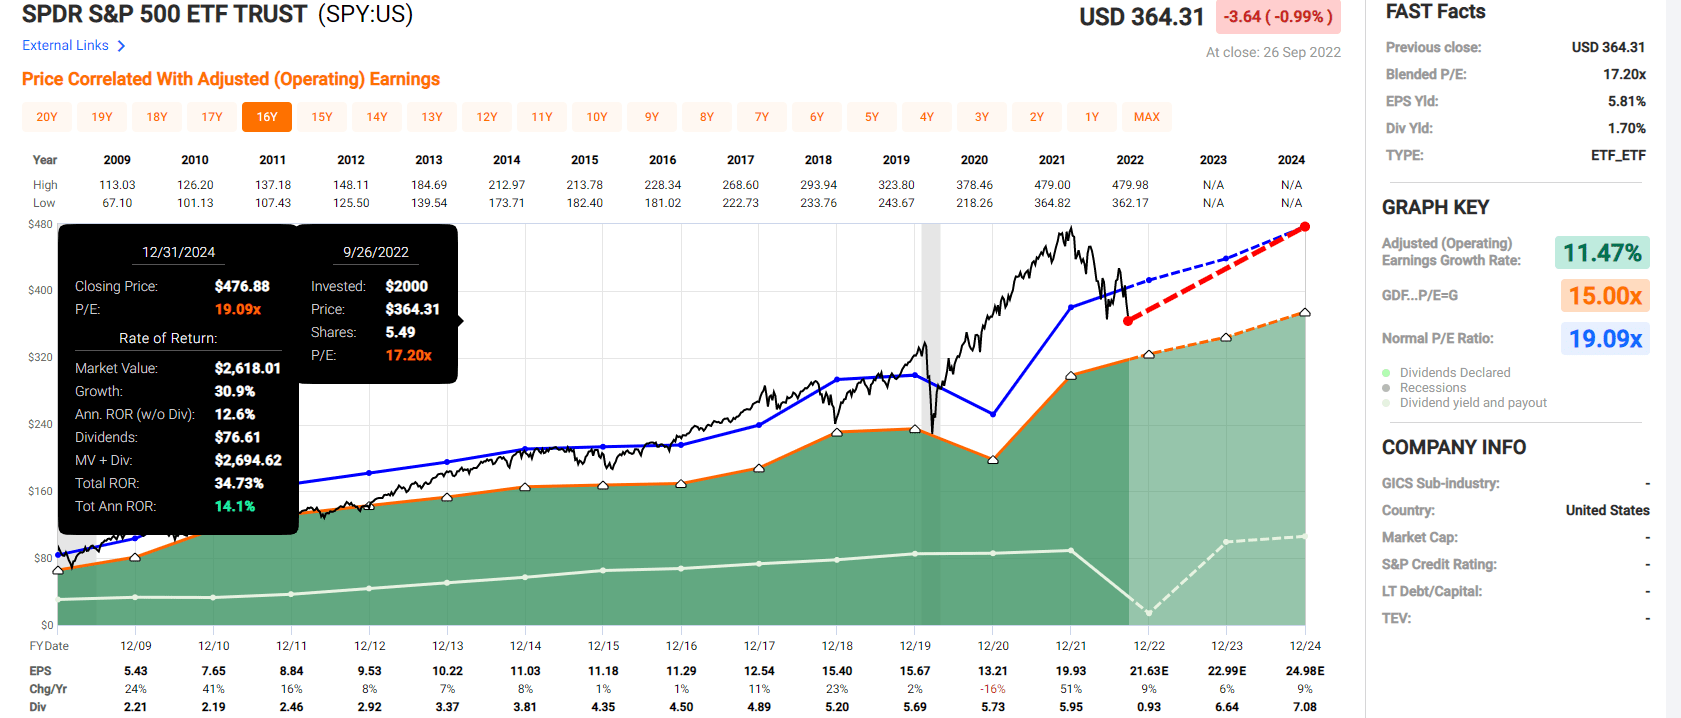
- BABA offers more than 6X the return potential of the S&P 500 over the next three years
S&P 500 2027 Consensus Total Return Potential
| Year | Upside Potential By End of That Year | Consensus CAGR Return Potential By End of That Year | Probability-Weighted Return (Annualized) |
Inflation And Risk-Adjusted Expected Returns |
| 2027 | 64.89% | 10.52% | 7.89% | 5.57% |
(Source: DK S&P 500 Valuation & Total Return Tool)
Over the next five years, analysts expect 10.5% annual returns from the S&P 500.
- BABA offers 5X the return potential of the S&P 500
So does that mean BABA is a must-buy stock right now? No, because long-term, the return potential is a far more modest 12.8% CAGR.
Just look at all the lower-risk alternatives expected to outperform BABA in the coming decades.
Dividend Champions Expected To Outperform Alibaba Over The Long-Term
Dividend Kings Zen Research Terminal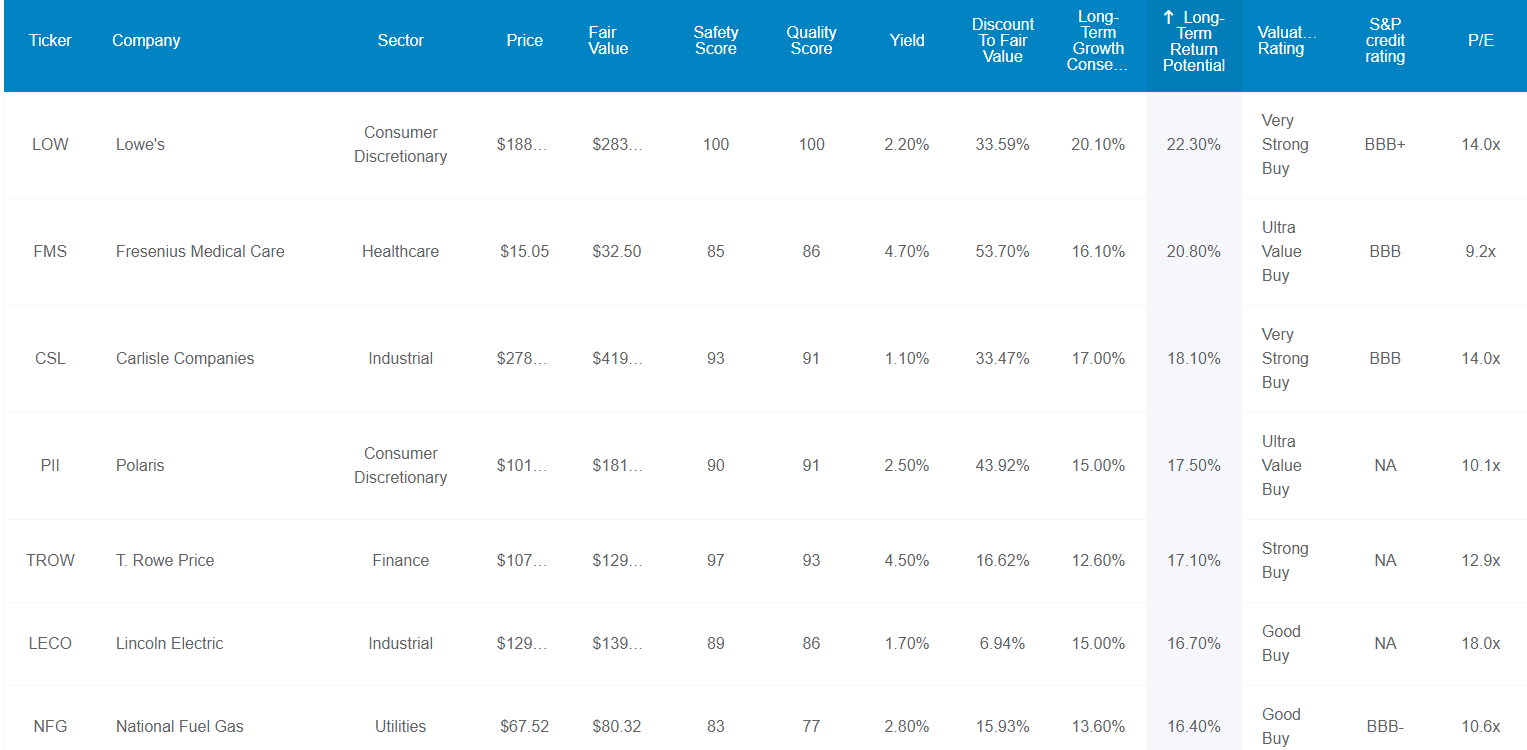
Dividend Kings Zen Research Terminal Dividend Kings Zen Research Terminal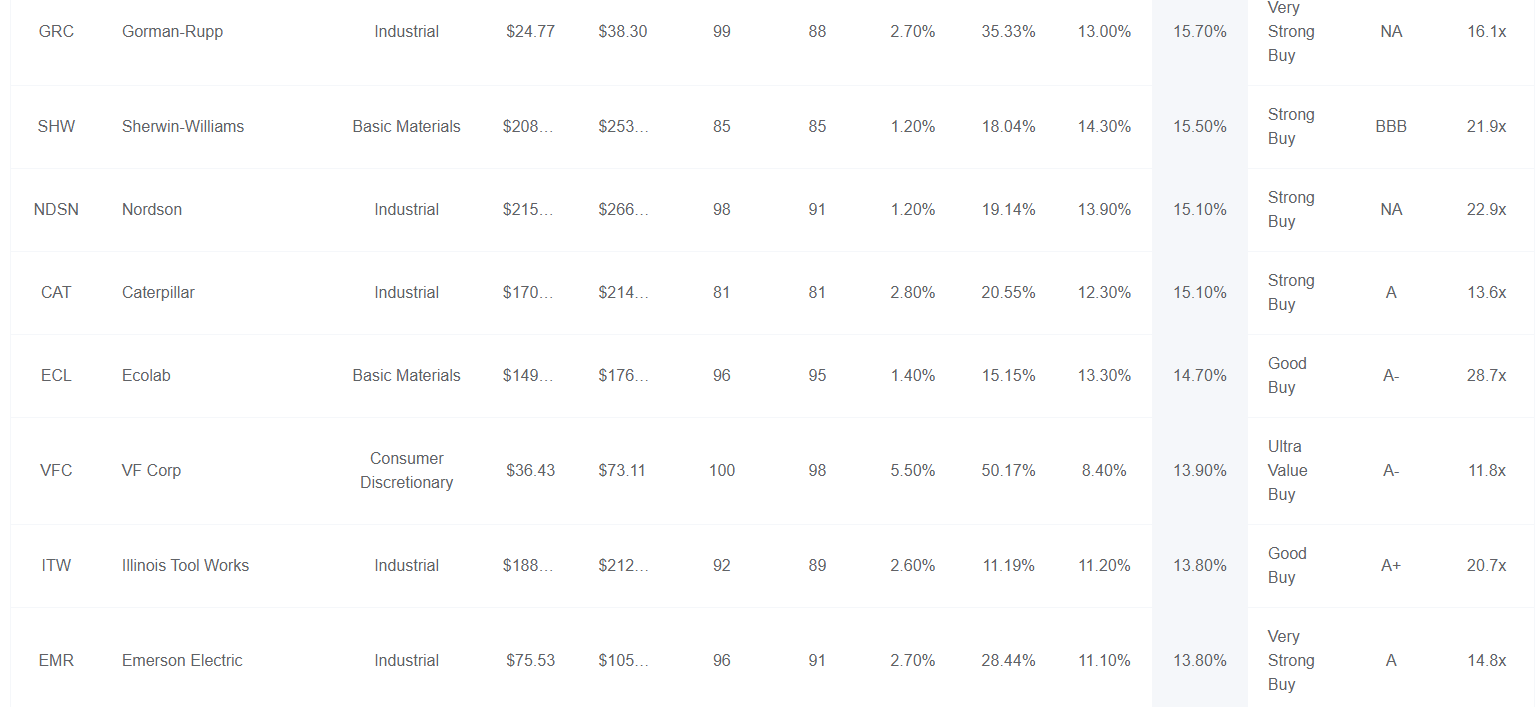
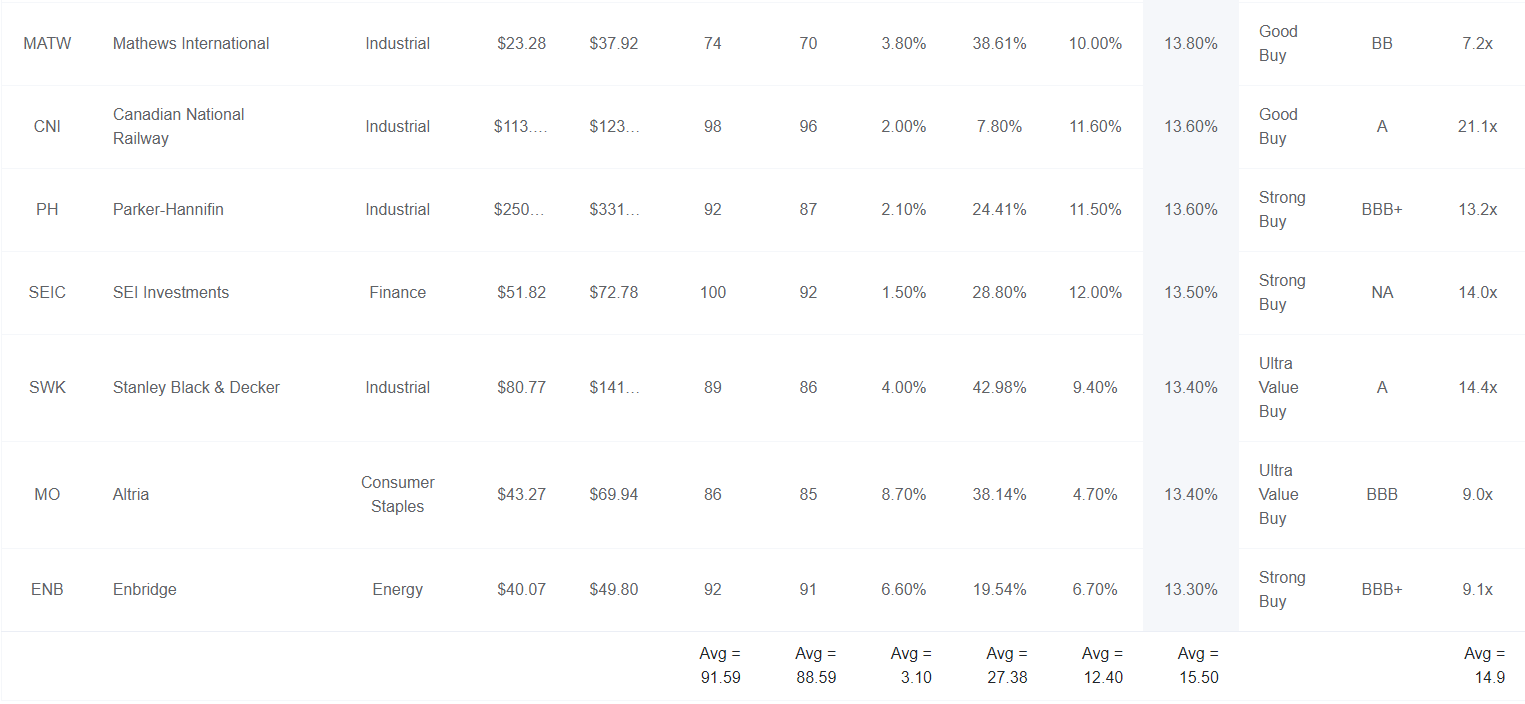
These are 22 dividend champions (25+ year dividend growth streak) companies that combined offer:
- 3.1% very safe yield
- a 27% discount to fair value
- a 14.9 P/E
- 12.4% CAGR growth consensus
- 15.5% CAGR long-term total return potential.
| Investment Strategy | Yield | LT Consensus Growth | LT Consensus Total Return Potential | Long-Term Risk-Adjusted Expected Return | Long-Term Inflation And Risk-Adjusted Expected Returns | Years To Double Your Inflation & Risk-Adjusted Wealth |
10-Year Inflation And Risk-Adjusted Expected Return |
| 22 Dividend Champion Alibaba Alternatives | 3.1% | 12.4% | 15.5% | 10.9% | 8.6% | 8.4 | 2.27 |
| Alibaba | 0.0% | 12.8% | 12.8% | 9.0% | 6.7% | 10.8 | 1.91 |
| Nasdaq | 0.9% | 11.8% | 12.7% | 8.9% | 6.6% | 10.9 | 1.89 |
| High-Yield (SCHD) | 3.4% | 8.7% | 12.1% | 8.5% | 6.2% | 11.7 | 1.82 |
| Dividend Aristocrats | 2.6% | 8.6% | 11.2% | 7.8% | 5.5% | 13.0 | 1.71 |
| S&P 500 | 1.8% | 8.5% | 10.3% | 7.2% | 4.9% | 14.6 | 1.62 |
(Source: DK Research Terminal, FactSet, Morningstar, Ycharts)
Yes, Alibaba is expected to outperform most investment strategies slightly.
But which would help you sleep better at night in a potential recession?
Owning 22 fast-growing dividend champions? The entire Nasdaq (the best dividend growth ETF of all time)? Or Alibaba?
Alibaba’s fundamental risk is 0.6% over the next 30 years.
- A+ stable credit rating from all three agencies
But the fundamental risk from 22 dividend champions? That’s effectively zero, and it’s also zero for the Nasdaq 100.
- the chance of all 22 to 100 companies going to zero is very close to zero
Question Four: What Are Potentially Superior Alternatives To Alibaba I Should Buy Instead?
We’ve already seen how there are nearly two dozen superior fast-growing dividend alternatives to Alibaba, including those with stronger credit ratings, lower fundamental risk, and superior return potential.
Here are two of my favorite hyper-growth dividend blue-chip alternatives to BABA.
Lowe’s Companies, Inc. (LOW): As Close To God’s Own Dividend King As Exists On Wall Street
Further Reading
- Lowe’s: This Buffett-Style Dividend Aristocrat Could Potentially Triple In 5 Years
- a full deep dive look at LOW’s investment thesis, growth prospects, risk profile, valuation, and total return potential
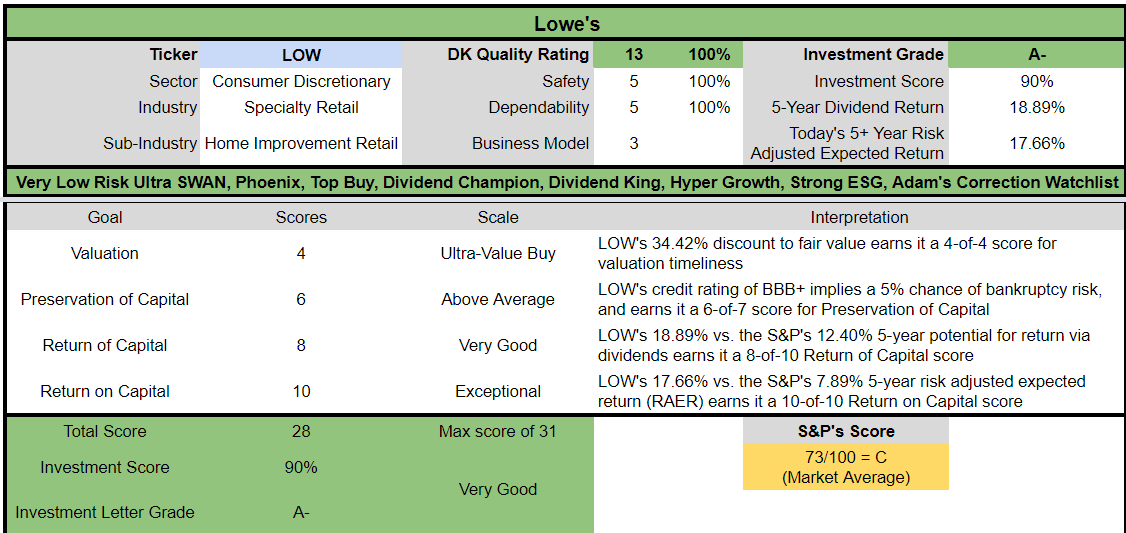
Reasons To Potentially Buy Lowe’s Today
| Metric | Lowes |
| Quality | 100% 13/13 Ultra SWAN (Sleep Well At Night) Dividend King |
| Risk Rating | Very Low Risk |
| DK Master List Quality Ranking (Out Of 500 Companies) | 1 |
| Quality Percentile | 100% |
| Dividend Growth Streak (Years) | 60 |
| Dividend Yield | 2.3% |
| Dividend Safety Score | 100% |
| Average Recession Dividend Cut Risk | 0.5% |
| Severe Recession Dividend Cut Risk | 1.00% |
| S&P Credit Rating | BBB+ Stable |
| 30-Year Bankruptcy Risk | 5% |
| Consensus LT Risk-Management Industry Percentile | 82% Very Good |
| Fair Value | $283.65 |
| Current Price | $186.02 |
| Discount To Fair Value | 34% |
| DK Rating |
Potentially Very Strong Buy |
| PE | 13.0 |
| Cash-Adjusted PE | 12.7 |
| Growth Priced In | 8.4% |
| Historical PE Range | 19 to 21 |
| LT Growth Consensus/Management Guidance | 20.10% |
| PEG Ratio | 0.63 (hyper-growth at a wonderful price) |
| 5-year consensus total return potential |
18% to 24% CAGR |
| Base Case 5-year consensus return potential |
25% CAGR (4X better than the S&P 500) |
| Consensus 12-month total return forecast | 34% |
| Fundamentally Justified 12-Month Return Potential | 55% |
| LT Consensus Total Return Potential | 22.4% |
| Inflation-Adjusted Consensus LT Return Potential | 20.2% |
| Consensus 10-Year Inflation-Adjusted Total Return Potential (Ignoring Valuation) | 6.29 |
| LT Risk-Adjusted Expected Return | 14.90% |
| LT Risk-And Inflation-Adjusted Return Potential | 12.68% |
| Conservative Years To Double | 5.68 |
(Source: Dividend Kings Zen Research Terminal)
LOW is as close to a perfect quality company as can exist on Wall Street, is growing at 20%, and yet is trading at 13X earnings.
It’s 34% undervalued and just 1% above its Ultra Value Buffett-style “fat pitch” price.
Lowe’s 2025 Consensus Total Return Potential
(Source: FAST Graphs, FactSet)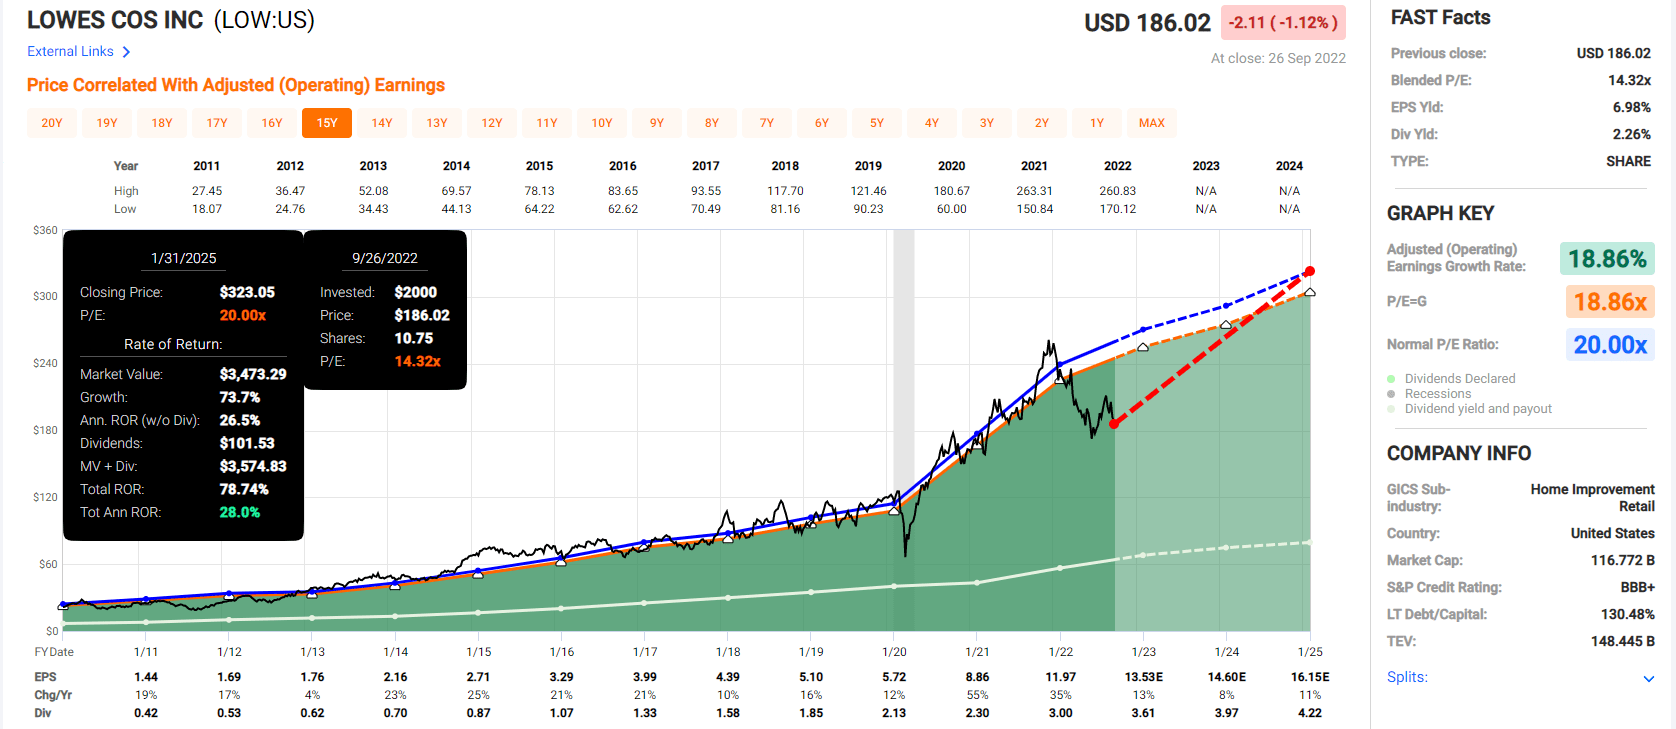
If Lowe’s grows as expected and returns to historical mid-range market-determined fair value, it could deliver almost 80% total returns by January 2025, or Buffett-like 28% annual returns.
Lowe’s 2028 Consensus Total Return Potential
(Source: FAST Graphs, FactSet)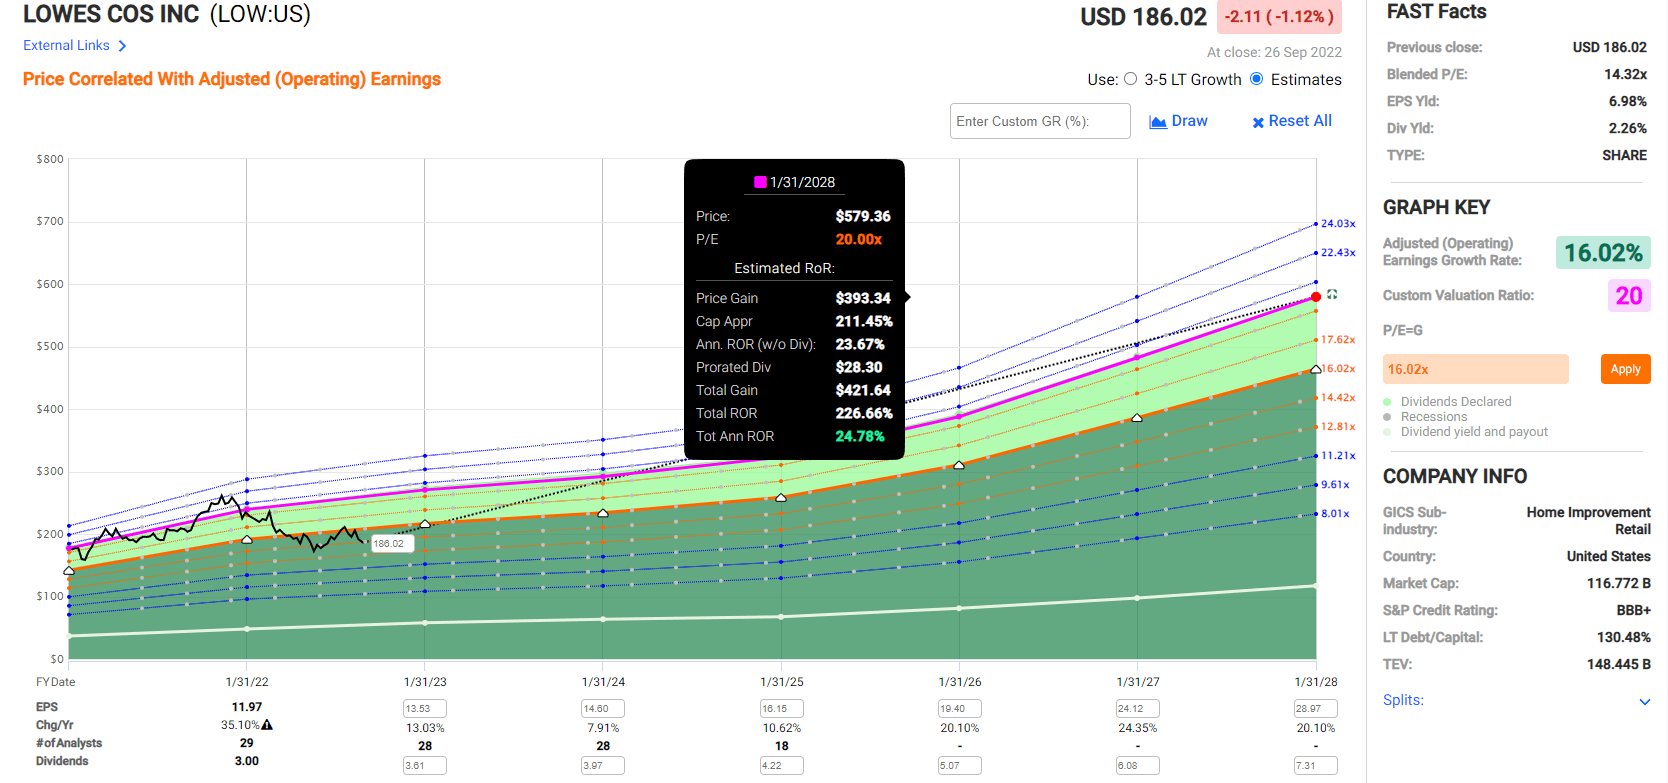
If Lowe’s grows as expected and returns to historical fair value, it could deliver 227% total returns, or 25% annually, over the coming five years.
| Investment Strategy | Yield | LT Consensus Growth | LT Consensus Total Return Potential | Long-Term Risk-Adjusted Expected Return | Long-Term Inflation And Risk-Adjusted Expected Returns | Years To Double Your Inflation & Risk-Adjusted Wealth |
10-Year Inflation And Risk-Adjusted Expected Return |
| Lowe’s | 2.3% | 20.1% | 22.4% | 15.7% | 13.4% | 5.4 | 3.51 |
| Alibaba | 0.0% | 12.8% | 12.8% | 9.0% | 6.7% | 10.8 | 1.91 |
| Nasdaq | 0.9% | 11.8% | 12.7% | 8.9% | 6.6% | 10.9 | 1.89 |
| Schwab US Dividend Equity ETF | 3.6% | 8.80% | 12.4% | 8.7% | 6.4% | 11.3 | 1.86 |
| Dividend Aristocrats | 2.6% | 8.6% | 11.2% | 7.8% | 5.5% | 13.0 | 1.71 |
| S&P 500 | 1.8% | 8.5% | 10.3% | 7.2% | 4.9% | 14.6 | 1.62 |
(Source: DK Research Terminal, FactSet, Morningstar, Ycharts)
LOW offers nearly 2X the long-term annual return potential of BABA, from a hyper-growth Ultra SWAN dividend king, no less.
Inflation-Adjusted Consensus Total Return Potential: $1,000 Initial Investment
| Time Frame (Years) | 8% CAGR Inflation-Adjusted S&P 500 Consensus | 10.5% Inflation-Adjusted BABA Consensus | 20.1% CAGR Inflation-Adjusted LOW Consensus | Difference Between Inflation-Adjusted LOW Consensus And BABA Consensus |
| 5 | $1,470.01 | $1,648.19 | $2,499.75 | $851.55 |
| 10 | $2,160.92 | $2,716.54 | $6,248.73 | $3,532.19 |
| 15 | $3,176.58 | $4,477.38 | $15,620.23 | $11,142.86 |
| 20 | $4,669.60 | $7,379.58 | $39,046.61 | $31,667.03 |
(Source: DK Research Terminal, FactSet)
Even if LOW’s grows only as expected for the next decade it could potentially deliver over 6X inflation-adjusted returns, far more than BABA (ignoring valuation, which cancels out over time).
| Time Frame (Years) | Ratio Inflation And Inflation-Adjusted LOW vs. BABA consensus |
| 5 | 1.52 |
| 10 | 2.30 |
| 15 | 3.49 |
| 20 | 5.29 |
(Source: DK Research Terminal, FactSet)
Lowe’s has the potential to more than double BABA’s returns over the next decade, and if it can keep growing at the expected rate for longer, potentially more than 5X greater returns over the next 20 years.
LOW Corp Investment Decision Tool
DK (Source: Dividend Kings Automated Investment Decision Tool)
LOW is potentially a good hyper-growth dividend king opportunity for anyone comfortable with its risk profile.
- 34% discount to fair value Vs. 8% S&P = 26% better valuation
- 2.3% safe yield vs. 1.8% S&P (33% higher and growing 2.5X as fast)
- 120% higher annual long-term return potential
- over 2X higher risk-adjusted expected returns
- 50% more consensus 5-year income
QUALCOMM Incorporated (QCOM): Hyper-Dividend Growth At A Wonderful Price
Further Reading
- Qualcomm: A Wonderful Company At A Wonderful Price
- a full deep dive look at LOW’s investment thesis, growth prospects, risk profile, valuation, and total return potential
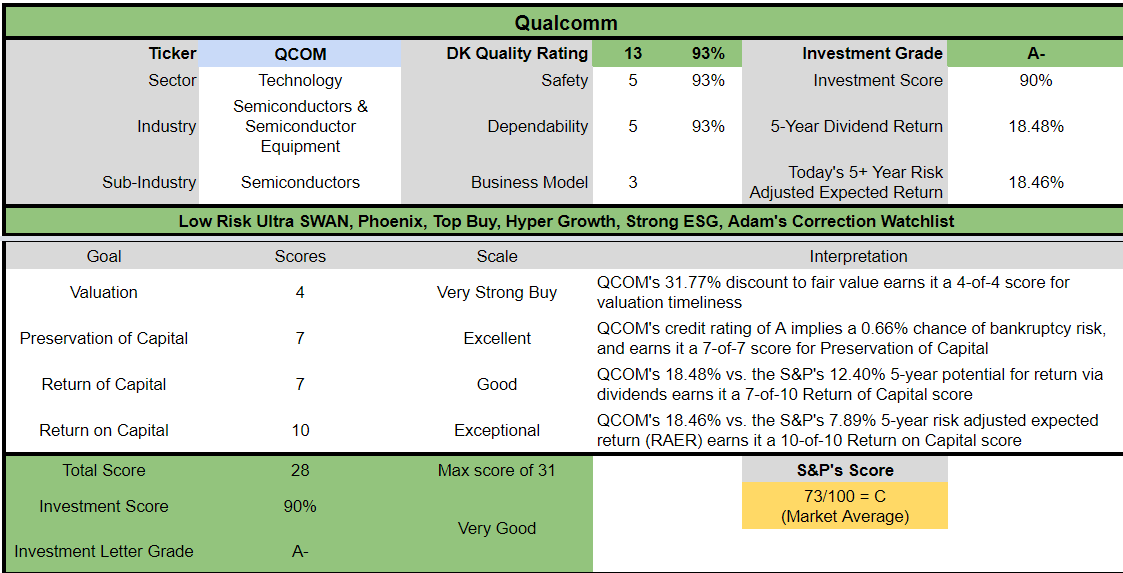
Reasons To Potentially Buy Qualcomm Today
| Metric | Qualcomm |
| Quality | 93% 13/13 Ultra SWAN (Sleep Well At Night) Chip Maker |
| Risk Rating | Low Risk |
| DK Master List Quality Ranking (Out Of 500 Companies) | 44 |
| Quality Percentile | 91% |
| Dividend Growth Streak (Years) | 18 |
| Dividend Yield | 2.5% |
| Dividend Safety Score | 93% |
| Average Recession Dividend Cut Risk | 0.5% |
| Severe Recession Dividend Cut Risk | 1.35% |
| S&P Credit Rating | A Stable |
| 30-Year Bankruptcy Risk | 1% |
| Consensus LT Risk-Management Industry Percentile |
78% Good, Bordering On Very Good |
| Fair Value | $175.50 |
| Current Price | $119.74 |
| Discount To Fair Value | 32% |
| DK Rating |
Potentially Very Strong Buy |
| P/E | 9.2 |
| Cash-Adjusted P/E | 7.9 (anti-bubble blue-chip) |
| Growth Priced In | -1.2% CAGR |
| Historical PE Range | 16 to 17.5 |
| LT Growth Consensus/Management Guidance | 15.40% |
| PEG Ratio | 0.51 (hyper-growth at a wonderful price) |
| 5-year consensus total return potential |
15% to 24% CAGR |
| Base Case 5-year consensus return potential |
23% CAGR (3X better than the S&P 500) |
| Consensus 12-month total return forecast | 63% |
| Fundamentally Justified 12-Month Return Potential | 49% |
| LT Consensus Total Return Potential | 17.9% |
| Inflation-Adjusted Consensus LT Return Potential | 15.7% |
| Consensus 10-Year Inflation-Adjusted Total Return Potential (Ignoring Valuation) | 4.29 |
| LT Risk-Adjusted Expected Return | 12.45% |
| LT Risk-And Inflation-Adjusted Return Potential | 10.23% |
| Conservative Years To Double | 7.03 Vs. 15.2 S&P 500 |
(Source: Dividend Kings Zen Research Terminal)
QCOM is trading at 7.9X cash-adjusted earnings, a BABA-like valuation. Except it’s growing faster and pays a very safe and attractive dividend.
- 0.51 PEG is incredibly attractive
Analysts think QCOM will deliver 63% returns in the next year, and a 50% gain would be justified by its fundamentals.
QCOM’s conservative time to double is 7 years, half that of the S&P 500.
- adjust consensus long-term return potential for the probability of the company not growing as expected
- or even going bankrupt
- and inflation
- conservatively QCOM could double your inflation-adjusted wealth in 7 years
- and quadruple it in 14 years
Qualcomm 2024 Consensus Total Return Potential
(Source: FAST Graphs, FactSet)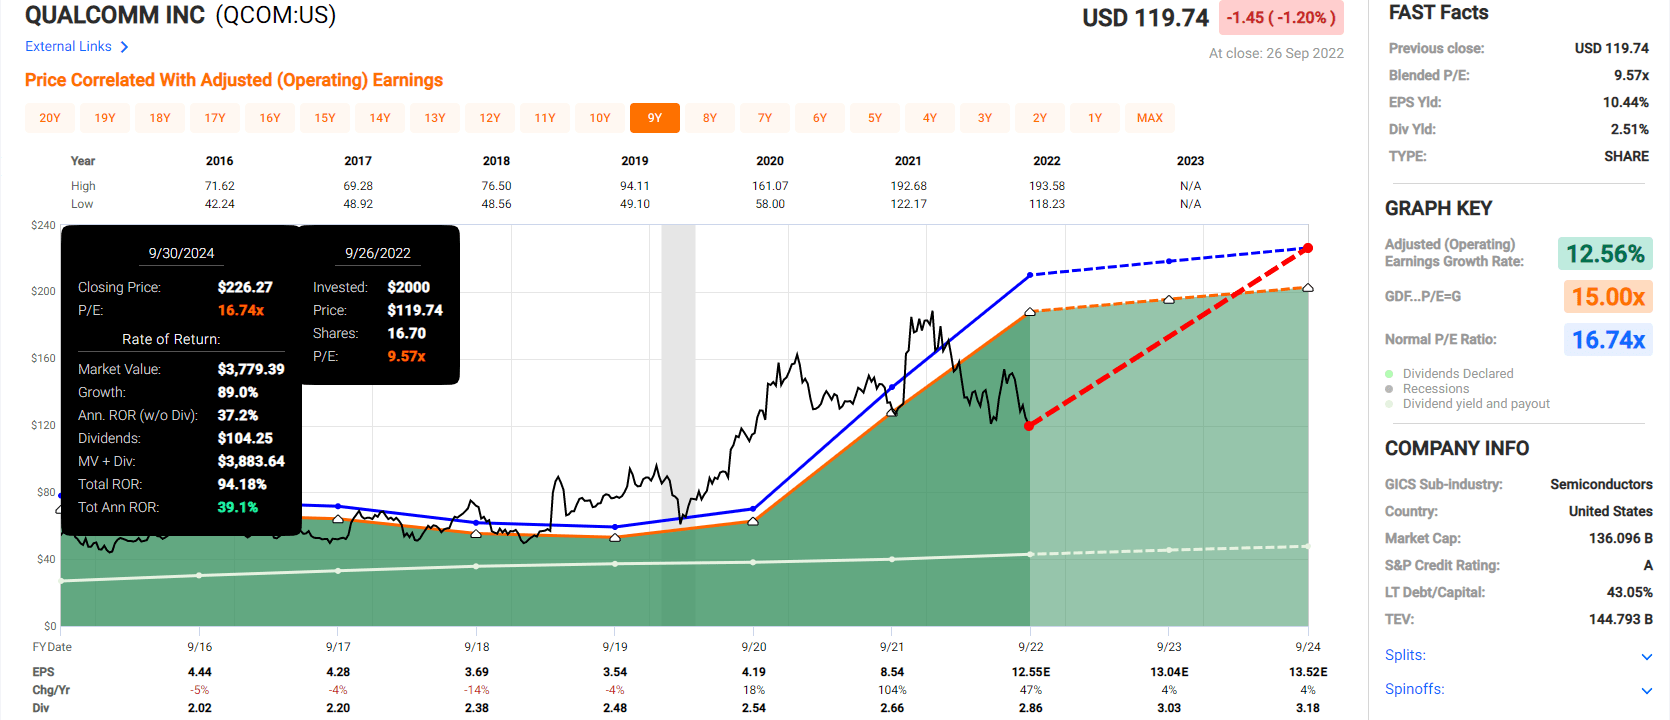
If QCOM grows as expected and returns to historical fair value, it could nearly double by September 2024, delivering Buffett-like 39% annual total returns.
Qualcomm 2027 Consensus Total Return Potential
(Source: FAST Graphs, FactSet)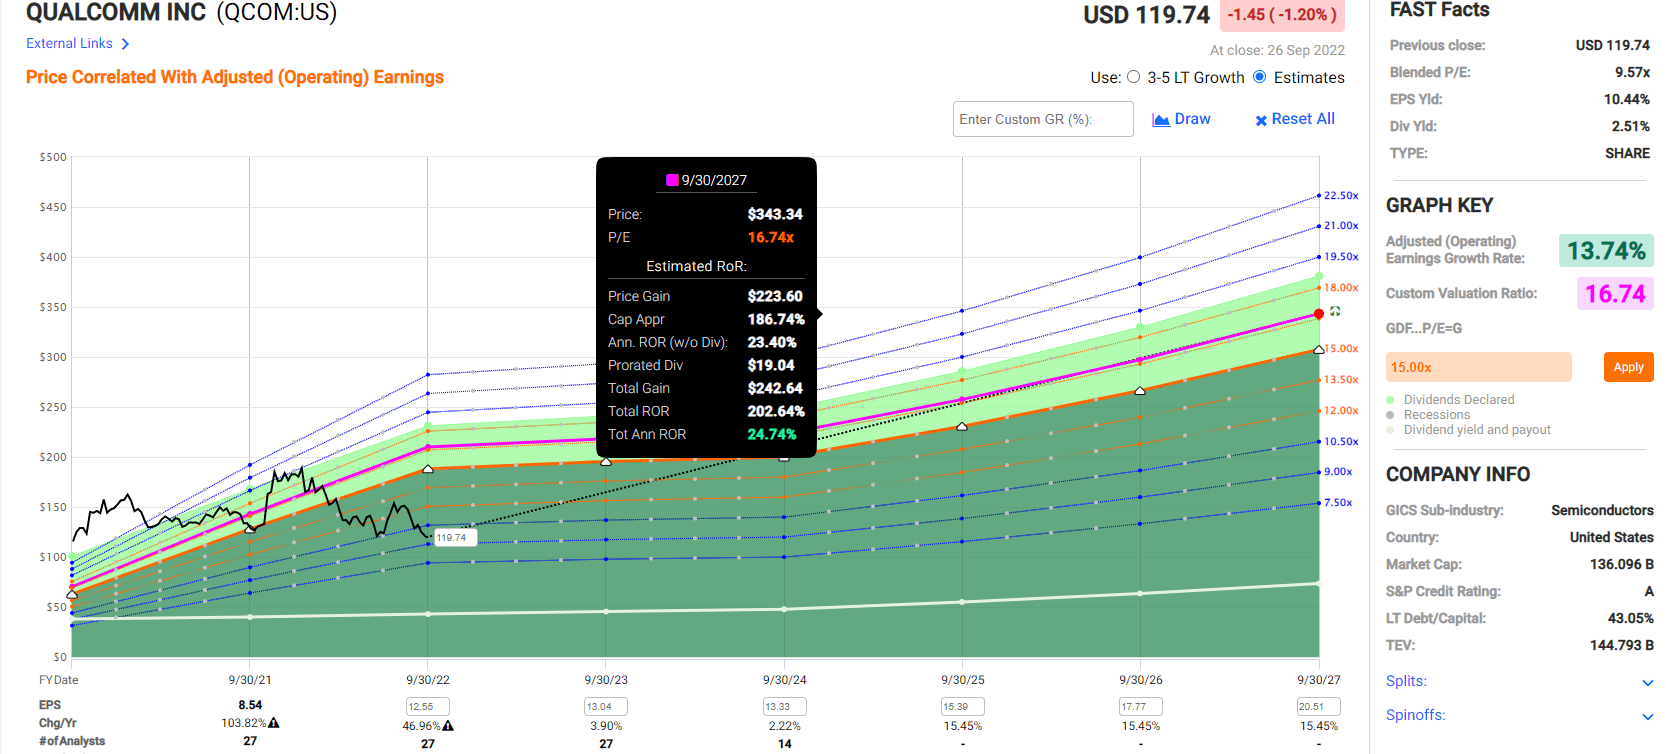
If QCOM grows as expected and returns to historical fair value, it could triple in five years, delivering Buffett-like 25% annual total returns.
But remember that what matters more than incredible medium-term returns are long-term returns that could change your life.
| Investment Strategy | Yield | LT Consensus Growth | LT Consensus Total Return Potential | Long-Term Risk-Adjusted Expected Return | Long-Term Inflation And Risk-Adjusted Expected Returns | Years To Double Your Inflation & Risk-Adjusted Wealth |
10-Year Inflation And Risk-Adjusted Expected Return |
| Lowe’s | 2.3% | 20.1% | 22.4% | 15.7% | 13.4% | 5.4 | 3.51 |
| Qualcomm | 2.5% | 15.4% | 17.9% | 12.5% | 10.2% | 7.0 | 2.65 |
| Alibaba | 0.0% | 12.8% | 12.8% | 9.0% | 6.7% | 10.8 | 1.91 |
| Nasdaq | 0.9% | 11.8% | 12.7% | 8.9% | 6.6% | 10.9 | 1.89 |
| Schwab US Dividend Equity ETF | 3.6% | 8.80% | 12.4% | 8.7% | 6.4% | 11.3 | 1.86 |
| Dividend Aristocrats | 2.6% | 8.6% | 11.2% | 7.8% | 5.5% | 13.0 | 1.71 |
| S&P 500 | 1.8% | 8.5% | 10.3% | 7.2% | 4.9% | 14.6 | 1.62 |
(Source: DK Research Terminal, FactSet, Morningstar, Ycharts)
QCOM is expected to potentially run circles around almost every investment strategy, including the Nasdaq and BABA.
Inflation-Adjusted Consensus Total Return Potential: $1,000 Initial Investment
| Time Frame (Years) | 8% CAGR Inflation-Adjusted S&P 500 Consensus | 10.5% Inflation-Adjusted BABA Consensus | 15.6% CAGR Inflation-Adjusted QCOM Consensus | Difference Between Inflation-Adjusted QCOM Consensus And BABA Consensus |
| 5 | $1,470.01 | $1,648.19 | $2,065.27 | $417.08 |
| 10 | $2,160.92 | $2,716.54 | $4,265.34 | $1,548.81 |
| 15 | $3,176.58 | $4,477.38 | $8,809.09 | $4,331.71 |
| 20 | $4,669.60 | $7,379.58 | $18,193.16 | $10,813.58 |
(Source: DK Research Terminal, FactSet)
Even if QCOM grows only as expected for the next decade, it could potentially deliver over 4X inflation-adjusted returns, far more than BABA (ignoring valuation, which cancels out over time).
| Time Frame (Years) | Ratio Inflation And Inflation-Adjusted QCOM vs. BABA consensus |
| 5 | 1.25 |
| 10 | 1.57 |
| 15 | 1.97 |
| 20 | 2.47 |
(Source: DK Research Terminal, FactSet)
QCOM has the potential to beat BABA’s returns by 60% returns over the next decade, and if it can keep growing at the expected rate for longer, potentially 2.5X greater returns over the next 20 years.
- with a far more attractive risk profile
Qualcomm Investment Decision Tool
DK (Source: Dividend Kings Automated Investment Decision Tool)
QCOM is potentially a good hyper-dividend growth opportunity for anyone comfortable with its risk profile.
- 32% discount to fair value Vs. 8% S&P = 24% better valuation
- 2.5% safe yield vs. 1.8% S&P (50% higher and growing 2X as fast)
- 70% higher annual long-term return potential
- over 2X higher risk-adjusted expected returns
- 50% more consensus 5-year income
Bottom Line: Alibaba Is Dirt Cheap But So Are These Two Faster-Growing Dividend Blue-Chips
BABA has a lot of growth potential, being the dominant name in digital commerce in the world’s most populace country.
But just because China is a land of potential opportunity doesn’t mean that investors necessarily profit.
Marketwatch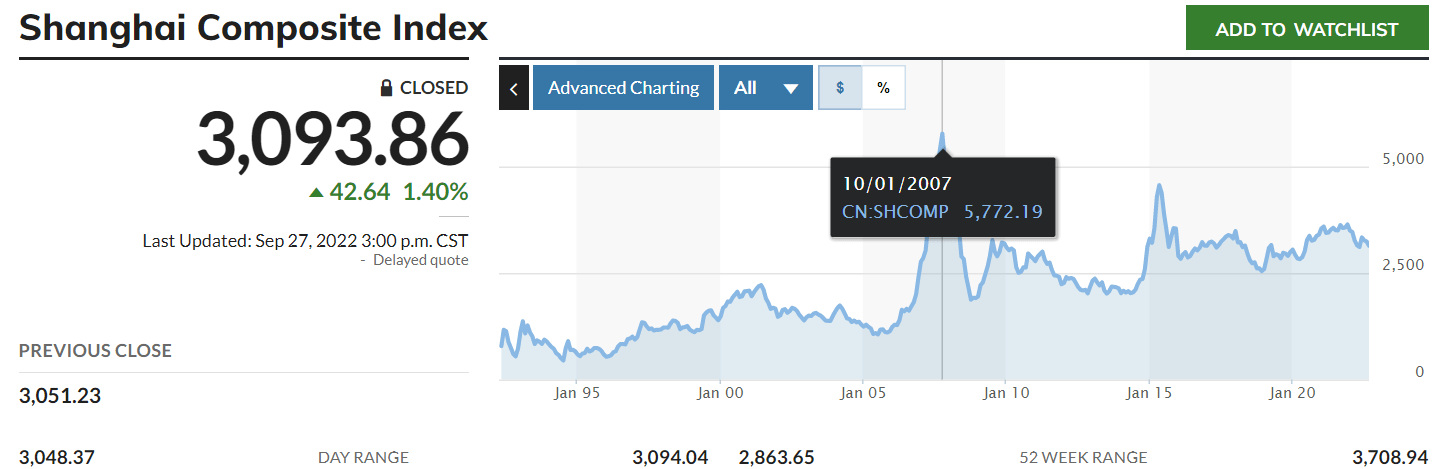
In October 2007, the Shanghai composite index peaked at 5,772, in the same month as the US stock market did.
But since then, despite incredible economic growth in China, and companies like BABA becoming titans, investors are down 46%.
- -60% adjusted for inflation
- -5.9% annual inflation-adjusted returns for investors in China for the last 15 years
Total Returns Since October 2014
(Source: Portfolio Visualizer Premium)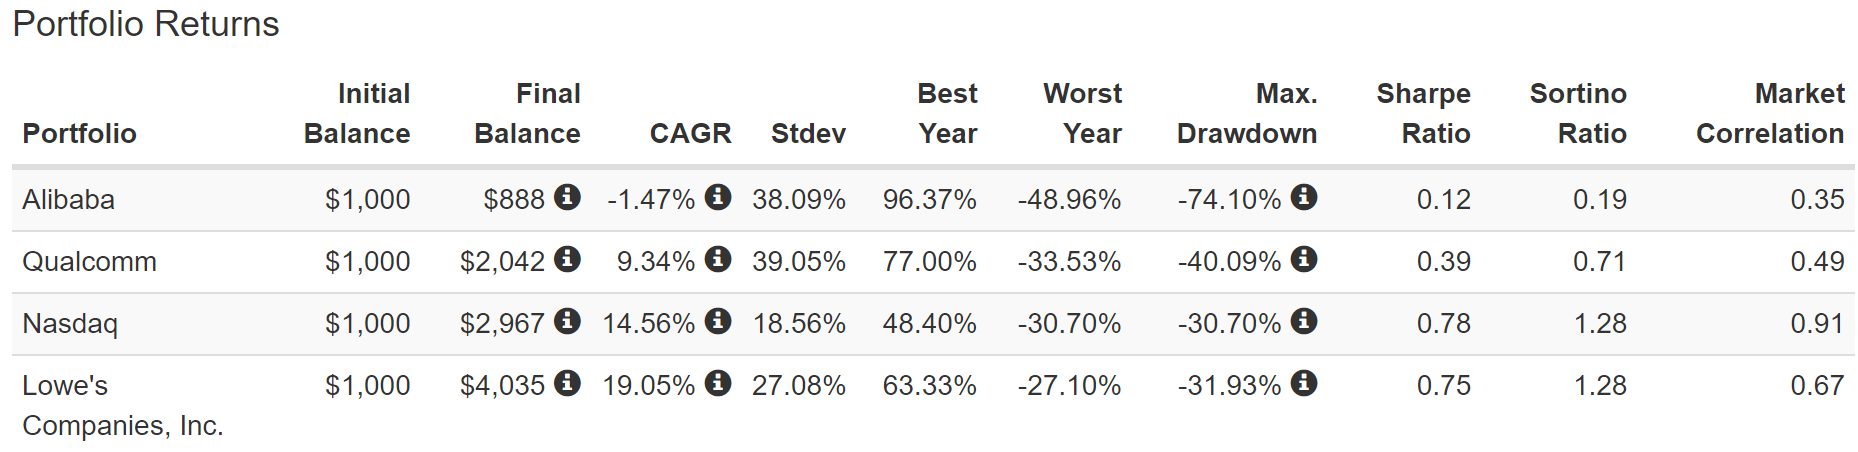
Alibaba, purely due to regulatory risk, has delivered negative 1.5% annual returns over the last eight years.
Adjusting for inflation, things look even worse.
Inflation-Adjusted Returns Since October 2014
| Stock | Ticker | Inflation-Adjusted Return Since October 2014 | Annual Real Return Since October 2014 |
| Alibaba | BABA | -29% | -4.1% |
| Qualcomm | QCOM | 61% | 6.4% |
| Nasdaq | QQQM | 139% | 11.5% |
| Lowe’s | LOW | 224% | 15.8% |
(Source: Portfolio Visualizer Premium)
Granted 8 years ending in a bear market is only 63% statistically significant, but the point is that Alibaba represents a bargain basement growth stock whose growth isn’t all that impressive.
Not when there are 22 dividend aristocrats alone with faster growth rates, including Lowe, ‘s a very low-risk Ultra SWAN quality dividend king growing at 20%.
Qualcomm is growing 25% faster than BABA, offers an attractive 2.5% yield, and has a growth runway that spans decades.
In a bear market, most things go on sale. Right now, BABA is a screaming buy…in a vacuum.
But 74% of the Dividend Kings Master List is trading at fair value or better, including 17 companies that are 52% or more historically undervalued.
When faced with such a target-rich blue-chip bargain-hunting environment, I can’t recommend Alibaba to any but the most risk-tolerant investors (and a 1% or less max risk cap rec).
Yes, BABA could quadruple in the next five years. And yes, it’s growth prospects might continue to improve. But they likely won’t improve to the 25% CAGR they were before the regulatory crackdown began.
In the meantime, faster-growing dividend blue-chip bargains like LOW and QCOM are firing on all cylinders and don’t represent turnaround stories.
They don’t come with the high property right risk that BABA has always had and always will.
And most importantly, over the long-term, they offer far better return potential, and a lot more income while letting you sleep far better at night.
Be the first to comment