

claffra
Since 2022 is almost over, and most major Wall Street institutions have put out their 2023 year-end price target for the S&P 500 (SP500), we also want to give some input and present historical information to get a grip on where the economy is headed. Although we must add the caveat that even making 1-year forecasts can be greatly clouded by market irrationality, and can become far removed from true intrinsic value.
In this article, we tell you why we think 2023 may have more in common with the early 2000s and 1980s than some think, and where the S&P 500 (SPY) could be headed in 2023. We will also give our detailed FY 2023 forecast.
Our analysis is based on a few factors:
- Bonds, Yields & Inflation
- The Buffett Indicator
- S&P 500 Historical Earnings
- Technical Analysis
- Other Factors
Bonds, Yields & Inflation
First, a topic on everyone’s mind lately: inflation. While there is much talk about the general meaning of inflation, we think that the components that make up inflation are probably far overlooked.
And we think that’s especially true of the housing component, which makes up 32.71% of the index, divided into 7.38% primary-home rent and 24.04% for owners-equivalent rent. Owners-equivalent rent is basically the hypothetical rent that homeowners would pay if they were not homeowners. Even though your house may already be paid off, it still shows up in the owners-equivalent rent.
But that aside, the biggest problem with housing is primarily the fact that it is a lagging indicator. Although housing prices rose quite strongly in 2021 to early 2022, they have declined quite a bit since then, looking at live data. According to Redfin, the median sales price for a home in May of this year was $430,365. Last month, in November, that price dropped to $393,977. That’s an 8.46% drop in just six months.
Federal Reserve (FRED)
According to data from rent.com, rents have also peaked, following a hot 2021. As you can see in the chart above, the blue line represents overall CPI. The red line represents shelter, and the green line CPI excluding shelter. As you can see, we are in a pretty deflationary environment if we exclude shelter, and the Fed said just a few days ago that it “still has a ways to go.”
And we may not even have yet felt the delayed effects of the interest rate hikes that have been implemented recently. Moreover, we have seen some of the craziest moves in terms of 30-year fixed mortgage rates. We went from 2.7% in August last year to briefly above 7% in October of this year. The last time the U.S. moved this fast was in the 1980s, when the 30-year rate went from 8.75% to 18%.
The effect of an extremely sharp rise in 30-year mortgage rates on housing prices is little known, as there is not much data to look back on. But one thing we can say with certainty is that it cannot be positive.
Federal Reserve (FRED)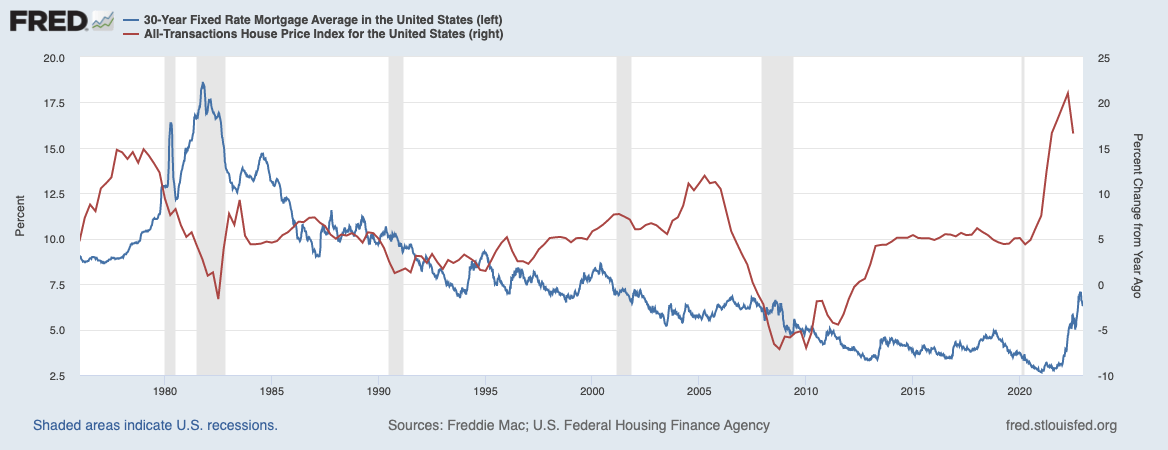
We believe, as you can see from the chart below, that the trend is visible and inflation is already visibly falling. Nevertheless, the Federal Reserve seems to be taking its chances and perhaps not giving enough importance to lagging indicators and the lagging effect of interest rates. It is common knowledge that it takes up to 18 months for interest rate changes to take full effect.
Tradingeconomics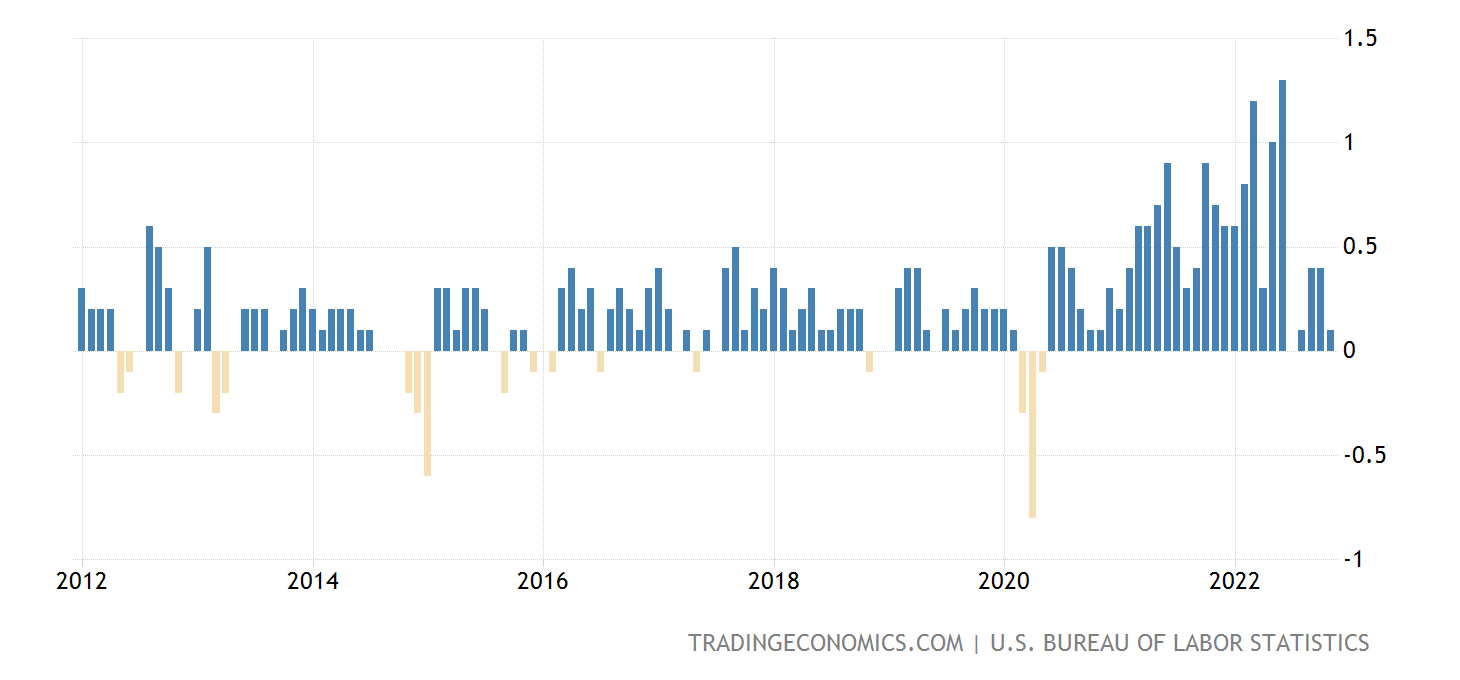
Unlike the 1980s, when the U.S. had an ongoing problem with supply-demand imbalances in oil, “guns and butter,” combined with high unemployment. The outlook nowadays is the culmination of a rapid contraction when the economy was brought to a halt by the pandemic, followed by excessive fiscal stimulus and a rapid reopening of the economy, combined with a supply chain shock and followed by the war in Ukraine.
Unless those problems persist, a high-end rate for the Fed could be very unnecessary, especially since inflation is already declining before interest rate changes take effect. The economy has opened, the pandemic seems to be behind us (excluding China) and supply chain problems are being sorted out.
So let’s say the Fed continues to tighten even though the economy is distressed and inflation is already falling. What might that look like? We think a deflationary recession. A real recession with really meaningful deflation in the last 60 years only happened in recent history, circa 2008.
Federal Reserve (FRED)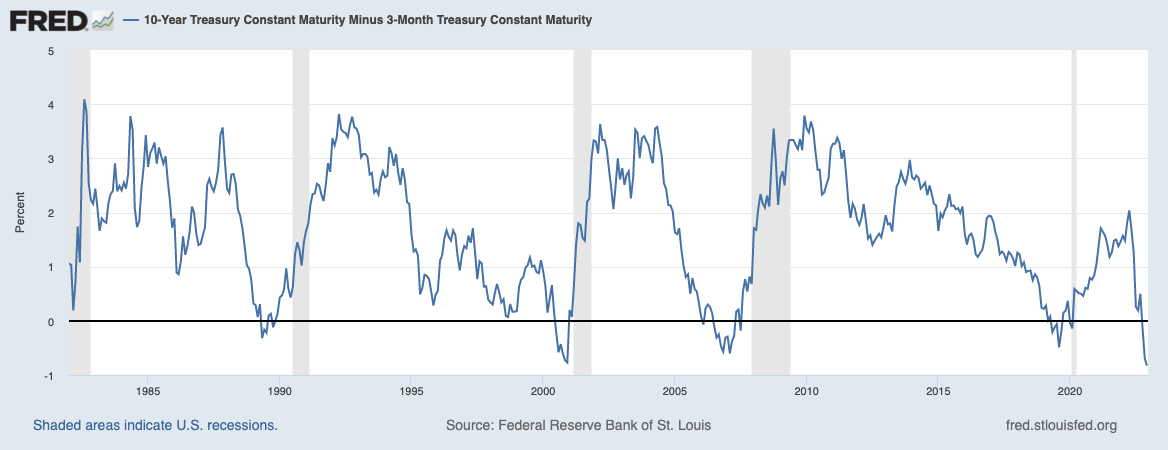
So it is no wonder that the 10-3 month yield curve, shown above, and the 10-2 year yield curve, shown below, are sharply inverted. The most inverted since 1980.
Currently, the 10-2 year yield curve is -69 bp inverted and was even -83 bp inverted, which we believe indicates a deep recession. Whether it is a short or a long one depends, in our view, on how long the Fed stays at their terminal rate.
Federal Reserve (FRED)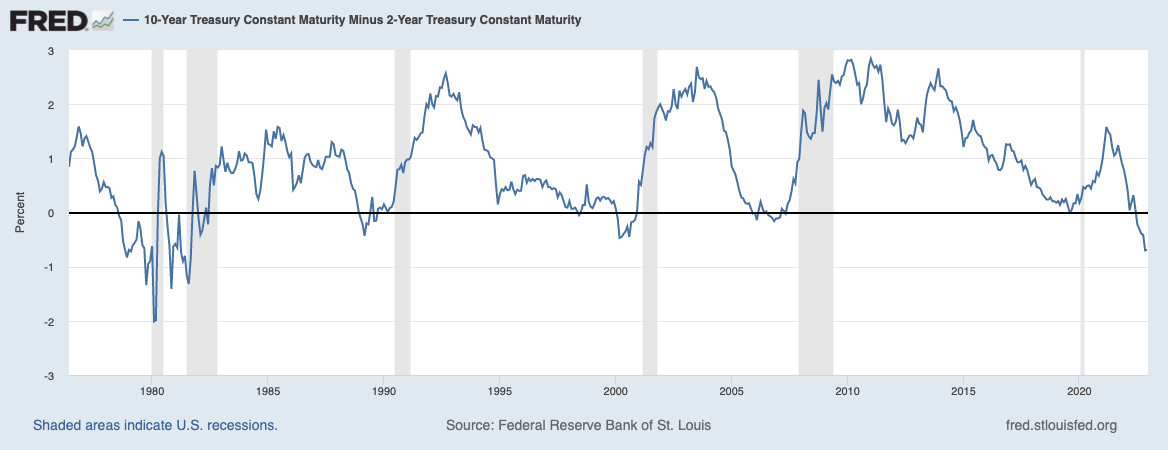
Another lagging effect: unemployment. Although it is more difficult to extract more data from recent history, the 2008 and 2020 recessions were both the result of rare events, we would rather say a force majeure. But looking back to the early 2000s, when interest rates went from 4.75% to 6.5% to cool the economy, it took some time for unemployment to catch up.
The red line below represents unemployment, with the blue line representing the Federal Funds Rate. From the time it reached 6.5%, it took another 12 months before there was any meaningful movement in unemployment. And that was when rates were raised from a higher base. As it stands now, there is still a labor shortage, especially for blue collar workers.
Federal Reserve (FRED)
Politico also wrote a piece on Deflation as a bigger threat to the economy than Inflation, and mentioned the Baltic Dry Index. It is the daily price for renting giant ships, called capesize ships, that cannot fit through the Panama Canal.
In 2008 the index rose sharply and then collapsed from, 9500 to 800. Right now we are seeing the same thing: the index rose sharply and then collapsed from 5100 to 1500 right now. Oil, copper and other commodities have also fallen sharply in price.
Needless to say, in our estimate of earnings in 2023, we will factor in a sizable haircut for the S&P 500 based on the factors described above, as in previous times of recession/ yield curve inversion.
The Buffett Indicator
One of our other favorite measures of the stock market is the “Buffett Indicator.” This indicator is based on both the GDP of the U.S. economy and the total value of the U.S. stock market.
To begin with, to calculate U.S. GDP for 2023, we take the Q3 2022 GDP, which was 25.698BN, and add a 2.8% annualized growth rate (0.7% quarterly) for Q4 2022, as currently forecast by the GDPNow Forecast. That brings GDP to 25.879 billion. Judging from the forecast, GDP is expected to slow to 0% annualized in 2023, which means we will use our estimate for the end of 2022.
Current Market Valuation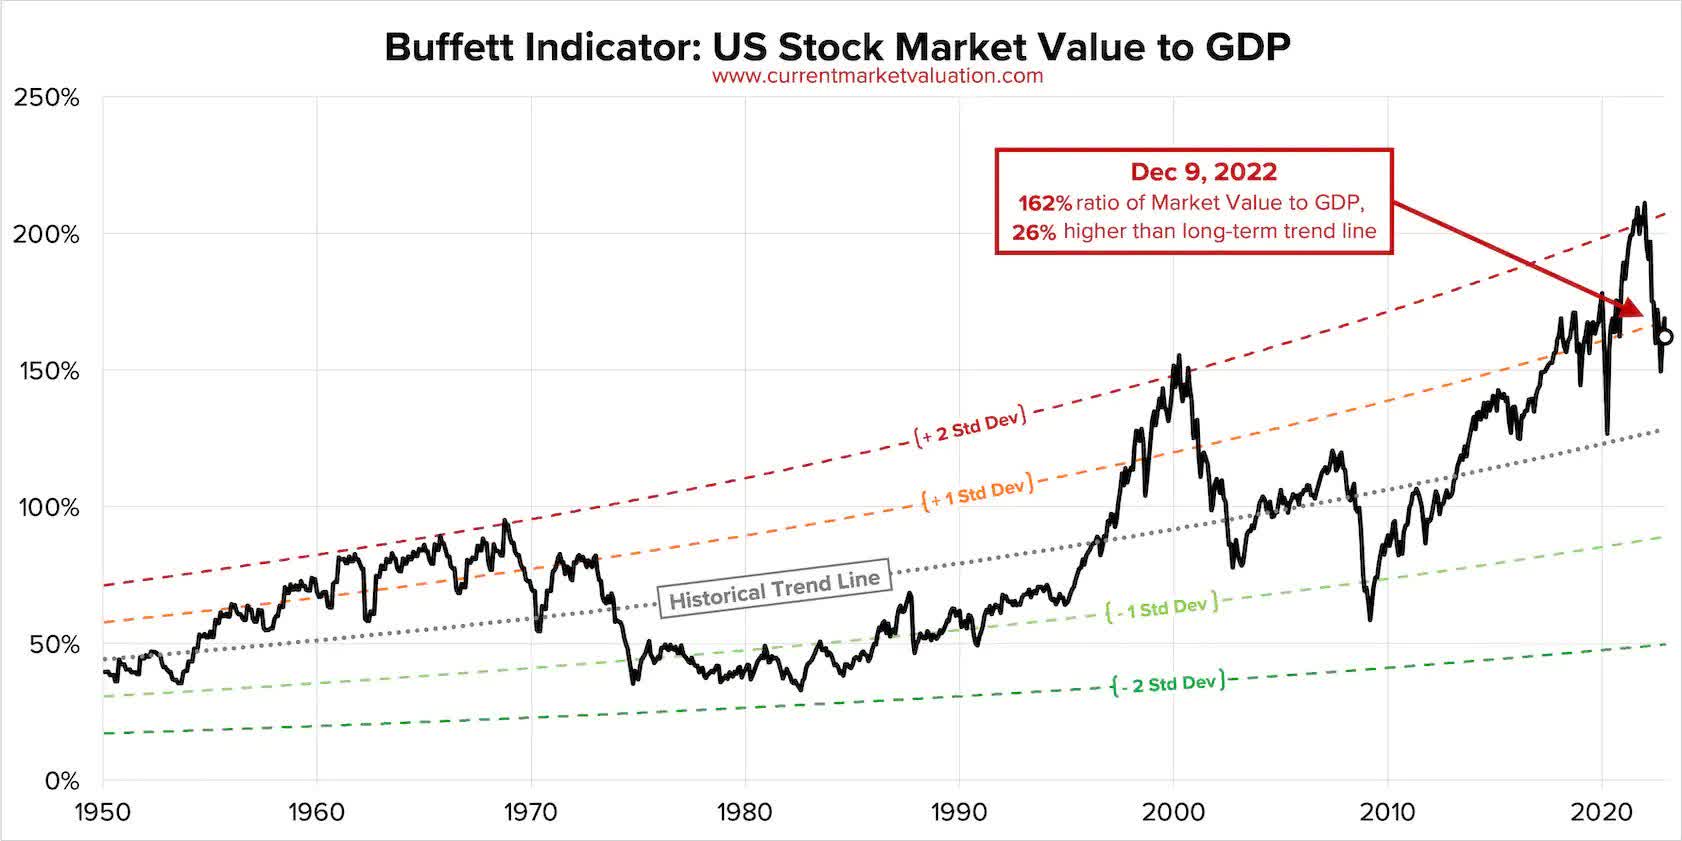
As for the equity market, we currently estimate a total of 40.753 billion. According to the Buffett indicator, equities should trade at 130% of GDP in 2023. In other words, the stock market should be valued at 33.643BN, compared to our current estimate of the equity market standing at 40.753BN. Although the S&P is not the entire stock market, they are still highly correlated at 80%, and should serve as a rough guide.
This means that, to trade around the baseline, stocks would have to lose another 17.45% from current levels. That would place the S&P 500 at about 3164.03.
S&P 500 Historical Earnings
Currently, we are sitting on a fairly nominal P/E for the S&P 500, at 20.04x earnings. But while much multiple compression has already taken place, we think earnings compression is quite underestimated by most analysts. Moreover, in this article we will henceforth use real earnings, i.e., adjusted for inflation, to estimate earnings per share.
Especially given the vastly inverted yield curve and the Federal Reserve’s commitment to keep raising interest rates and “hammering down” inflation at all costs. If we fall into a deflationary recession, the only time that has happened in recent history, in 2008, earnings went from 120.85 in May 2007 to a dismal 9.61 in March 2009, adjusted for inflation. Although this is not a good representation, since the recession was caused by a catastrophic event, and both numbers chosen were extremes.
Federal Reserve (FRED)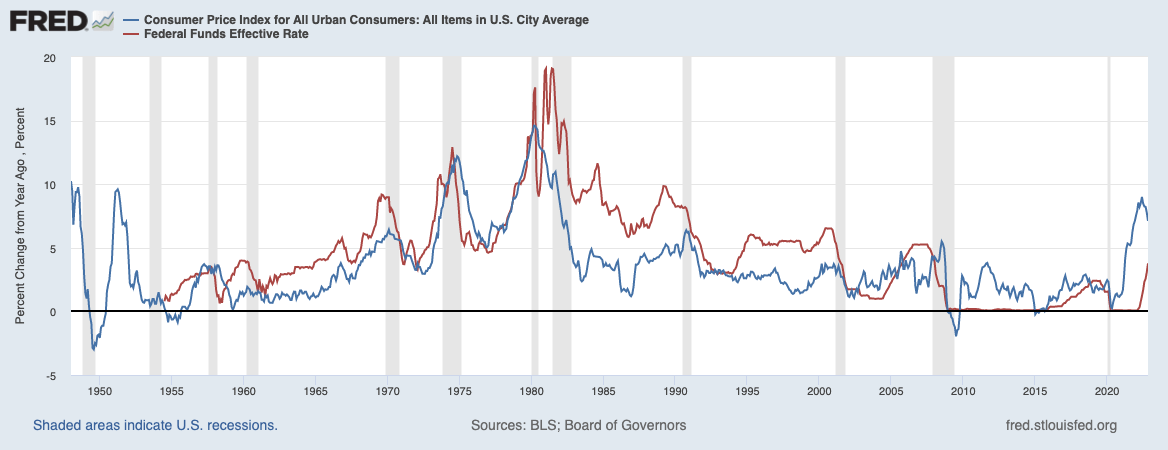
A better representation might be the early 2000s, when the economy was also heating up. That recession was also predicted by many economists because of the boom of the 1990s. Like then, technology stocks were also running hot, perhaps also characterized by the amount of speculation in the cryptosphere in 2021.
Unlike the 2000s, you might call it a better time then, because you didn’t have too much inflation to worry about, and there wasn’t excessive deficit spending. This time, as mentioned earlier, more aggressive action by the Fed could push the U.S. into a worse recession than in 2000. But what happened to earnings during such a recession? Earnings fell from 56.13 in 2000 to 38.85 in 2001, or a 30.79% drop in earnings.
Operating income also fell sharply (note: the graph below has a logarithmic scale, quarterly data).
Yardeni Research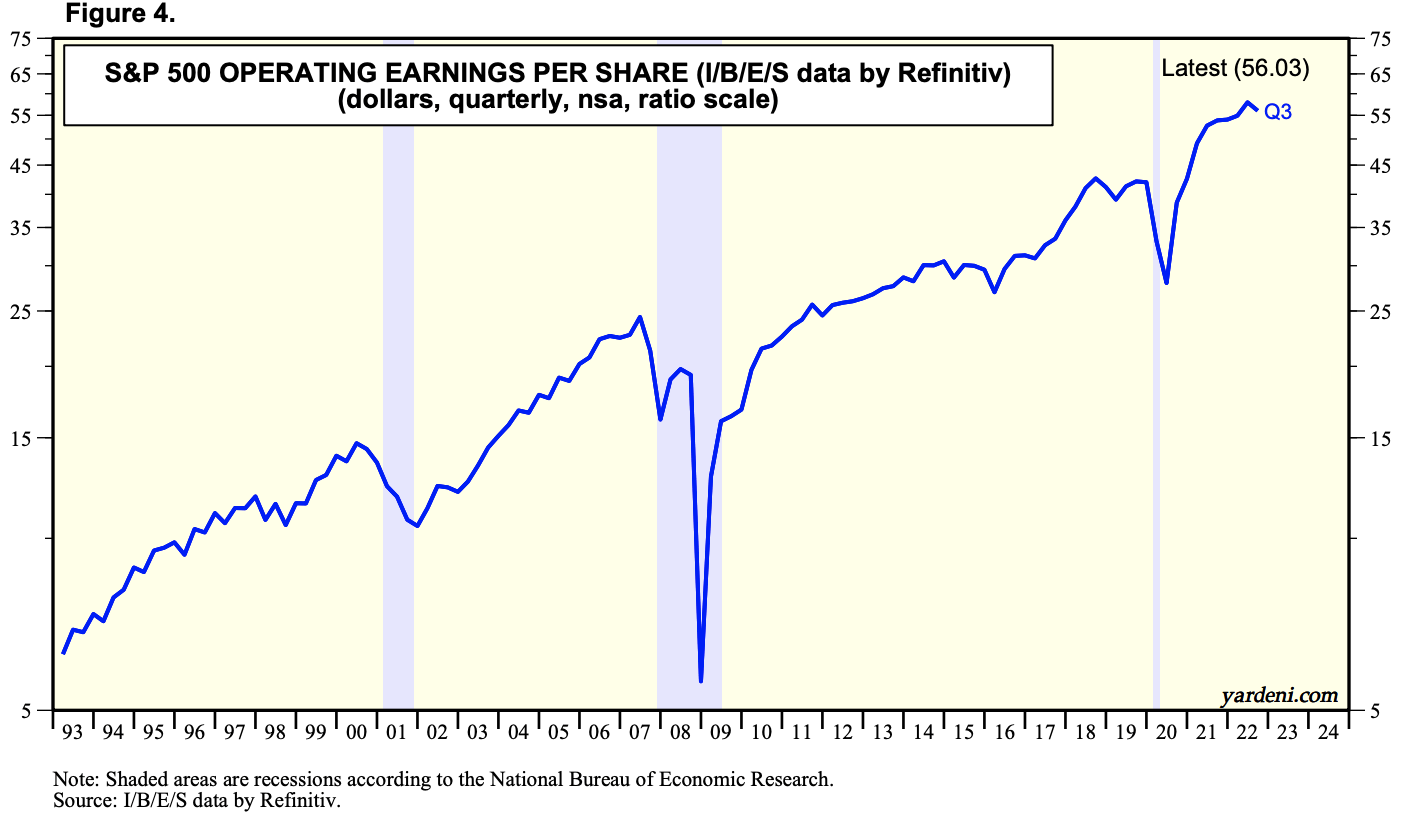
This contrasted with a 20.64% decline in EPS around 1989, when the yield curve also inverted. On the other hand, in the 1980s, profits remained flat for a long time, and only moved from 14.55 in 1979 to about 16.04 in 1987, adjusted for inflation. The big difference here is the stagflation in the 1980s, which gobbled up corporate real-earnings, unlike what we believe will be the case in the 2020s.
Nevertheless, we still expect decent margin compression, like every other time the yield curve inverted and there was a recession. This time it could be fueled mainly by supply chain problems that cause an accumulation of inventory (or excess inventory), leading to even more deflation, as companies and retailers try to run out of inventory and have to cut margins.
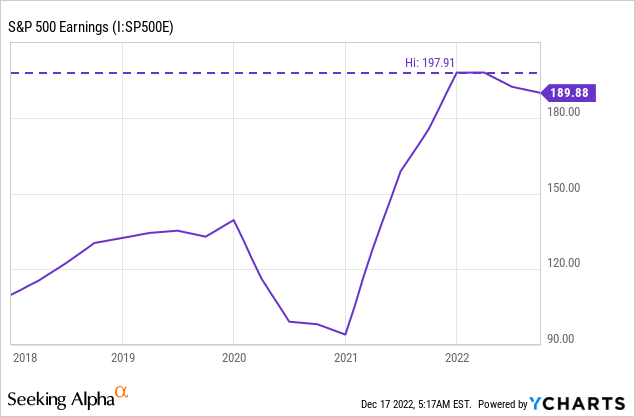
TIKR Terminal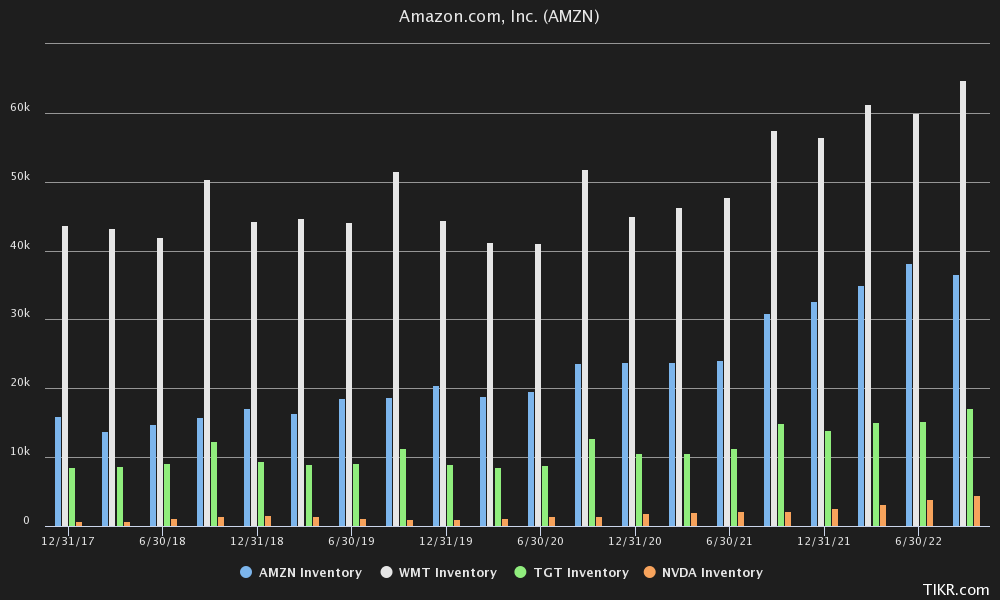
Annualized earnings seem to have peaked at 197.91 in December 2021 and have already fallen slightly to 189.88, which already represents a loss of 4.06%. Note, however, that monthly data can fluctuate very widely. In September 2000, the S&P was at an 92.13 annualized EPS, compared to merely 41.17 at a March 2001 annualized rate, although the annual decline from 2000 to 2001 was only 30.79% when accounted for all 12 months.
We currently estimate that earnings for the S&P 500 in fiscal year 2022 will be about 188 annualized (already adjusted for inflation), taking into account first-, second- and third-quarter data and taking last year’s fourth-quarter data and subtracting a couple percent to account for margin pressures due to slower economic growth and margin pressures due to excess inventories in 4Q of this year. Given past recessions discussed earlier, we think a 9% haircut to FY2023 EPS adjusted for inflation is very reasonable in a historical context.
Looking ahead, we think margin compression, weak consumer sentiment, purchasing power eroded this year coupled with falling inflation and the Fed raising interest rates for longer in a recessionary environment are also sufficient reason for a drop in earnings per share in 2023. A 9% decline would bring earnings per share in 2023 to 171.08, fully adjusted for inflation.
While some may see this as overly bearish, according to FactSet data over the past 25 years, analysts have overestimated final EPS in 17 of those 25 years. They also overestimated this final EPS by 7% a year in advance, so we don’t think those numbers from analysts can really be taken at face value.
And this was especially true in recessions. These bottom-up EPS estimates at the beginning of the year and the final EPS figure for the same year exceeded 25% in those recessions. They overestimated EPS by 36% in 2001, 43% in 2008, 28% in 2009 and 27% in 2020. As in 2000, analysts see an inverted yield curve, rising federal interest rates and still release a very rosy forecast for year-end. We just don’t believe it.
Multpl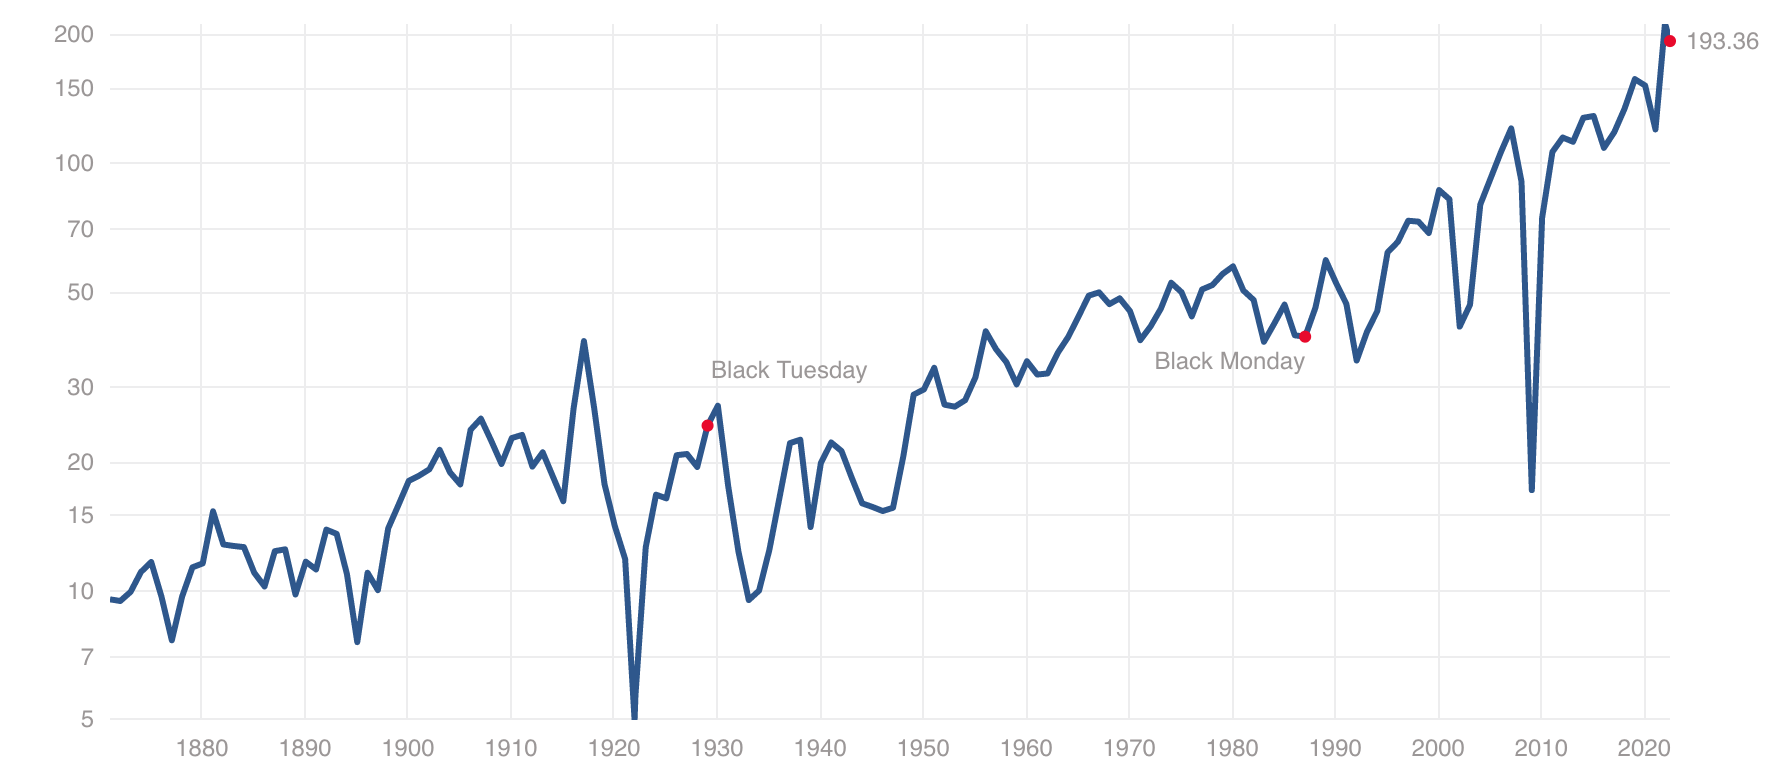
JPMorgan, for example, set its earnings forecast at 225 and lowered it to 205 a few weeks ago, a 9% reduction. Such large deviations in such a short period of time do not sound credible.
Now that we have our EPS of 171.08 for fiscal year 2023, we apply a P/E ratio of 18x, which is still above the historical average of 15.99, to at least account for some compression from the current P/E of 20.04x. In our view, a P/E of 20.04x is extraordinarily high for an environment where the Federal Funds rate ends up at over 5% and the 2-year risk-free rate is at 4.18%.
And that brings us to our final value of 3079.44 for the S&P 500 2023. Returning to our estimate for the Buffett indicator, it is also close to that estimate of 3164.03 and seems serviceable to us.
Multpl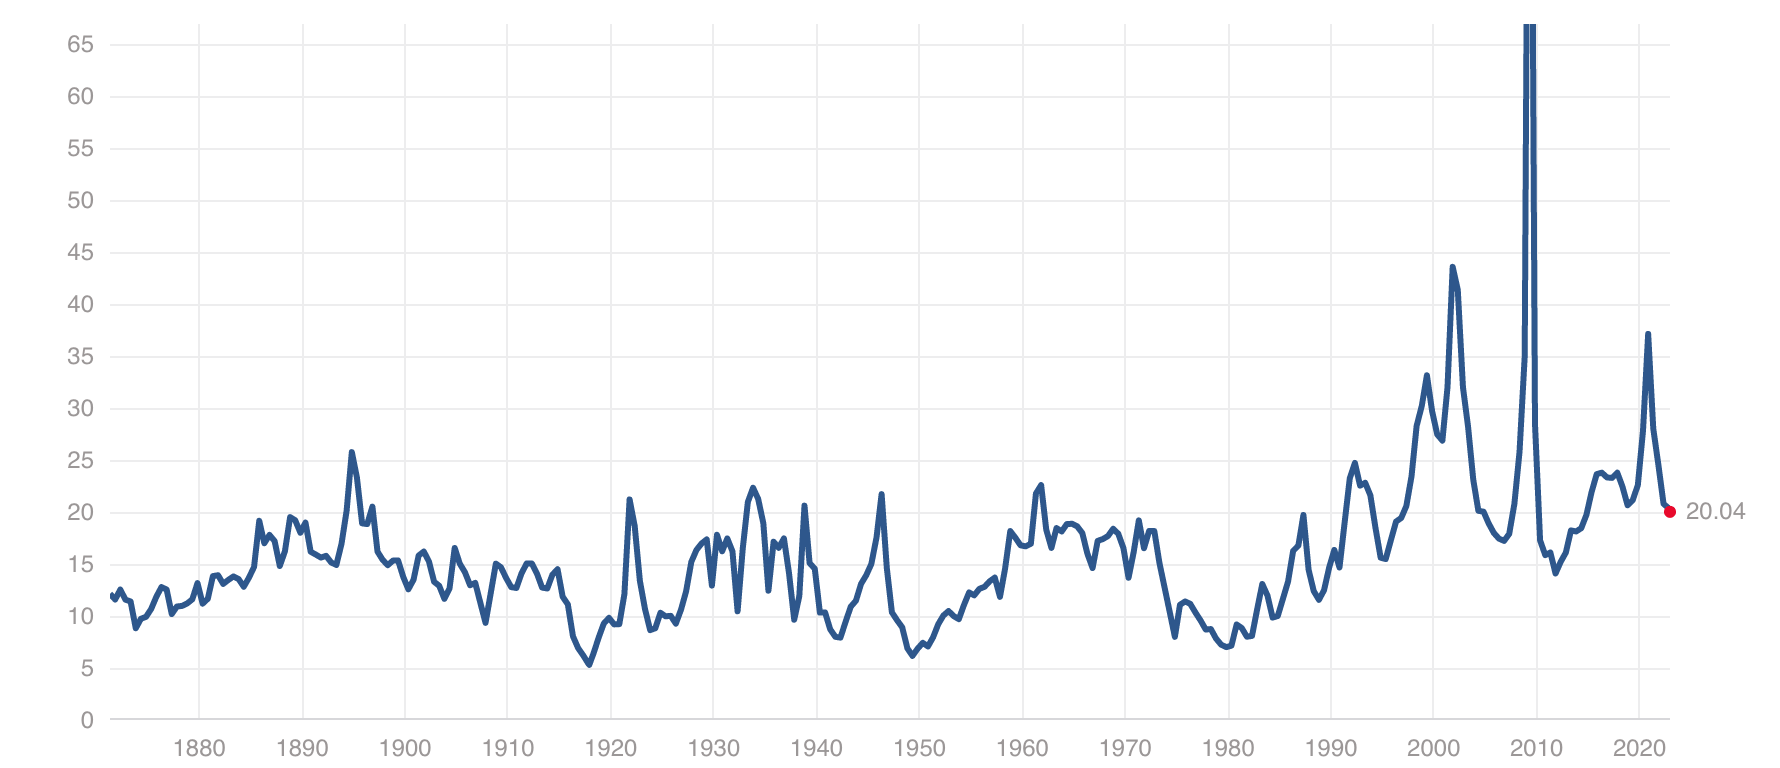
Other Factors
An important factor we also want to bring in here is that the S&P 500 may have overshot in recent history as a result of the Federal Reserve’s excessive monetary policy (including QE), leaving investors with few options besides equities to deploy their capital.
Such as 30-year bonds, which have rallied relentlessly for 40 years since the 1980s, and did not show a trend reversal until 2020. Bonds that are starting to look more and more attractive to investors may accelerate outflows from stocks.
Federal Reserve (FRED)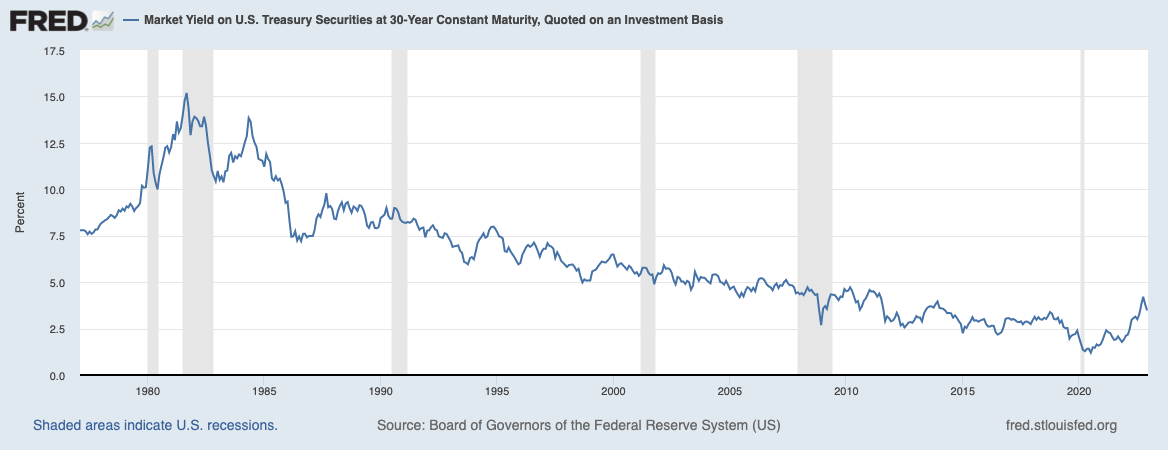
In terms of economic health, we also like to define the economy by manufacturing, or the S&P Global US Manufacturing PMI, or Purchasing Manufacturing Index. This index is based on a monthly survey of supply chain managers in 19 industries.
It has fallen dramatically in recent months, due to previously described problems, including massive supply chain imbalance and excess inventory, as most supply chains continue to have nonlinear complexity, and are more sensitive to economic shocks than previously expected.
According to the survey, new orders fell at one of the sharpest rates since the 2008-2009 financial crisis. They reported that they had adequate inventories and that new orders fell sharply.
Tradingeconomics
And again, to confirm our view in terms of earnings compression, note that compression is already underway, despite the fact that the monetary tightening, which takes about 18 months to be fully felt, is not yet very palpable. If the Fed continues to raise until early next year, most of the pain could come by the end of the year, unless the Fed does not cut interest rates at all in 2023, which we believe could lead to a wrenching recession that runs well into 2024.
In both the early 2000s and 2008 and 2020, the yield curve reversed, leading to a recession (albeit a short one in 2020) and then a noticeable decline in profit margins/reported earnings per share.
Yardeni Research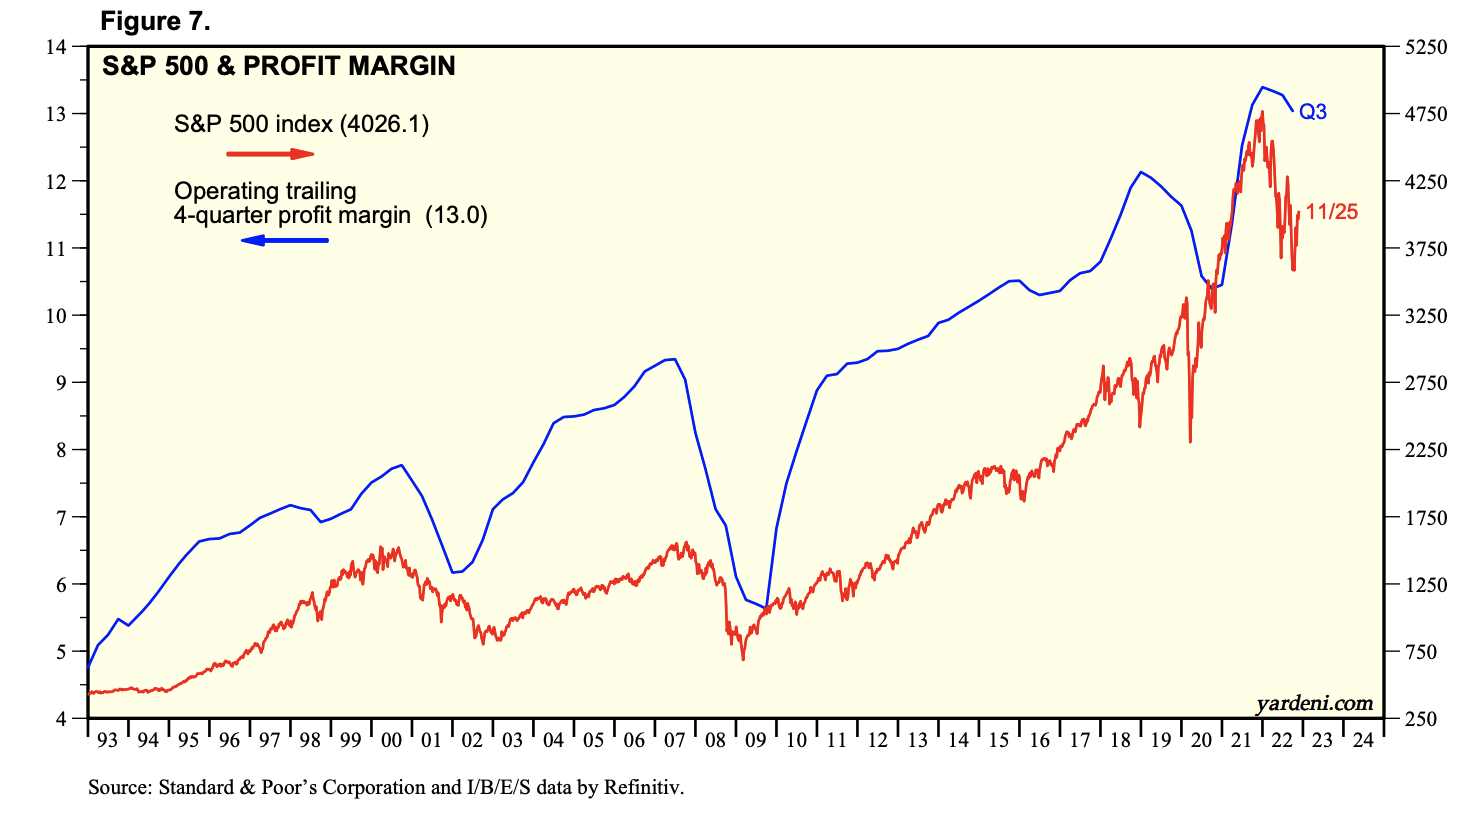
It may also take less than some analysts have used in their estimates to see earnings compression, taking into account operating margins. As mentioned earlier, earnings per share fell 30% in the early 2000s, and looking at operating profit margins, they appear to have fallen only about 2% between 2000 and 2002 on a rolling basis.
Yardeni Research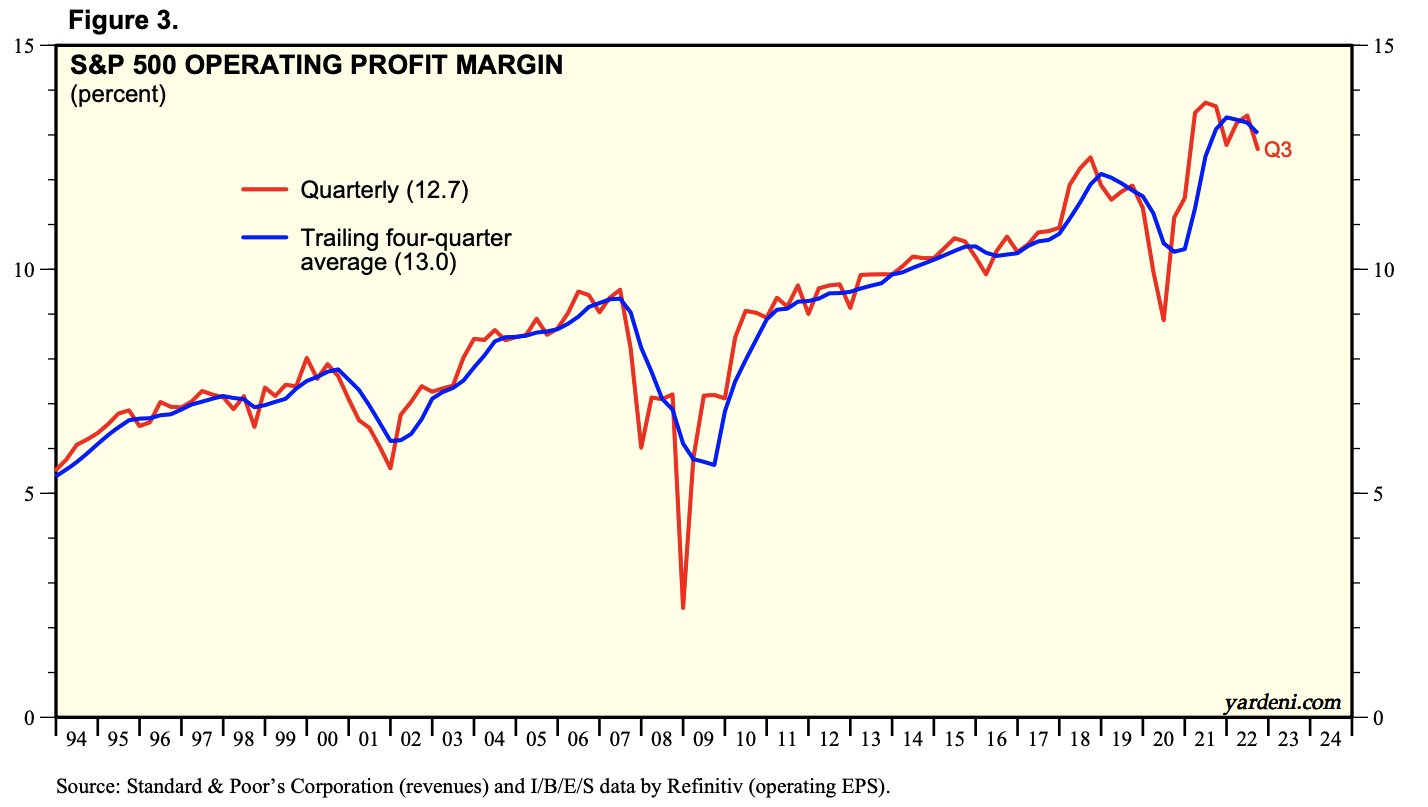
We firmly believe, as we have pointed out before, that one of the reasons for this surge in inflation is also closely related to the insane amount of fiscal stimulus injected into the system during the pandemic. This is in stark contrast to the 1980s, when the U.S. was in a prolonged deficit, when it was “guns and butter.”
The massive influx of fiscal stimulus and deficits that the economy has suffered over the past 2 years will not be sustained, and should return to baseline in the near future.
Federal Reserve (FRED)
Technical Analysis
We usually base our analysis only on fundamentals and intrinsic value, but want to add some bare-bones technical analysis as well. We used the Fibonacci Retracement on a multi-year chart, and the pandemic bottom as support, and December 2021 as our top.
Our estimate of 3079.44 would mean that the S&P 500 breaks through the 50% level on our Fibonacci Retracement, from which it previously bounced off, and then would have to retest the 38.20% level, or 3151, which is also close to the pre-pandemic top of 3243.
Author’s Charts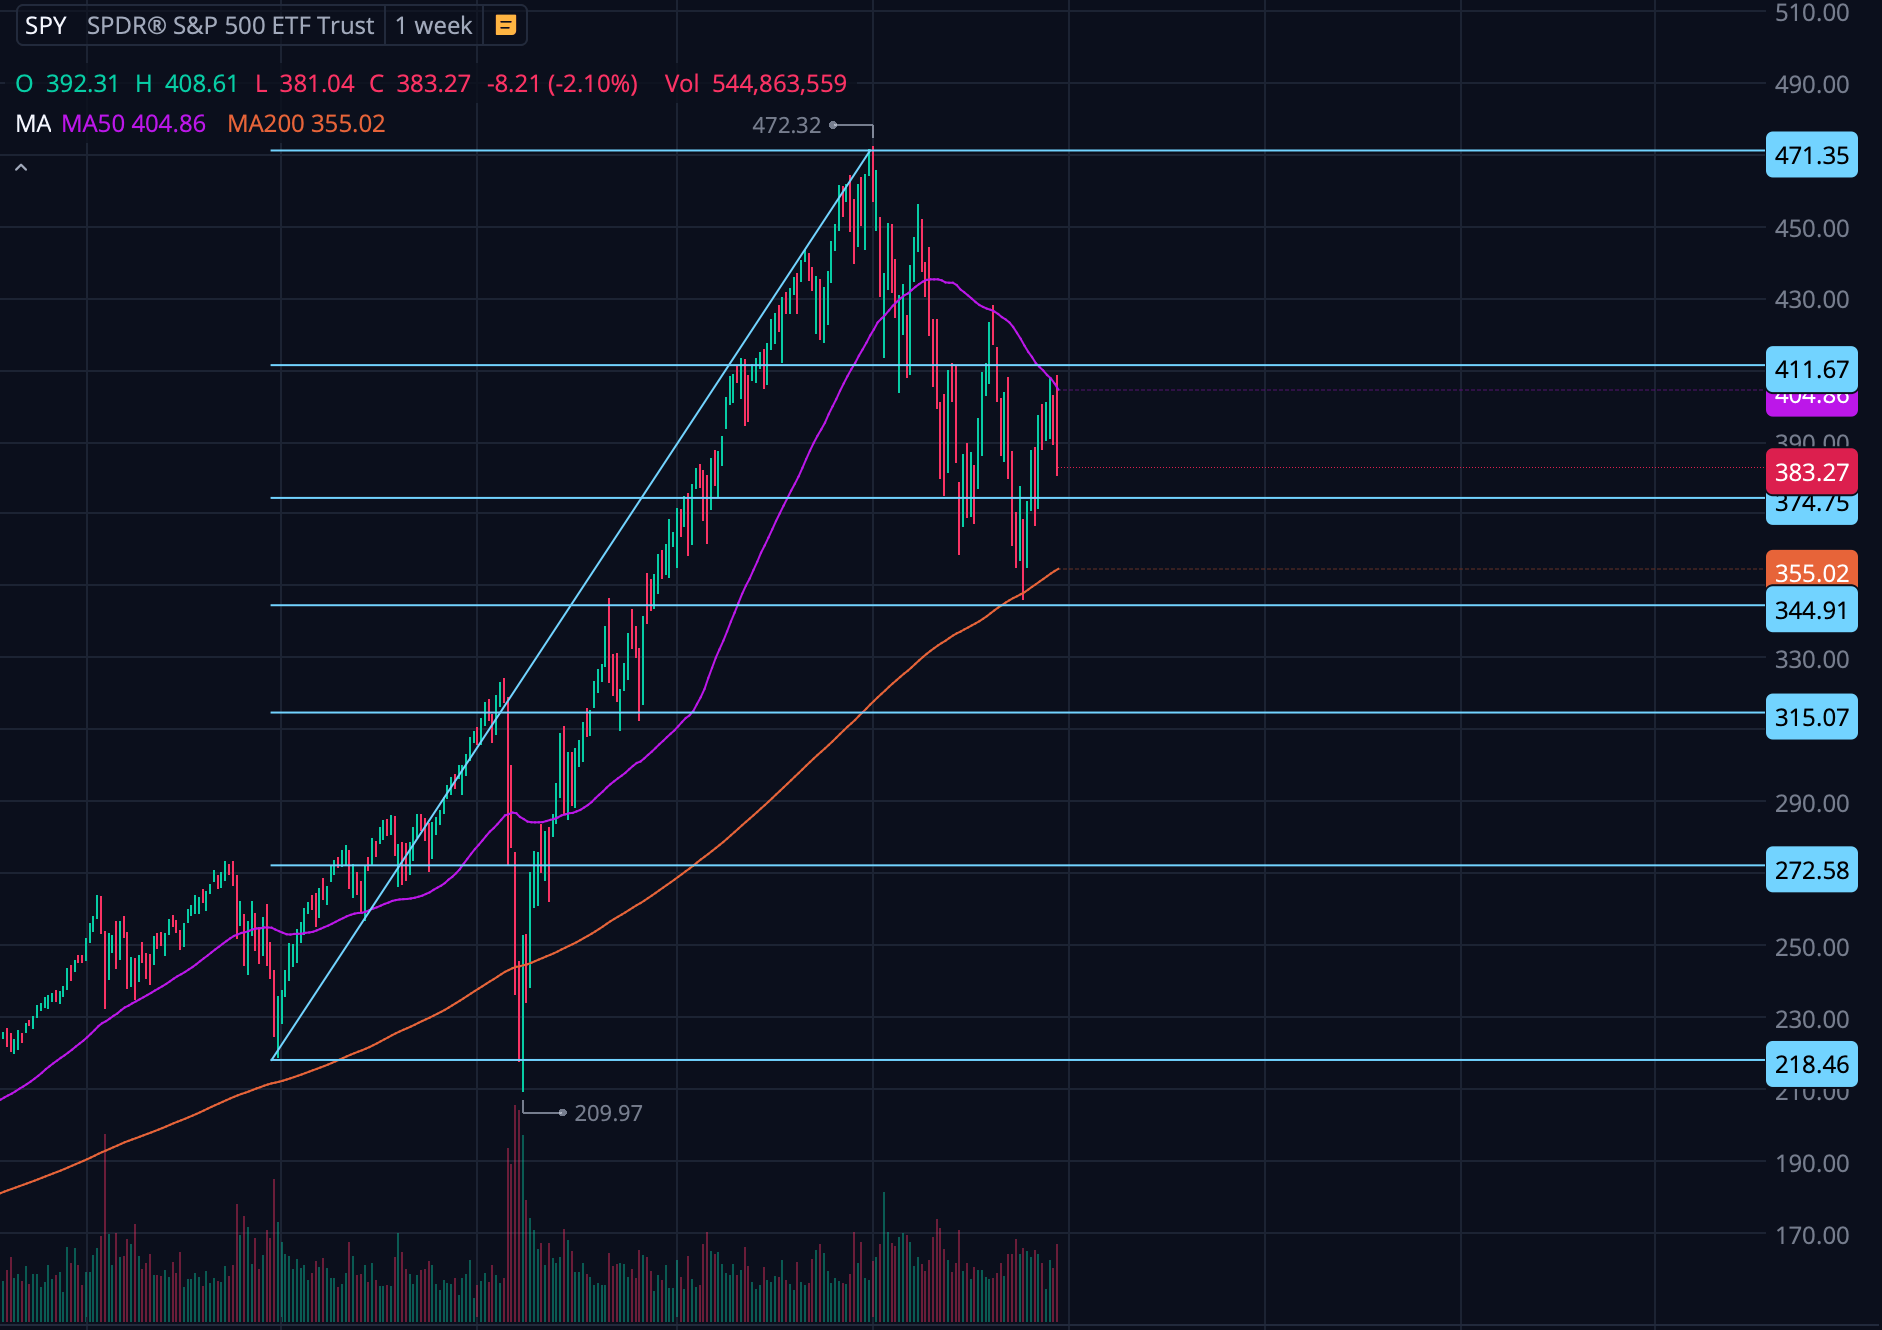
Technically, therefore, the price could end slightly higher around 3243 and bounce off support, or fall directly to 2725, or the 23.60% retracement level. However, for this analysis, we maintain our FY 2023 price target of 3079.44.
Risks To Our Thesis
There are both risks that the S&P 500 will perform better/worse than our target. We discuss both the bullish and bearish case.
Bearish Case:
- Earnings per share contracts more than 9%, closer to 30% as in 2000, an earnings recession that caused a huge contraction.
- P/E multiples shrink even more and may move closer to or below the historical average of 15.99 due to higher bond yields and discount rates.
- In the longer term, a 1980s scenario in which economic shocks continue to cause inflation spikes, with the Fed reacting even more aggressively the second time around.
- Worst-case scenario: a deflationary recession, as we have only experienced in 2008, due to a Federal Reserve maintaining higher terminal interest rates despite deflation and an economic recession already being underway.
- A prolonged series of shutdowns in the Chinese economy, as previously observed, causing continuous disruption in the supply chain.
- Another massive round of deficit spending, for whatever reason could pose a serious threat, spiking inflation again.
Bullish Case:
- The Federal Reserve reverses interest rates much sooner than expected if lagged data comes in much lower than expected, clearly indicating serious deflationary threats.
- Inflation is driven almost entirely by supply chain shocks, a quick turnaround by the Fed, and a return to the 2010-2019 era of low interest rates and low inflation.
- An economy that is more resilient than average, not experiencing the drastic slowdown effect of unemployment as before.
- Technological innovation that improves labor productivity and alleviates shortages with new key technologies such as AI, Machine Learning and Robotics & Automation.
- A possible reversal of QT, supporting and stabilizing the bond market.
The Bottom Line
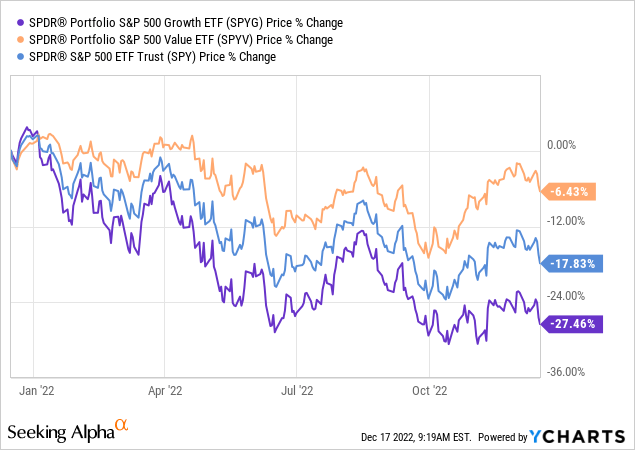
2022 was a difficult year for equity investors. Especially for investors in growth stocks, innovation and technology in general, as most were priced at steep multiples.
While much work has already been done in terms of multiple compression, we have yet to see how much earnings compression will come, as we are almost certainly entering a recession soon. Our year-end estimate of 3079.44 for the S&P 500 seems reasonable to us and is based on sober analysis and historical data that contradicts analysts’ estimates.
And while we believe the indications still have “some ways to go,” as Powell likes to define it, we believe there are plenty of value stocks trading at attractive discounts in terms of EV/EBITDA and P/FCFE multiples, making this a stock picker’s market in our view.
Editor’s Note: This article was submitted as part of Seeking Alpha’s 2023 Market Prediction contest. Do you have a conviction view for the S&P 500 next year? If so, click here to find out more and submit your article today!
Be the first to comment