Konoplytska/iStock via Getty Images
In recent years, one of the major arguments made for equity market bulls was the fact that there was no alternative (TINA). TINA was a tough strategy to argue against, as fixed income markets were offering incredibly low, if anything in the way of yields, especially relative to inflation expectations. However, the Fed’s hawkish pivot has caused yields to tick significantly higher, reaching the highest level in about a decade in early June. This certainly changes the investment landscape, as alternatives to equities become more attractive and the discount rate used to revert future corporate cash flows to present-day dollars increases.
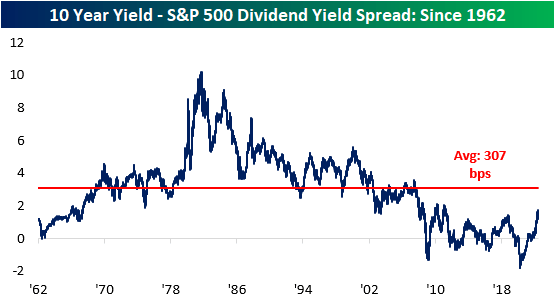
The 10-year Treasury note is now offering investors a yield of 3.4%, which is more than 2 times higher than the level at the start of the year. Notably, the current 10-year yield of 3.4% is 172 basis points higher than the dividend yield of the S&P 500 (which is 1.6%). This widening spread decreases the attractiveness of equities and increases the appeal of fixed-income assets, which can lead to further downside in the S&P 500. Although the spread has moved significantly higher as of late, it is still compressed relative to historical averages, meaning that yields could still rise further and the spread between long-term Treasuries and the S&P 500’s dividend yield would be narrower than the long-term average.
10-Year Yield – S&P 500 Dividend Yield Spread: Since 1962 (Author)
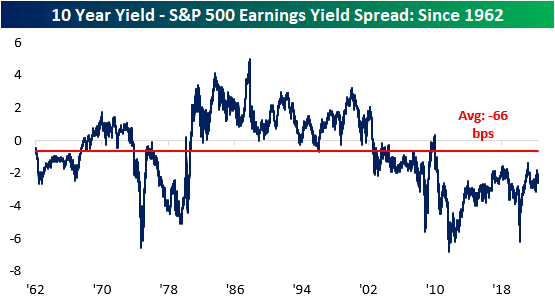
Another metric worth tracking is the earnings yield of the S&P 500 versus the 10-year yield. The earnings yield (the inverse of the P/E ratio) is currently 218 basis points higher than the 10-year yield. If this spread were to turn negative, it would imply that risk-free assets would be generating superior earnings than riskier equities. Nonetheless, the S&P 500 earnings yield is still well above that of the 10-year yield, so equities do still appear attractive on an absolute basis, implying that investors are still being compensated for the excess risk taken by investing in public equities. Throughout history, there have been periods where the earnings yield was less than the 10-year yield for extended periods of time, and while this would seem counterintuitive, unlike fixed income, where capital appreciation is capped, capital appreciation for equities is theoretically unlimited.
10-Year Yield – S&P 500 Earnings Yield Spread: Since 1962 (Author)
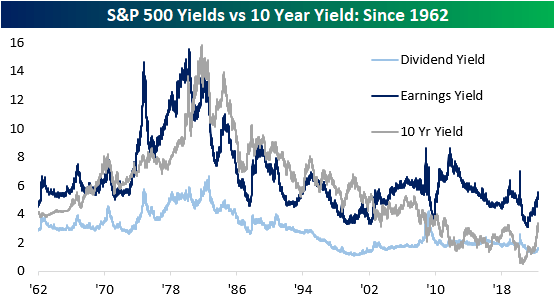
The chart below aggregates the S&P 500 earnings yield, dividend yield, and the 10-year Treasury yield. As you can see, the earnings yield has been higher than the Treasury yield since 2002. The tightening of this spread decreases the attractiveness of equities relative to 10-year Treasuries, which we have seen occur over the last several months.
S&P 500 Yields Vs. 10-Year Yield: Since 1962 (Author)
Editor’s Note: The summary bullets for this article were chosen by Seeking Alpha editors.


Be the first to comment