

DarioGaona
Q2 Production & Sales
I wrote on Pan American Silver (NASDAQ:PAAS) just over a month ago, noting that pullbacks below $18.15 would present a buying opportunity, given that quite a bit of negativity was already priced into the stock. This turned out to be a terrible call, with the Q2 report coming in much weaker than I anticipated, with a write-down at Dolores, an upwards revision to gold cost guidance, and lower revenue due to negative pricing adjustments. The result was a sharp decline in operating cash flow and negative earnings, a significant deviation from the past two years.
While this certainly doesn’t inspire confidence, Q2 was a kitchen sink quarter for many miners, and we may have seen peak costs in Q2 with some commodities pulling back from their highs. Based on this, I don’t believe it makes sense to judge most miners on their Q2 reports, given that this is likely to mark a high point for costs and a low point for margins. In addition, many miners have exited Q2 with half-off sales on their shares, creating the conditions for a bottom in the better-managed names. PAAS is one of these names and now trades at its most attractive levels since March 2020.
Pan American Silver released its Q2 results last month, reporting quarterly production of ~4.54 million ounces of silver and ~128,300 ounces of gold. This translated to a 1% increase in silver production year-over-year, offset by a 10% decline in gold production. The sharp decline in gold output was related to Dolores, Manantial Espejo, and La Arena, with these assets combining for just ~58,000 ounces in the quarter, down from ~75,000 ounces in Q2 2021. It is worth noting that there was a minor headwind from Morococha, which was placed on care & maintenance in Q1. Still, with just a 300-ounce contribution, this was hardly a significant factor contributing to lower production.
Pan American – Gold & Silver Production (Company Filings, Author’s Chart)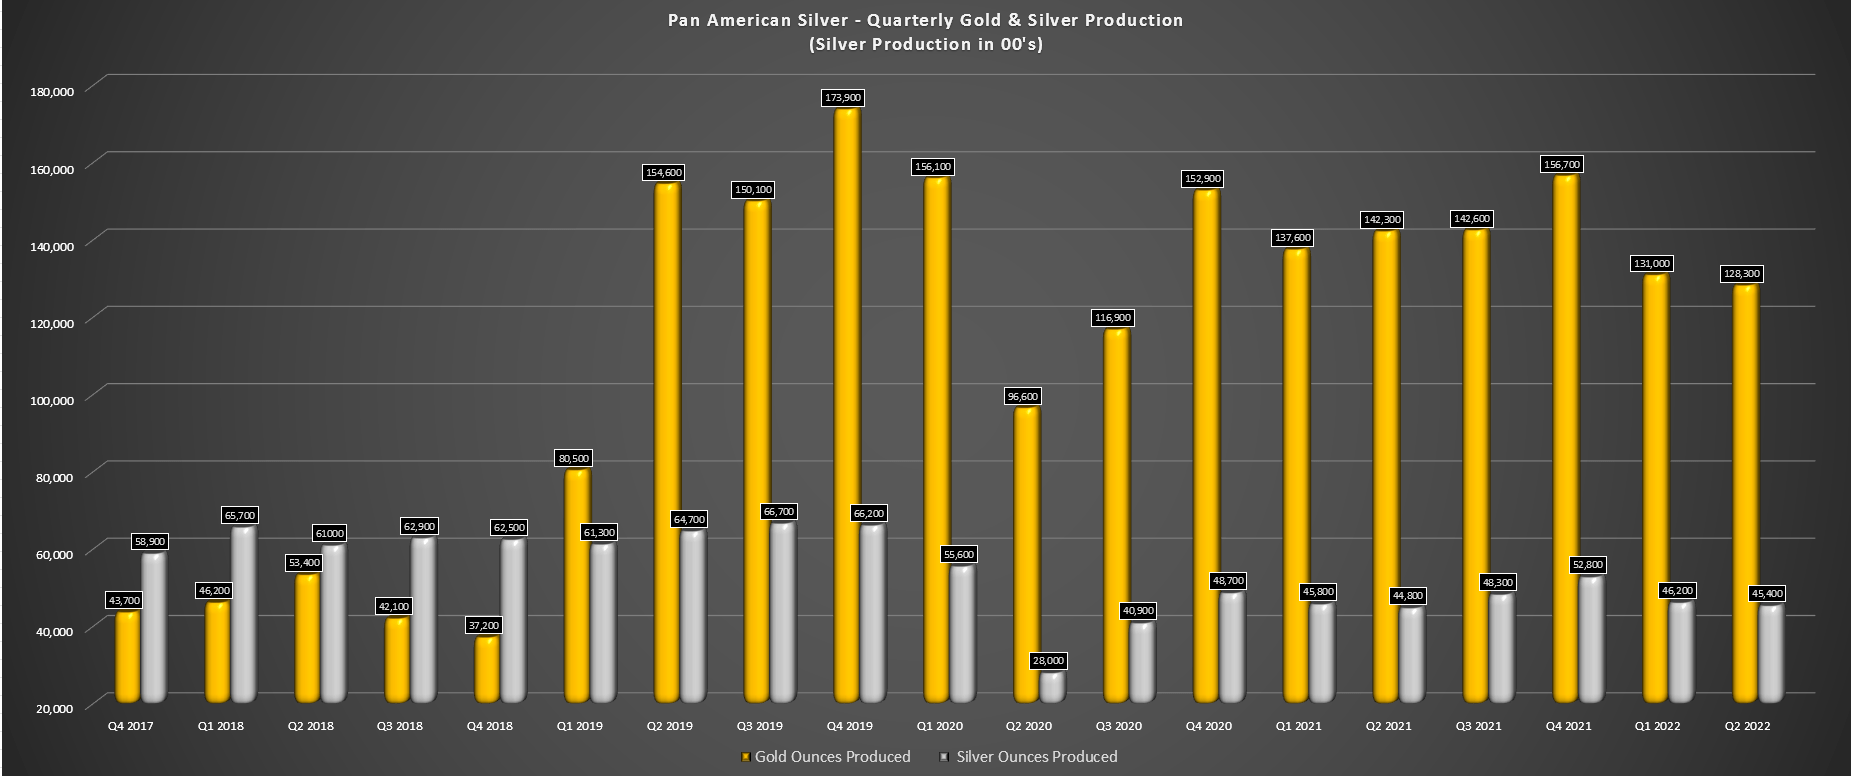
Fortunately, the results were solid in the silver segment, with Pan American’s flagship La Colorada Mine putting together another strong quarter. This was evidenced by the production of ~1.68 million ounces of silver, helped by significantly higher throughput and silver grades (338 grams per tonne of silver vs. 298 grams per tonne of silver). The increase in throughput was related to improved ventilation rates that boosted mining rates and provided access to higher-grade zones, and working conditions should improve further in Q3 with the refrigeration plant operating as of Q3.
La Colorada Production (Company Filings, Author’s Chart)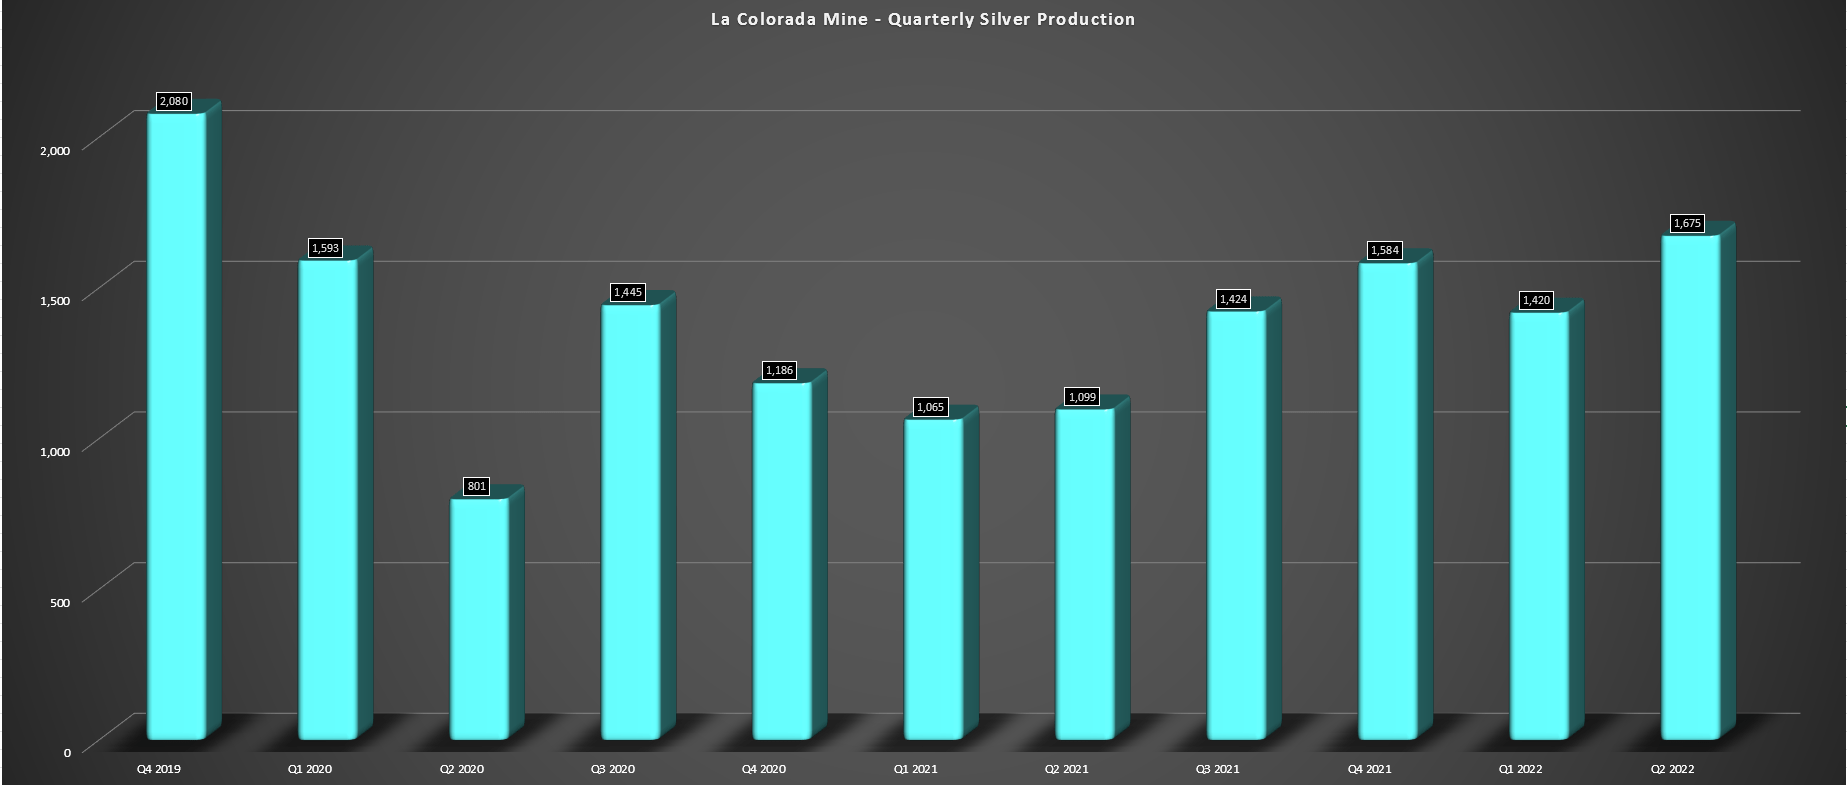
Looking at other silver mines in the portfolio, production at Huaron was relatively flat, and production increased at Manantial Espejo and San Vincente. Unfortunately, this was offset by Morococha going into care and maintenance as planned. Finally, La Arena saw lower gold production due to lower grades, as did Dolores, related to mine sequencing. However, the bigger issue at Dolores was the negative grade reconciliation related to Phase 9B of the open pit, with high-grade intercepts from drilling not realized during mining. This suggests that these intercepts contributed to a localized overestimation of contained ounces in the pit, with the resource update adjusting for this overestimation.
The negative news on Dolores was made worse by the company’s announcement that it had suspended underground mining operations due to inflationary pressures, which led to underground reserves being moved back into the resource category. Following these negative developments, Dolores’ mineral reserves are down to 17.0 million tonnes at ~0.58 grams per tonne of gold and ~20 grams per tonne of silver, or just ~313,000 ounces of gold. This is a sharp decline from ~650,000 ounces last year at 0.75 grams per tonne of gold and 24 grams per tonne of silver. The resulting ~$99 million impairment led to a significant consolidated net loss in the period ($0.83) vs. (+) $0.34 in Q2 2021.
The good news is that higher metal prices could pull ounces back into reserves down the road, and the company is keeping the ventilation and ground control systems in place. The other good news is while the reserve deletion was certainly a negative, this is one of many assets, so this news isn’t nearly as severe as it might be for a company with less than five mines. It’s also worth noting that while it’s still early to be overly optimistic, Pan American has made some progress at the massive Escobal Mine that’s been shuttered since 2017, with talks moving from the pre-consultation stage to the consultation stage as of July 2022.
Pan American Silver – Quarterly Revenue & Metals Prices (Company Filings, Author’s Chart)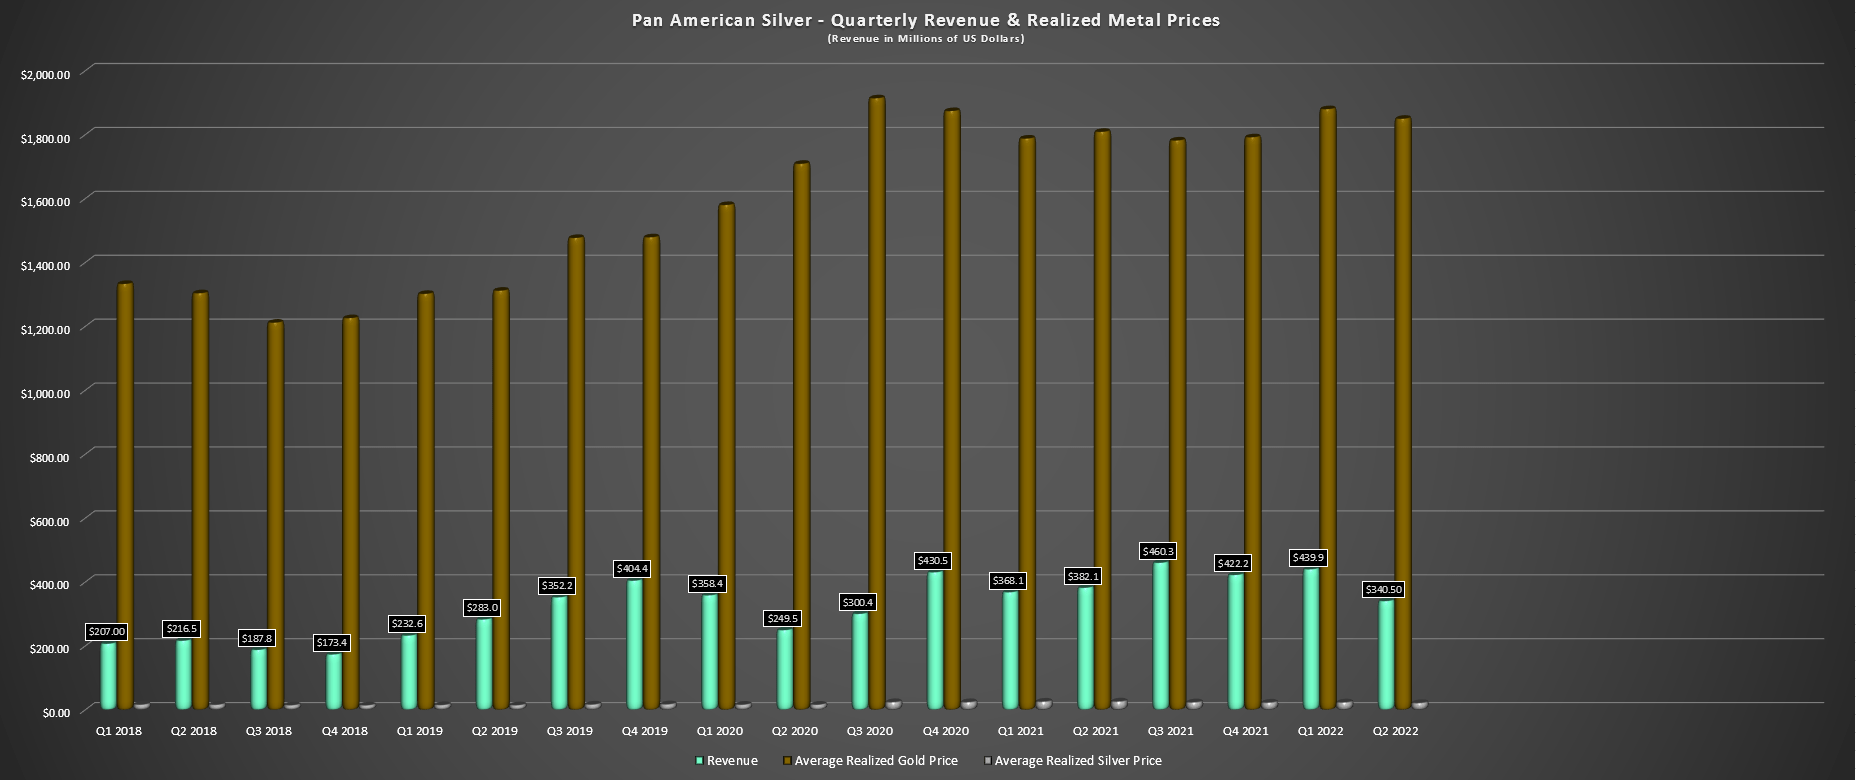
Looking at sales, revenue fell 11% year-over-year, coming in at just $340.5 million. This was related to lower silver prices ($22.03/oz vs. $26.88/oz) and negative pricing adjustments of $9.3 million. Unfortunately, it doesn’t look like revenue will improve much in Q3, given that gold and silver prices have continued their slide, with silver having the potential to average less than $20.00/oz in Q2, and the average realized gold price likely to come in below $1,780/oz. The lower revenue combined with weaker margins resulted in a sharp decline in earnings, with an adjusted net loss of $6.5 million or $0.03 per share, down from net income of $46.6 million in the same period.
Costs & Margins
Moving over to costs and margins, Pan American had a tough quarter. impacted by inflationary pressures like the rest of its peer group. The company called out cyanide, explosives, steel, and diesel areas where it saw pressure in the quarter, exacerbated by lower grades at its Dolores, La Arena, and Shahuindo gold operations. Based on inflationary pressures, a decline in gold sales volume in the period, and net realizable value [NSR] inventory adjustments, all-in-sustaining costs in its gold segment soared to $2,051/oz. That said, on an adjusted basis, costs came in at a more respectable level of $1,540/oz.
While these costs are certainly not pretty, it’s important to note that this will mark the highs for the year, and as stated earlier, this is about as bad as it should get given the unfavorable combination of lower production volumes and what could end up being peak inflation in some commodities. In fact, despite the ugly H1 cost performance, all-in-sustaining costs for its gold segment have been revised to $1,475/oz at the mid-point, which is largely related to much higher capital spending than planned at its Peruvian operations combined with the weaker grades at Dolores.
Pan American Silver – All-in Sustaining Costs & AISC Margins (Company Filings, Author’s Chart)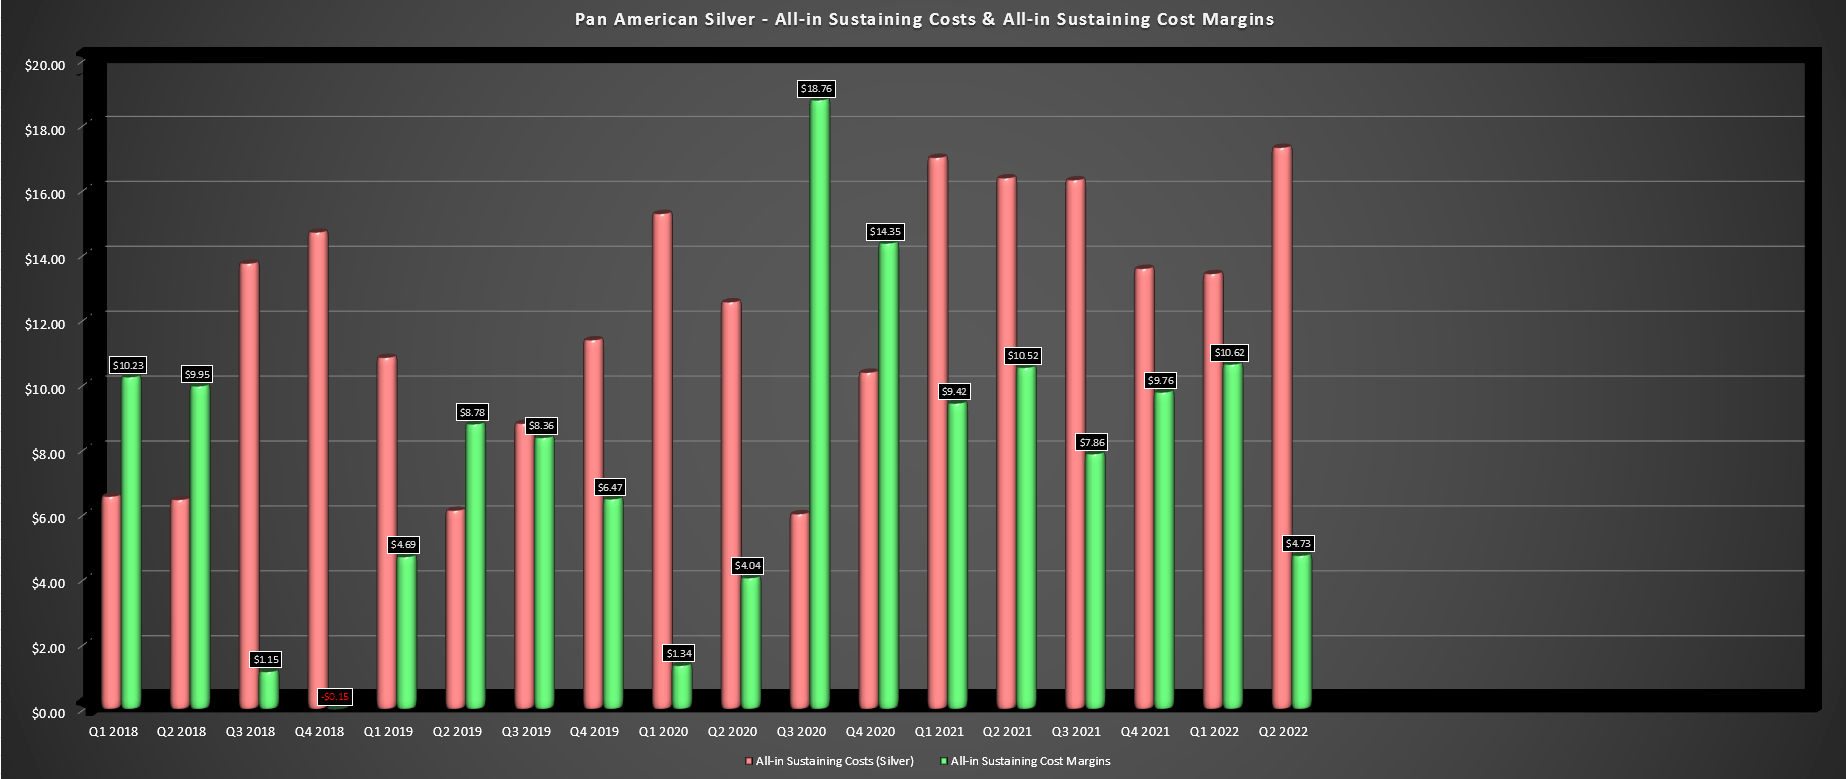
If we move over to the silver segment, cost performance wasn’t much better, increasing from $16.36/oz to $17.30/oz. However, this also included a negative impact from NRV inventory adjustments, with costs lower year-over-year at $15.90/oz for its silver segment after excluding these impacts. That said, the lower costs were largely due to being up against easy year-over-year comps (Q2 2021 AISC: $17.23/oz), so the cost performance is hardly anything to celebrate. Combined with a sharp decline in the silver price, AISC margins for its silver segment plunged to $4.73/oz from $10.52/oz or $6.13/oz on an NRV-adjusted basis.
Pan American Silver – Quarterly Operating Cash Flow & Dividend (Company Filings, Author’s Chart)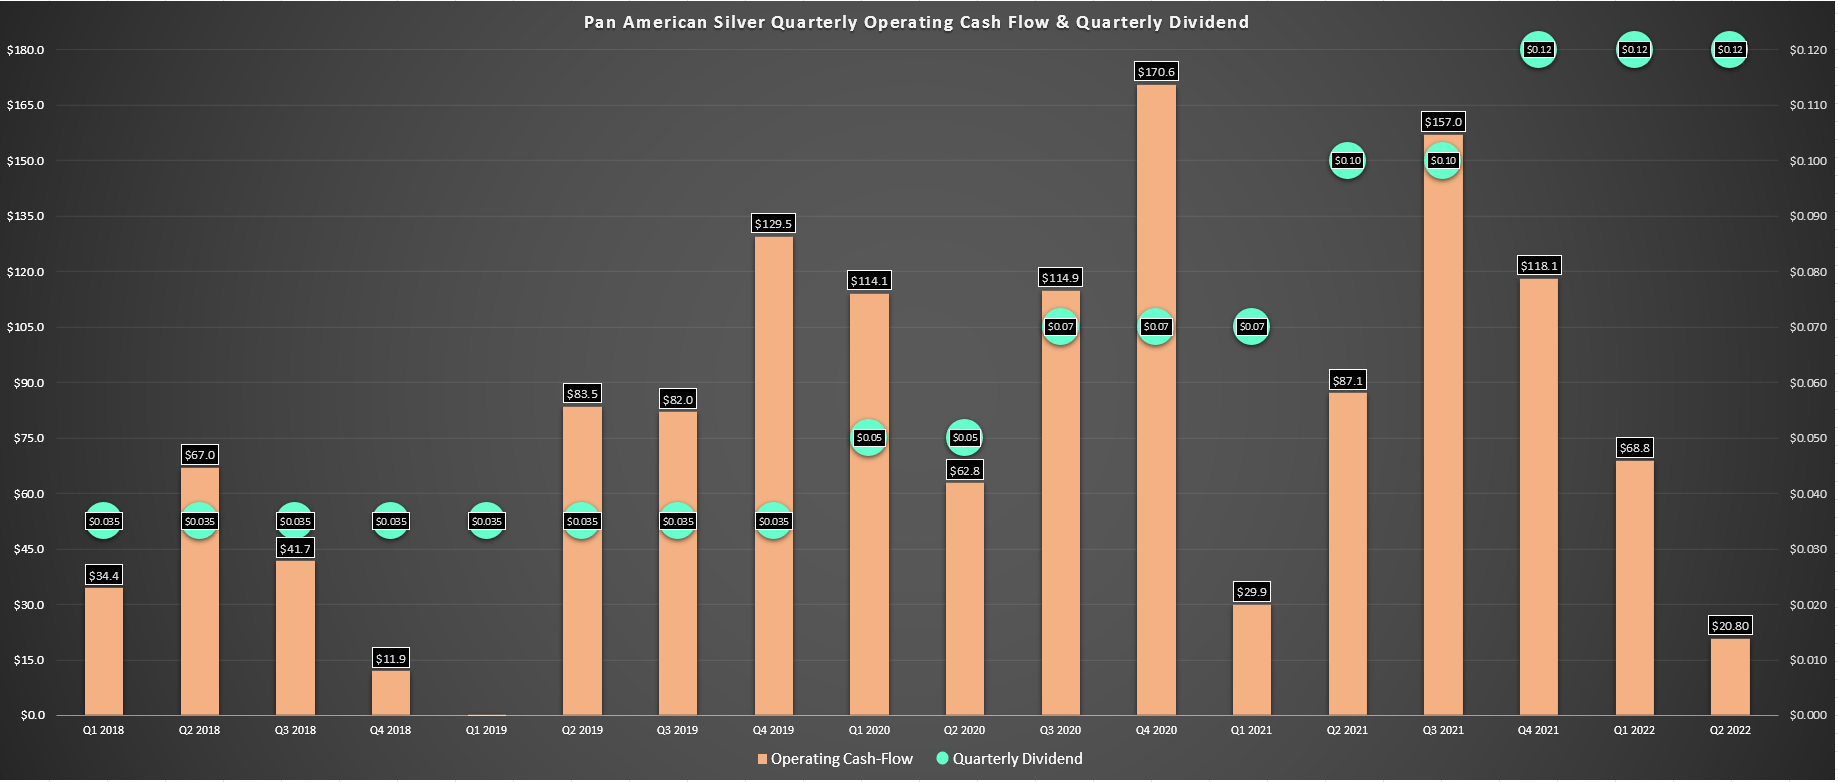
Given the weaker margins and lower revenue, operating cash flow sunk to just $20.8 million, a more than 70% decline year-over-year. That said, Pan American has maintained its industry-leading dividend in the silver space (~2.80% annualized) and finished the quarter with working capital of over $510 million, and $131 million in net cash, giving it a much stronger balance sheet than many of its peers despite the very weak first half of the year. This could potentially support a small M&A transaction if depressed valuations remain in place across the sector, though given the success at La Colorada Skarn, this could be the better use of capital.
La Colorada Skarn
While the Q2 results were certainly worse than I expected, Pan American did release a phenomenal update from La Colorada Skarn recently. This was the announcement that its resource had grown to ~227 million ounces of silver, ~6.1 million tonnes of zinc, and ~2.7 million tonnes of lead in the indicated & inferred categories combined. Looking at solely indicated resources, the indicated resource at La Colorada Skarn came in at ~96 million tonnes at 2.77% zinc, 1.28% lead, and 31 grams per tonne of gold, which is nearly the same size as the inferred category (~100 million tonnes) at the previous resource update (Q4 2019) two years after the Skarn’s initial discovery (2018).
La Colorada Skarn Resource (Company Presentation)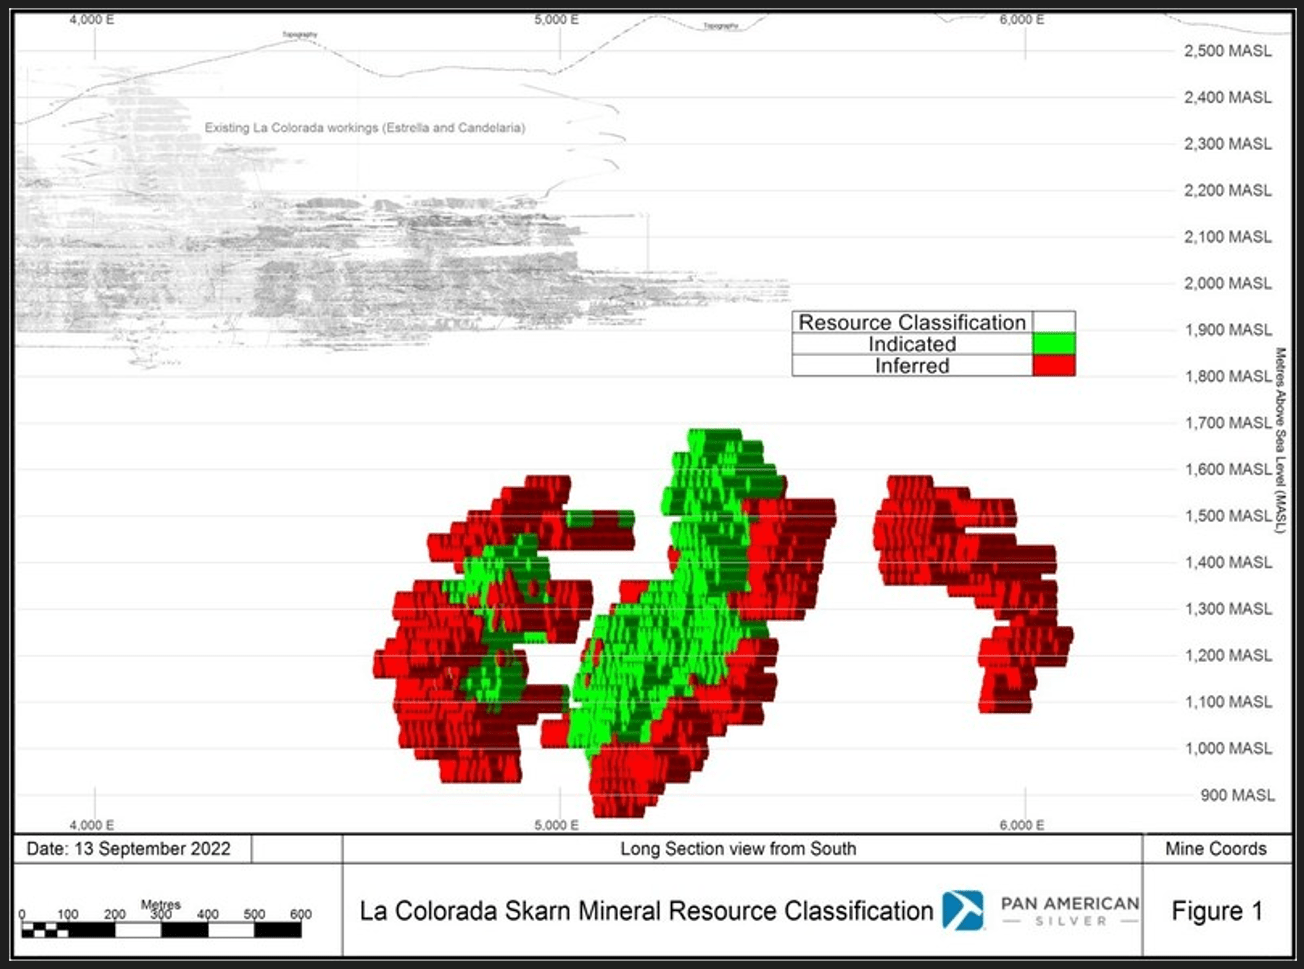
It’s worth noting that this updated resource did not include the record intercept released in July of 295 meters at 234 grams per tonne of silver, 0.09% copper, 6.36% lead, and 5.72% zinc. In addition to drill-hole D-96-03-22, multiple other higher-grade intercepts were well above the current resource grade. The company noted that these intercepts in D-96-03 and D-96-04 could support a high-grade silver zone between the Amolillo and NC2 veins that extends at least 100 meters, and infill drilling had extended mineralization to the south of the central block with very thick intercepts (up to 90 meters).
Pan American noted that it is now contemplating bulk mining methods for La Colorada Skarn, which lies below existing infrastructure at its flagship operation, with the updated resource based on a $45/tonne cut-off and a sub-level caving mining method. Given this significant resource, the NPV (5%) at its La Colorada Operations could increase from $1.0 billion to closer to $1.5 billion. We should get a better idea of the project economics next year with the company planning an economic study. For now, this is a very exciting development, with high-margin polymetallic deposits of this size near existing infrastructure being very valuable and potentially a game-changer for this already very profitable asset.
Valuation
Based on ~211 million shares outstanding and a share price of US$15.80, Pan American trades at a market cap of ~$3.33 billion. Although Pan American may operate in less favorable jurisdictions than some of its larger peers (800,000+ GEO per annum producers), this valuation is becoming quite attractive with the company’s exposure to silver. From a P/NAV standpoint, Pan American now trades at less than 0.90x P/NAV, based on an estimated net asset value of ~$3.8 billion. Given its silver exposure, I would argue that a fair multiple for the stock is 1.40x P/NAV, translating to a fair value of ~$26.00.
Pan American – Historical Cash Flow Multiple (FAST Graphs)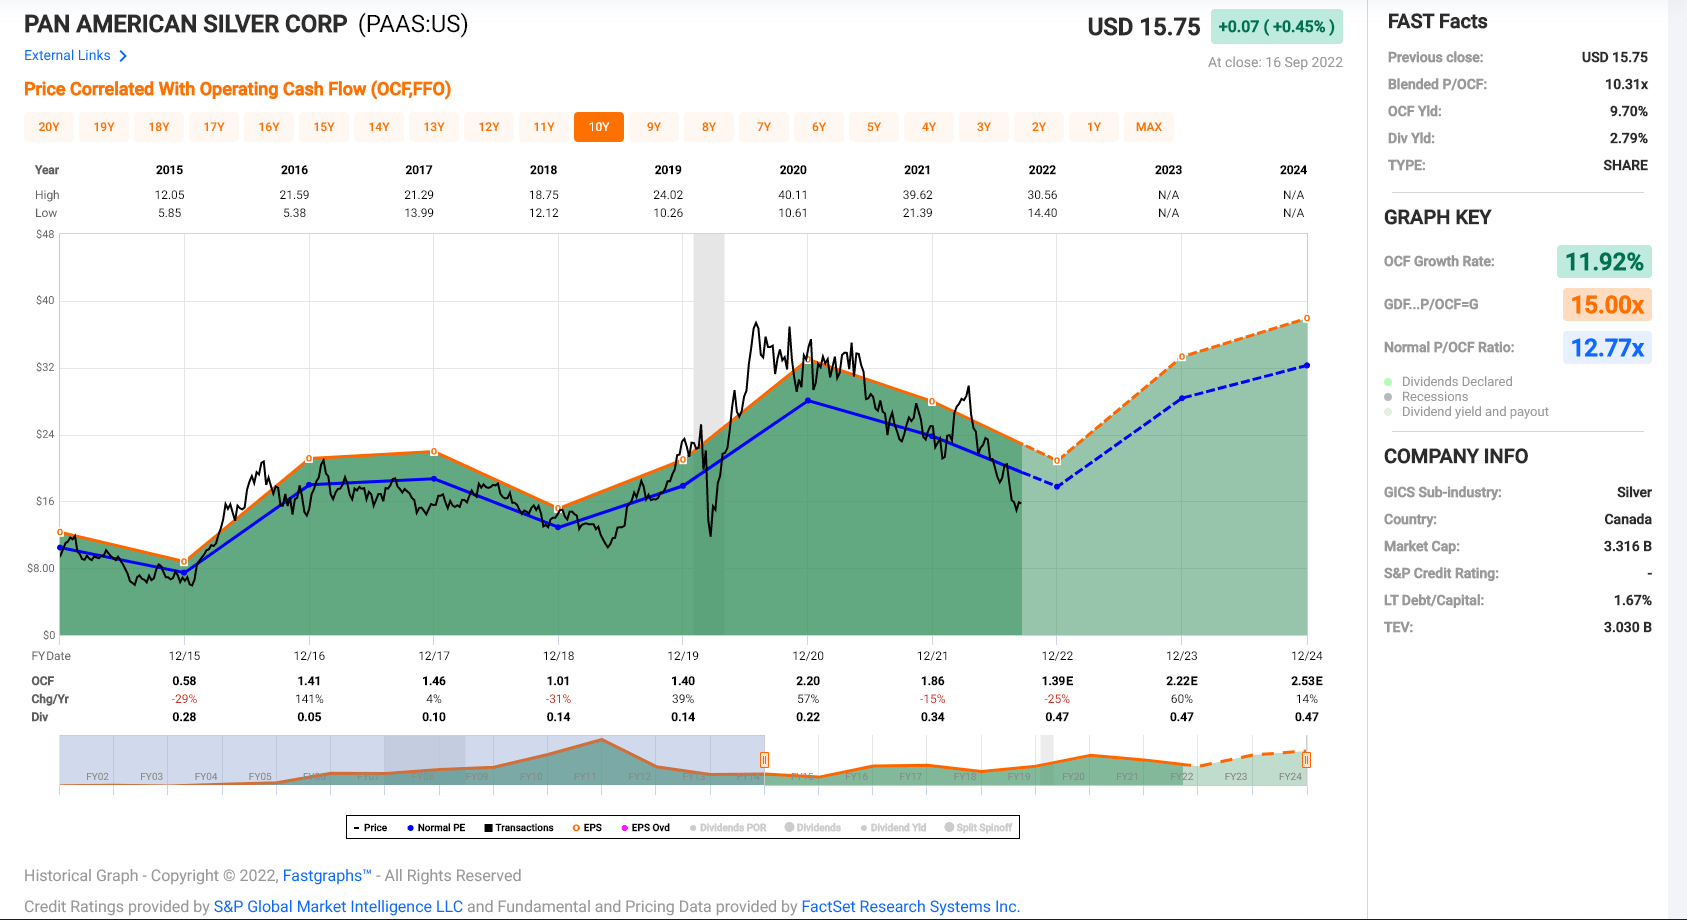
From a cash flow standpoint, the valuation has also become quite attractive, with Pan American historically trading at ~12.8x cash flow and the stock currently trading at ~7.1x FY2023 cash flow estimates ($2.22). It’s also worth noting that these cash flow estimates could be conservative, given that they have fallen considerably and are pricing in more conservative commodity prices next year. That said, even if metals don’t rebound much, and based on a conservative cash flow multiple of 10.90x (15% below its historical multiple due to weaker sentiment in the sector), I see a fair value for Pan American Silver of $24.50.
To illustrate how cheap PAAS is currently, it now trades at a lower cash flow multiple than in Q1 2016 (~9.0x), lower than Q2 2019 (~8.8x), and nearly in line with its trough at the March 2020 lows (~6.9x).
Technical Picture
From a technical standpoint, Pan American is at a critical level, hugging a multi-year uptrend line that connects Q1 2016 and Q1 2020 lows. A failure at this level and a monthly close below $14.50 would be a negative development, suggesting that this level has failed and would increase the probability that we could see a pullback to the next support zone at $12.60. However, given how oversold and cheap the stock is already, and given the positive recent developments (some progress at Escobal, a massive resource unveiled at La Colorada Skarn), I would not be surprised to see this level hold.
PAAS Daily Chart (TC2000)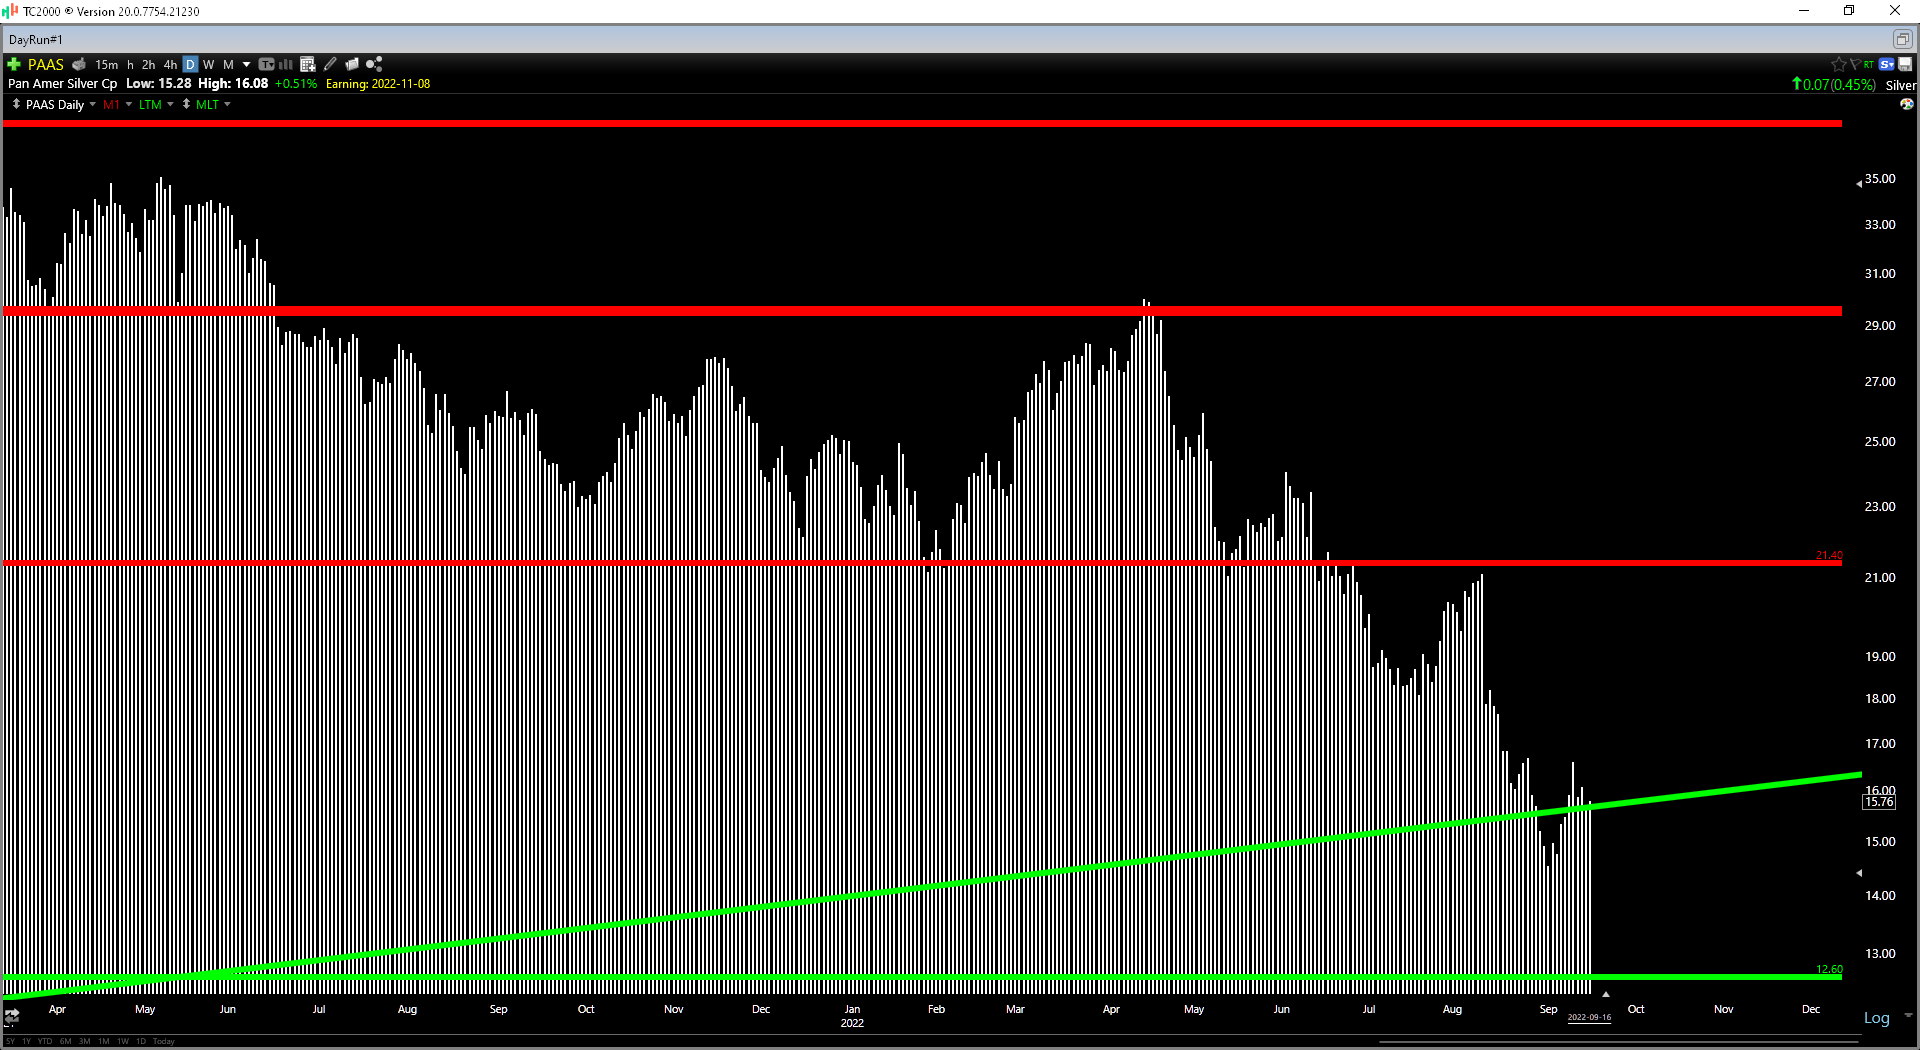
Summary
Pan American had a Q2 2022, which followed two difficult years for the company, impacted by COVID-19-related exclusions and exacerbated by inflationary pressures. Not surprisingly, this has soured sentiment on the stock, and we’ve seen significant multiple compression as interest in the sector has ground to a halt. That said, Pan American is actually one of the safer ways to get silver exposure even if costs have risen, using lower silver and gold price assumptions to calculate reserves than its peers, meaning it’s less susceptible to reserve deletions if prices remain below $19.50/oz.
Silver Producers – Metals Price Assumptions to Calculate Reserves (Company Filings, Author’s Chart)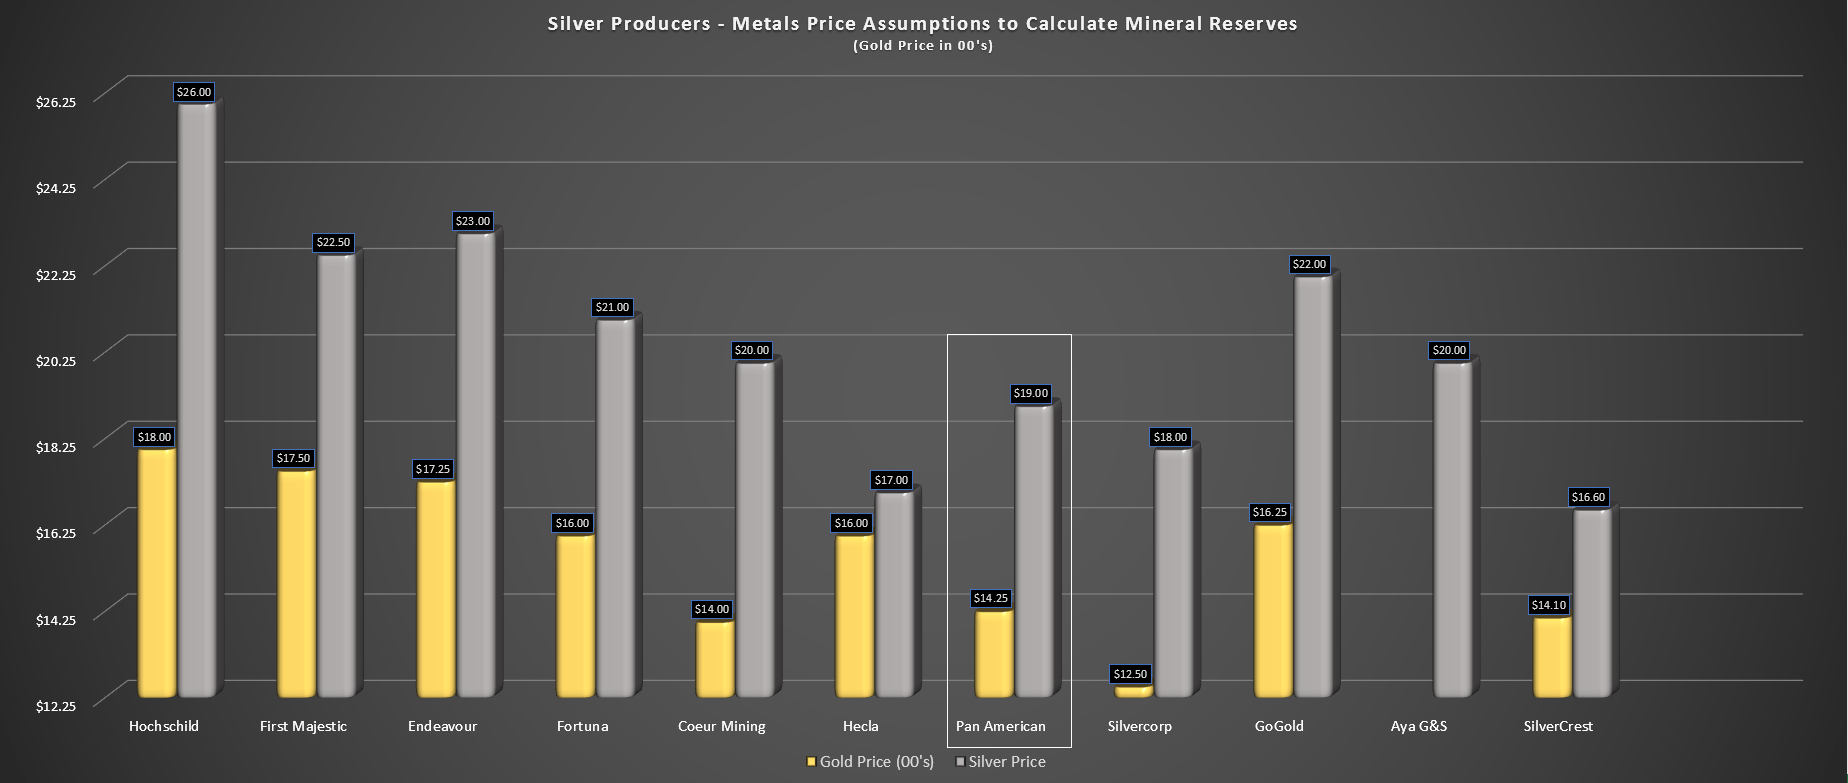
However, while Pan American might be the most attractively valued that it’s been in years, with this being the best buying opportunity since March 2020, I see larger valuation disconnects elsewhere in the sector. One example is Osisko Gold Royalties (OR), with higher margins and a lower-risk business model trading at less than 0.80x P/NAV. Another is Agnico Eagle (AEM), trading at ~7.0x cash flow in safer jurisdictions with several world-class ore bodies in its portfolio. So, while I see this pullback below US$16.00 as a buying opportunity for PAAS, I remain Neutral due to seeing better reward/risk bets elsewhere.
Be the first to comment