

Bet_Noire
Following a dismal 2022 for stock markets worldwide, we look to 2023 to gauge the market opportunity. We analyzed the US economy and forecasted the outlook of the US stock market in 2023. We did this by first analyzing the US inflation based on CPI and the 1-year Treasury yield, and future projections by the latest Survey of Professional Forecasters. We then analyzed the US interest rate outlook following the rate hikes by the Federal Reserve this year based on the Federal Reserve dot plot. We looked at the GDP growth outlook in 2023 for the US and derived our forecast based on our interest rate estimate. To determine the prospects of companies in the S&P 500 (SP500), we analyzed the sales and profit growth forecast for these companies in 2023 and derived our S&P 500 price target in 2023 based on the market historical average P/E in a bear, base and bull case scenario.
US Economy 2023
i) Inflation
Bureau of Labor Statistics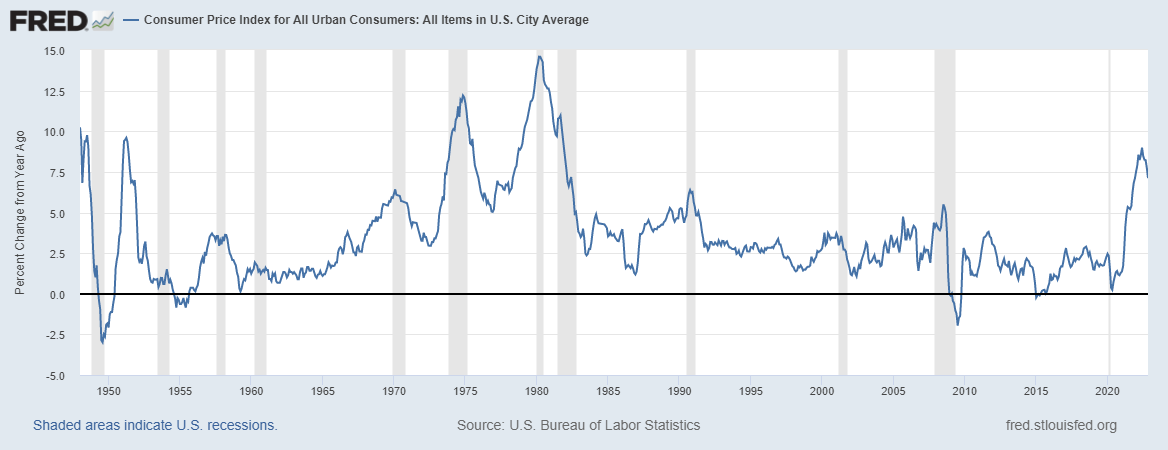
In 2022, inflation surged to the highest in the past 40 years with a peak at an annual change of 8.99% for the CPI in June 2022. According to Fortune, economists attributed this phenomenon to several factors including the shortages of goods as a result of the pandemic with the shift of consumer demand from services to goods, closure of factories and disruptions to supply chains from the early period of the pandemic and the Russian invasion of Ukraine impacting oil prices, manufacturing and shipping costs.
Federal Reserve Bank of St. Louis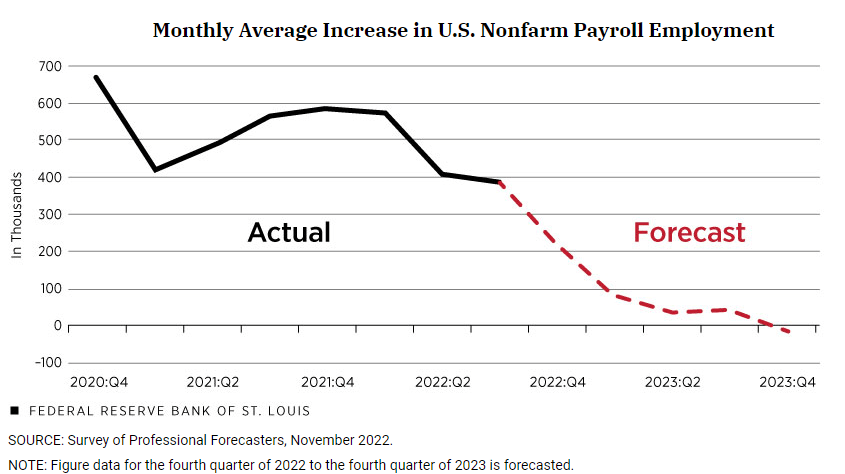
Additionally, in the labor market, the US nonfarm payroll employment had been on a decreasing trend since 2020 as seen in the chart above. Based on the Bureau of Labor Statistics, the unemployment rate was at 3.7% in November, an increase compared to the 29-month low of 3.5% in September. The St Louis Fed stated that…
key labor market fundamentals-such as underlying growth in the labor force and recent trends in the labor force participation rate-suggest that the pace of job gains will slow in 2023
It also cited the Survey of Professional Forecasters’ projection of 36,000 job increases per month in 2023. Thus, we believe this indicates a rising unemployment outlook which bodes well for a lower inflation outlook in 2023.
Federal Reserve Bank of Philadelphia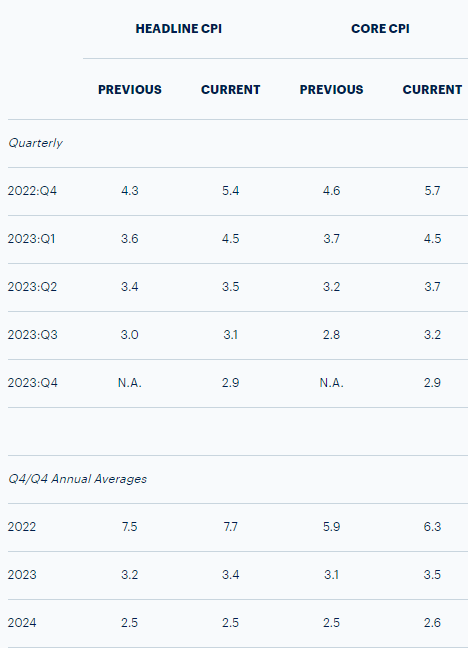
Furthermore, the latest Survey of Professional Forecasters in Q4 2022, as seen above, indicates that headline inflation is projected to decline in 2023 to 3.4% versus 7.7% this year while core inflation is projected at 3.5% from 6.3% in 2022. We believe the inflation outlook to continue to moderate going forward due to several factors. Among which is the declining oil prices as the WTI oil price had declined by 40% since its peak of $130.5 in May 2022. We believe the shortage situation is also improving with the US business inventories recovering well above their decline in 2020. Moreover, the Baltic Dry Index (global shipping freight-cost index) peaked in May 2022 and declined by 50% since then as shipping rates fell.
CNBC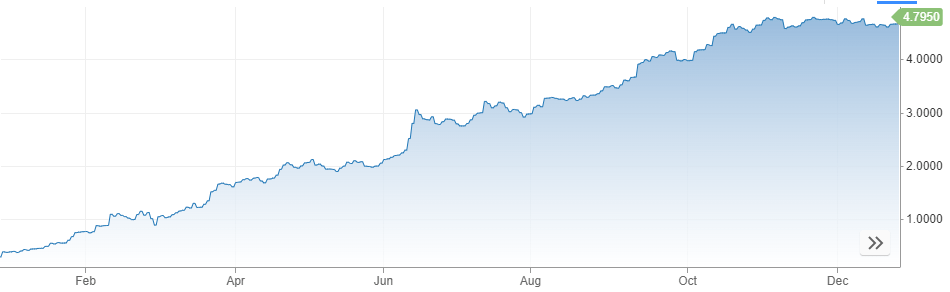
Furthermore, as seen chart above, the US 1-year Treasury yield above stood at 4.795%. It finally peaked in November 2022 following the oil price and global shipping freight-cost index peak in May. Thus, we believe the US 1-year Treasury yield to be the most reflective to track inflation. We based our 2023 inflation forecast on the 1-year yield by first obtaining the 5-year average of 1.52% as the long-term average. We assumed it would take 5 years as a conservative assumption for inflation to normalize from the current level to the long-term average and derived an inflation rate forecast of 4.14% in 2023.
ii) Interest Rates
Federal Reserve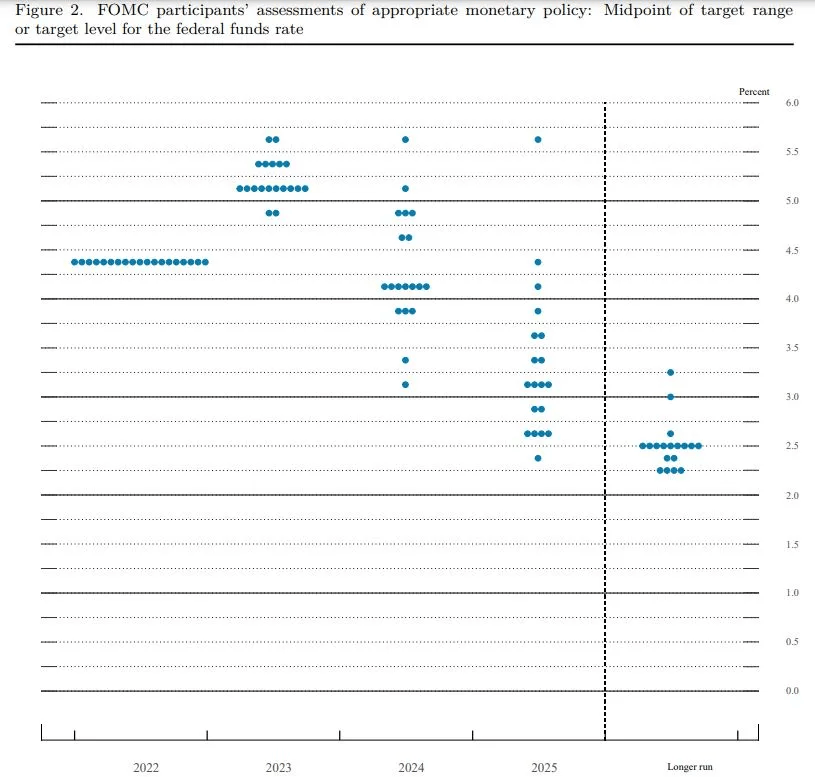
In December, the US Federal Reserve continued to increase the borrowing rate to a targeted range of between 4.25% and 4.5%, the highest in 15 years according to CNBC while the effective federal funds rate stood at 4.33%. As seen in the Federal Reserve dot plot above for the 2023 outlook, the Federal Reserve members expect rates to keep rising with 17 of the 19 dots above 5% in 2023 and the terminal rate at 5.1%, higher than in 2022. Also, based on the latest FOMC Statement…
the Committee is strongly committed to returning inflation to its 2 percent objective.
However, the Federal Reserve expects rates to fall in the following year based on the dot plot to 4.1%.
To forecast the interest rate in 2023, we obtained the quarterly average 1-year Treasury yield and effective federal funds rate in the past 5 years. In the periods when the 1-year yield was above 2%, we calculated the average 1-year yield and the corresponding average federal funds rate but lagged by quarter to derive a difference of -0.1%. With our inflation forecast in 2023 of 4.14%, we added the -0.1% average difference to obtain our forecasted rate of 4.04% which is 1.06% lower than the FOMC projection of 5.1% in 2023.
iii) GDP Growth
Trading Economics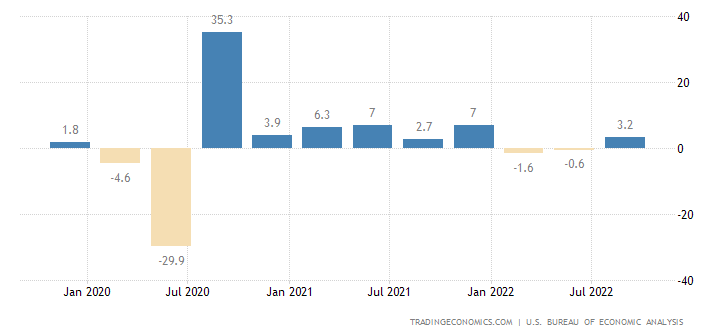
The US real GDP growth was positive at an annualized rate of 3.2% in Q3 2022 compared to the preceding quarter and surpassed the forecast of 2.9% following two quarters of negative growth. According to Trading Economics, the positive growth was contributed by stronger net trade and consumer spending which rose by 2.3%. In the chart below, we compared the US federal funds effective rate with the real GDP growth in the past 5 years. Until Q2 2019 when rates rose, the US real GDP was stagnating. Following the recession in 2020, the federal funds rate was reduced to 0% and was followed by spurring GDP growth until Q1 2022 as the fed funds rate began rising again while GDP growth contracted until Q2 2022.
Board of Governors, BEA Federal Reserve Bank of Philadelphia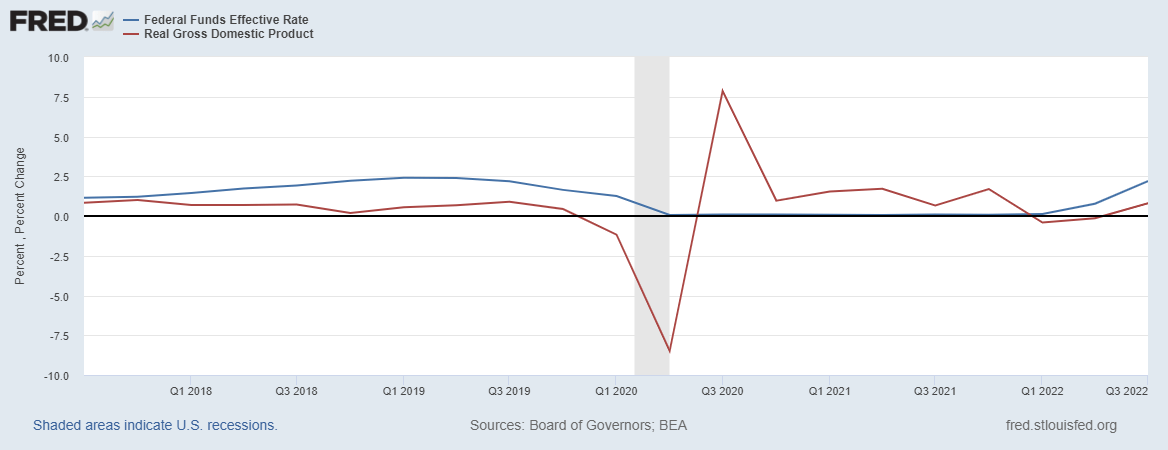
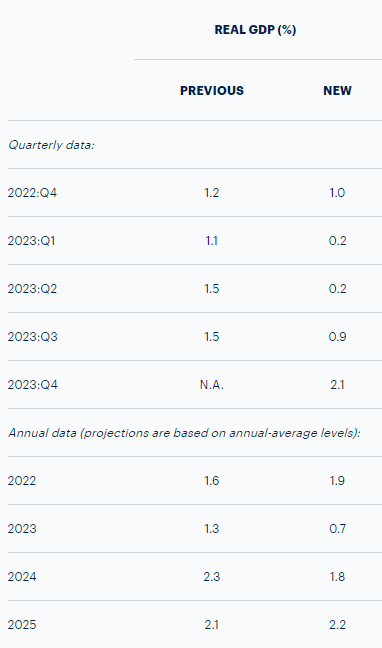
In terms of the 2023 GDP outlook, the latest Survey of Professional Forecasters report predicts that the US economy to still grow positively by 0.7% in 2023 before recovering to 1.8% in 2024 and 2.2% in 2025. Based on our interest rate forecast in 2023, we derived our forecast for GDP growth in 2023. In the past 5 years pre-pandemic in the periods when the US increased interest rates, we obtained an average change in GDP growth % per change in the average annual US interest rate factor of -1x. Thus, based on our interest rate forecast of 4.04% in 2023 which is a decrease of 0.29% compared to the current effective federal funds rate, we estimated an increase in GDP by 0.3% from 2022, thus we forecasted a real GDP growth rate of 2.2% in 2023 from the 2022 rate of 1.9%.
2023 S&P 500 Earnings Forecast
The stock market is not very reflective of the economy in the short-term. For example, the MSCI All Country World Index (ACWI) declined 19.7% YTD. But out of the top 10 economies in the world, the United States was the only country that entered into a recession in 2022. Even after that, the US is still expected to finish the year with positive GDP growth.
According to the CFA Institute, the equity market appreciation rate consists of 3 components which are:
- nominal GDP growth
- expansion/contraction of the share of profits in GDP
- expansion/contraction of the P/E
Based on the components, GDP growth is only one part of the formula. In addition, the other part which has to be looked at includes the expansion or contraction of the companies’ share of profits in GDP as well as the expansion or contraction of the market P/E multiple.
Factset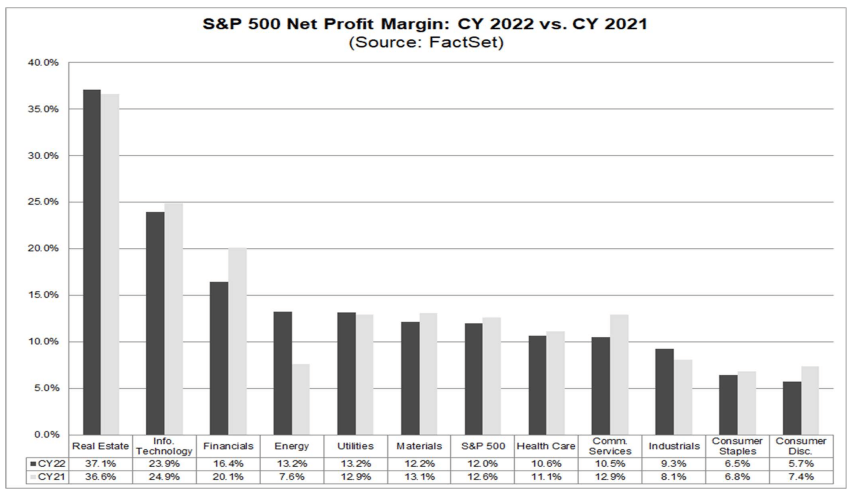
In 2022, the S&P 500 profit margin is expected to decline to 12% in 2022 compared to 12.6% in the prior year according to Factset. Based on the chart, 7 sectors’ average net profit margin is expected to decline in 2022 including Information Technology, Financials, Materials, Healthcare, Communication Services, Consumer Staples and Consumer Discretionary.
Factset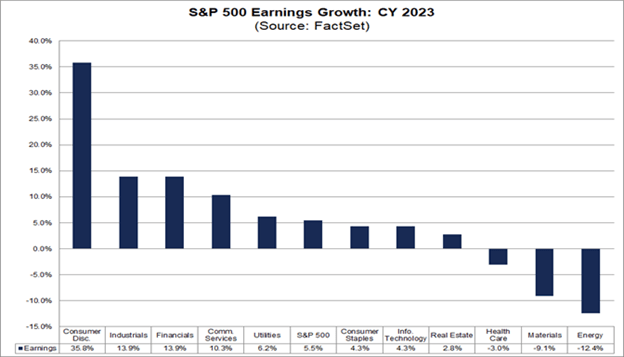
However, according to Factset…
Eight of the eleven sectors are predicted to report year-over-year growth in earnings in CY 2023, led by the Consumer Discretionary, Industrials, Financials, and Communication Services sectors. On the other hand, three sectors are projected to report a year-over-year decline in earnings, led by the Energy and Materials sectors.
This is as oil prices declined by 40% from their peak this year and the commodities index by 20%.
Factset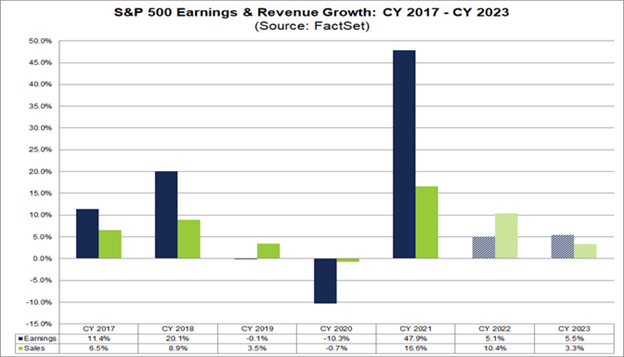
According to Factset, the analyst consensus for the S&P 500 sales and earnings growth is positive at 3.3% and 5.3% respectively. However, the estimated sales growth for the S&P 500 is a slowdown compared to 10.4% in 2022 while the earnings growth of 5.5% is in line with the 2022 forecast. Thus, with a higher earnings growth forecast compared to sales growth, this implies an expected increase in profit margins in 2023. This is also following corporate layoffs from companies such as Meta (META) (11,000), Amazon (AMZN) (20,000), Credit Suisse (CS) (9,000), Peloton (PTON) (500), Ford (F) (3,000), Snap (SNAP) (1,200), Microsoft (MSFT) (1,000) and Wayfair (W) (870). Overall, we believe the 2023 earnings growth rate forecast of 5.5% YoY is reasonable as it is lower compared to the 10-year average earnings growth rate (8.5%). Additionally, our 2023 sales and earnings growth forecasts for the 5 largest companies in our portfolio are as follows:
- Apple (AAPL) (Technology Sector, Tech Hardware Industry) – Sales growth of 9.6%, earnings growth of 14.3%
- Microsoft (Technology Sector, Software Industry) – Sales growth of 24.35%, earnings growth of 15.45%
- Quidel (QDEL) (Health Care Sector, Health Care Equipment Industry) – Sales growth of 11.32%, earnings growth of 1.72%
- Samsung (OTCPK:SSNLF) (Technology Sector, Semiconductor Industry) – Sales growth of 16.79%, earnings growth of 30.4%
- Nvidia (NVDA) (Technology Sector, Semiconductor Industry) – Sales growth of 23.22%, earnings growth of 38.8%
S&P 500 Valuation
Multipl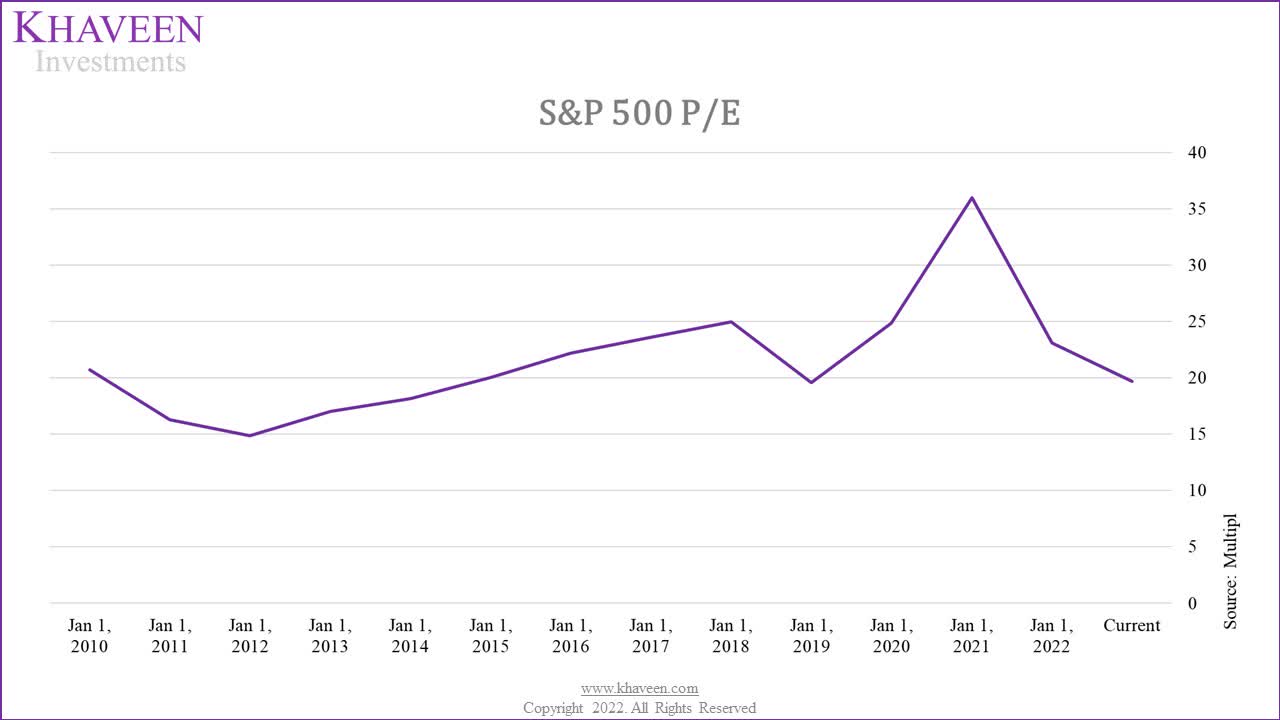
From the chart above, the S&P P/E ratio had declined from its peak in 2021 to 19.68x currently. Based on S&P Global 2022 forecasted EPS of $200.49 and Factset’s earnings growth of 5.5% for 2023, we derived a forecasted EPS of $211.52 for the S&P 500 in 2023. Furthermore, we obtained a 3-year, 5-year, and 10-year historical average S&P 500 P/E ratio to obtain a valuation of the S&P 500 based on our EPS forecast in 2023.
|
S&P 500 Forecast |
P/E Ratio |
S&P Target |
Upside |
|
3-year Average (Bull case) |
26.25 |
5,552 |
46.8% |
|
5-year Average (Base case) |
24.65 |
5,213 |
37.8% |
|
10-year Average (Bear case) |
23.21 |
4,910 |
29.8% |
|
2023F EPS |
$211.52 |
||
|
Current |
3,783 |
Source: Khaveen Investments
Risk
Khaveen Investments uses a proprietary multifactor risk model to assess the risks of countries around the globe. This encompasses 20 metrics across 5 risk factors that might affect a country’s stock market.
Khaveen Investments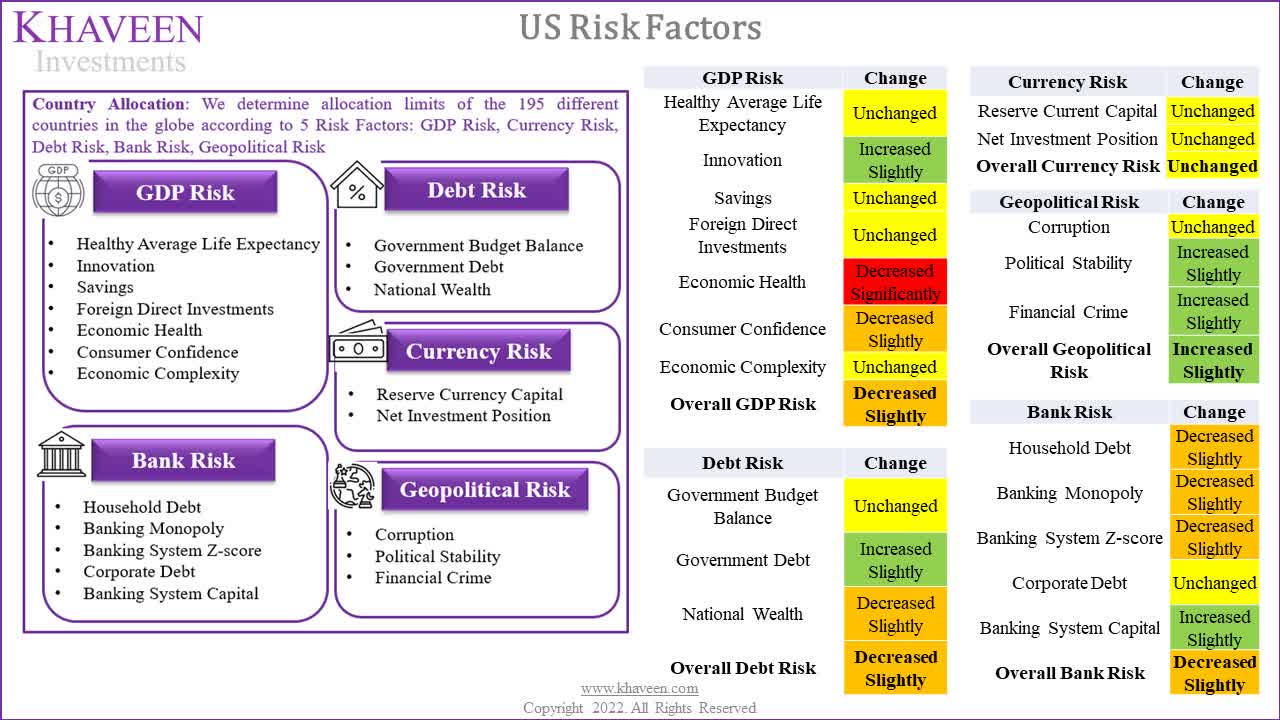
Based on our multifactor risk model in the table above, we compiled the risk factors for the US economy to determine the change in potential risk outlook in 2023 compared to 2022. A decreasing score reflects decreasing fundamentals and higher risk, while an improving score reflects better fundamentals and lower risk. The overall GDP risk factor had decreased from 1.02x to 0.97x as the Economic Health risk factor had deteriorated significantly. This is due to the declining Manufacturing PMI of the US from 58x to 47.7x. Furthermore, the overall Debt risk and Bank risk also decreased slightly. Geopolitical risk increased slightly, while Currency risk remains unchanged.
US Manufacturing PMI
Trading Economics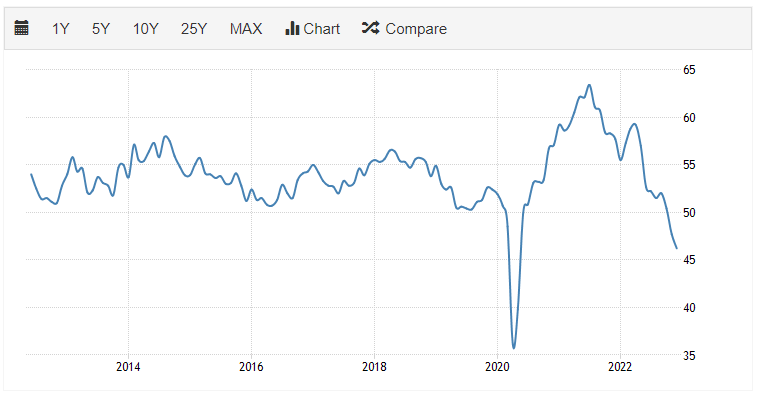
The overall risk factor score for the US decreased slightly from 2.32x to 2.18x, highlighting deteriorating fundamentals. However, it is still positive as it remains well above 1x. Thus, we believe the country risks of the United States do not pose a significant risk to the US stock market in 2023.
Verdict
All in all, following surging inflation this year due to several factors including shortages, factory closures, supply chain disruptions and the Russian invasion of Ukraine, we expect a lower inflation outlook in 2023. We derived a forecasted inflation rate of 4.14% for 2023. Moreover, while the Federal Reserve members are projecting an average of 5.1% for the target rate in 2023, we derived a forecast rate of 4.04%, which is 1.06% lower than the FOMC average target rate projection in 2023 but in line with its 2024 target rate average of 4.1%. Furthermore, we forecasted a real GDP growth rate of 2.2% in 2023 based on our interest rate forecast model, which is higher than the SPF’s forecast growth rate of 0.7%.
Furthermore, the sales growth forecast for 2023 at 3.3% and earnings growth of 5.5% implies potential margin expansion next year. We believe the earnings growth forecast of 5.5% YoY for 2023 is reasonable as it is below the trailing 10-year average earnings growth rate of 8.5%. Additionally, the market P/E is below the historical averages.
Overall, we obtained a target of $5,213 for the S&P 500 based on our EPS forecast of $211.52 and the 5-year average P/E as our base case which is an upside of 37.8%. In comparison, our upside for 2023 is higher than the S&P 500 average historical 5-year return of 17.04%. This is reasonable considering the S&P 500 P/E had declined by 14.8% this year as the S&P 500 price declined by 21.1%, much more than earnings which only declined by 7.4%. Thus, we believe the S&P 500 is poised for a bull run in 2023.
Editor’s Note: This article was submitted as part of Seeking Alpha’s 2023 Market Prediction contest. Do you have a conviction view for the S&P 500 next year? If so, click here to find out more and submit your article today!
Be the first to comment