

Ridofranz
Clients & Friends
In this commentary, we will provide a high-level performance update for Q3 2022.
As a reminder, the strategy underlying the Newfound Risk Managed U.S. Growth Fund (MUTF:NFDIX) is designed to provide capital efficient1 access to stocks and bonds with the thesis that equity market extremes are becoming more frequent and more severe. For lack of a better word, things will most likely remain “weird.” To align with this thesis, NFDIX employs a barbell approach, marrying a ladder of increasingly convex positions seeking to out-perform in equity left tails with a ladder of increasingly convex positions that seek to out-perform in the right.
At its core is a strategic equity position comprised of momentum and defensive style tilts (approximately 30% in both sleeves; 60% total). We complement the core equity position with a systematic trend-following strategy (approximately 30%) which has the flexibility to tilt from fully invested to fully divested into short-term U.S. Treasuries. We implement a ladder of outof-the-money put and call options (approximately 2.5% each) in an effort to maximize defense in extreme down markets and participation in extreme up markets.
Finally, we use the remaining capital (approximately 5%) as collateral for an active U.S. Treasury futures strategy, which seeks to provide a second, diversifying source of returns to the portfolio (varying between 0-to-100% notional exposure).
Q3 2022 Performance Analysis
| TL;DR: Both U.S. equity and U.S. Treasury beta were detractors from absolute returns. Structural overweight to equities were a significant detractor from relative returns while tactical signals to underweight bonds were contributors to relative returns. Defensive factor tilts were not a meaningful contributor while momentum was a significant contributor. Trend signals to reduce equity exposure were a significant contributor to relative returns. Put option exposure was largely negated by call option exposure. |
NFDIX returned -6.33% in Q3 2022. The S&P 500 Total Return Index (“S&P 500”) returned -4.88% and a 50/50 portfolio of S&P 500 and 10-Year U.S. Treasury futures portfolio levered up 1.5x (“75/75”) returned -7.84%. Year-to-date, NFDIX has returned -30.24%, the S&P 500 has returned -23.87%, and a 75/75 portfolio has returned -27.18%.
Figure 1. Q3 2022 Contribution to Portfolio Return
| Total Return (%) | Average Weight (%) | Contribution to Return (bps) | |
|
Defensive Equity |
-5.33 |
31.35 |
-167 |
|
Momentum Equity |
-2.87 |
31.35 |
-90 |
|
Trend Equity |
-3.32 |
31.30 |
-104 |
|
Put Options |
19.18 |
1.46 |
28 |
|
Call Options |
-27.41 |
1.35 |
-37 |
|
Treasury Futures |
-5.04 |
43.29 |
-218 |
|
Cash (and Equivalents) |
0.31 |
3.18 |
1 |
|
143.28 |
-587 |
||
|
Residual |
-46 |
||
|
NFDIX |
-633 |
As a quick technical aside, it should be noted that contribution analysis is fraught with imprecision, and hence there is a residual contribution2 left over in the analysis. One example of a residual contribution is fund fees3. Another is cash flow in and out of the fund, which can make the fund appear to hold excess cash for the day (inflow) or levered (outflow). As such, contribution analysis should be considered directionally accurate rather than precisely correct.
In comparison to the expected long-term allocation of 75% S&P 500 and 75% 10-Year U.S. Treasury futures:
- The Fund held an average 69.66% to equities over the quarter, a 5.34 percentage point underweight. This contributed 26bps to relative performance.
- The Fund held an average allocation of 43.29% to 10-Year U.S. Treasury futures, a 31.71 percentage point underweight. This created a 175bp benefit to relative returns.
- Defensive equities underperformed the S&P 500 by 40bp, creating a -13bp drag on relative returns.
- Momentum equities outperformed the S&P 500 by 206bp, contributing 64bps to relative returns.
- The Trend sleeve was, on average, 77.76% allocated to short-term U.S. Treasuries throughout the quarter. Whipsaw during the quarter, however, meant that timing calls around this average weight created a -49bp drag on relative returns.
- Call options continued to lose value as markets trended downwards, contributing -37bps to relative returns, offset by value accrued to put options which contributed 28bps.
Figure 2. Q3 2022 Attribution versus a 75/75 Portfolio
|
Contribution to Return (bps) |
|
|
75/75 Index |
-784 |
|
Underweight Equity |
26 |
|
Underweight Bonds |
175 |
|
Defensive |
-13 |
|
Momentum |
64 |
|
Trend Timing |
-49 |
|
Put Options |
28 |
|
Call Options |
-37 |
|
Sum |
-588 |
|
Residual |
-45 |
|
NFDIX |
-633 |
In a volatile quarter, performance attribution at the destination only tells part of the story: we should also evaluate the path over which the attribution accrued. Figure 3 attempts to depict the sources of relative return generated by NFDIX versus a 75/75 portfolio.
Figure 3. Estimated Cumulative Excess Return Contribution (in Basis Points)
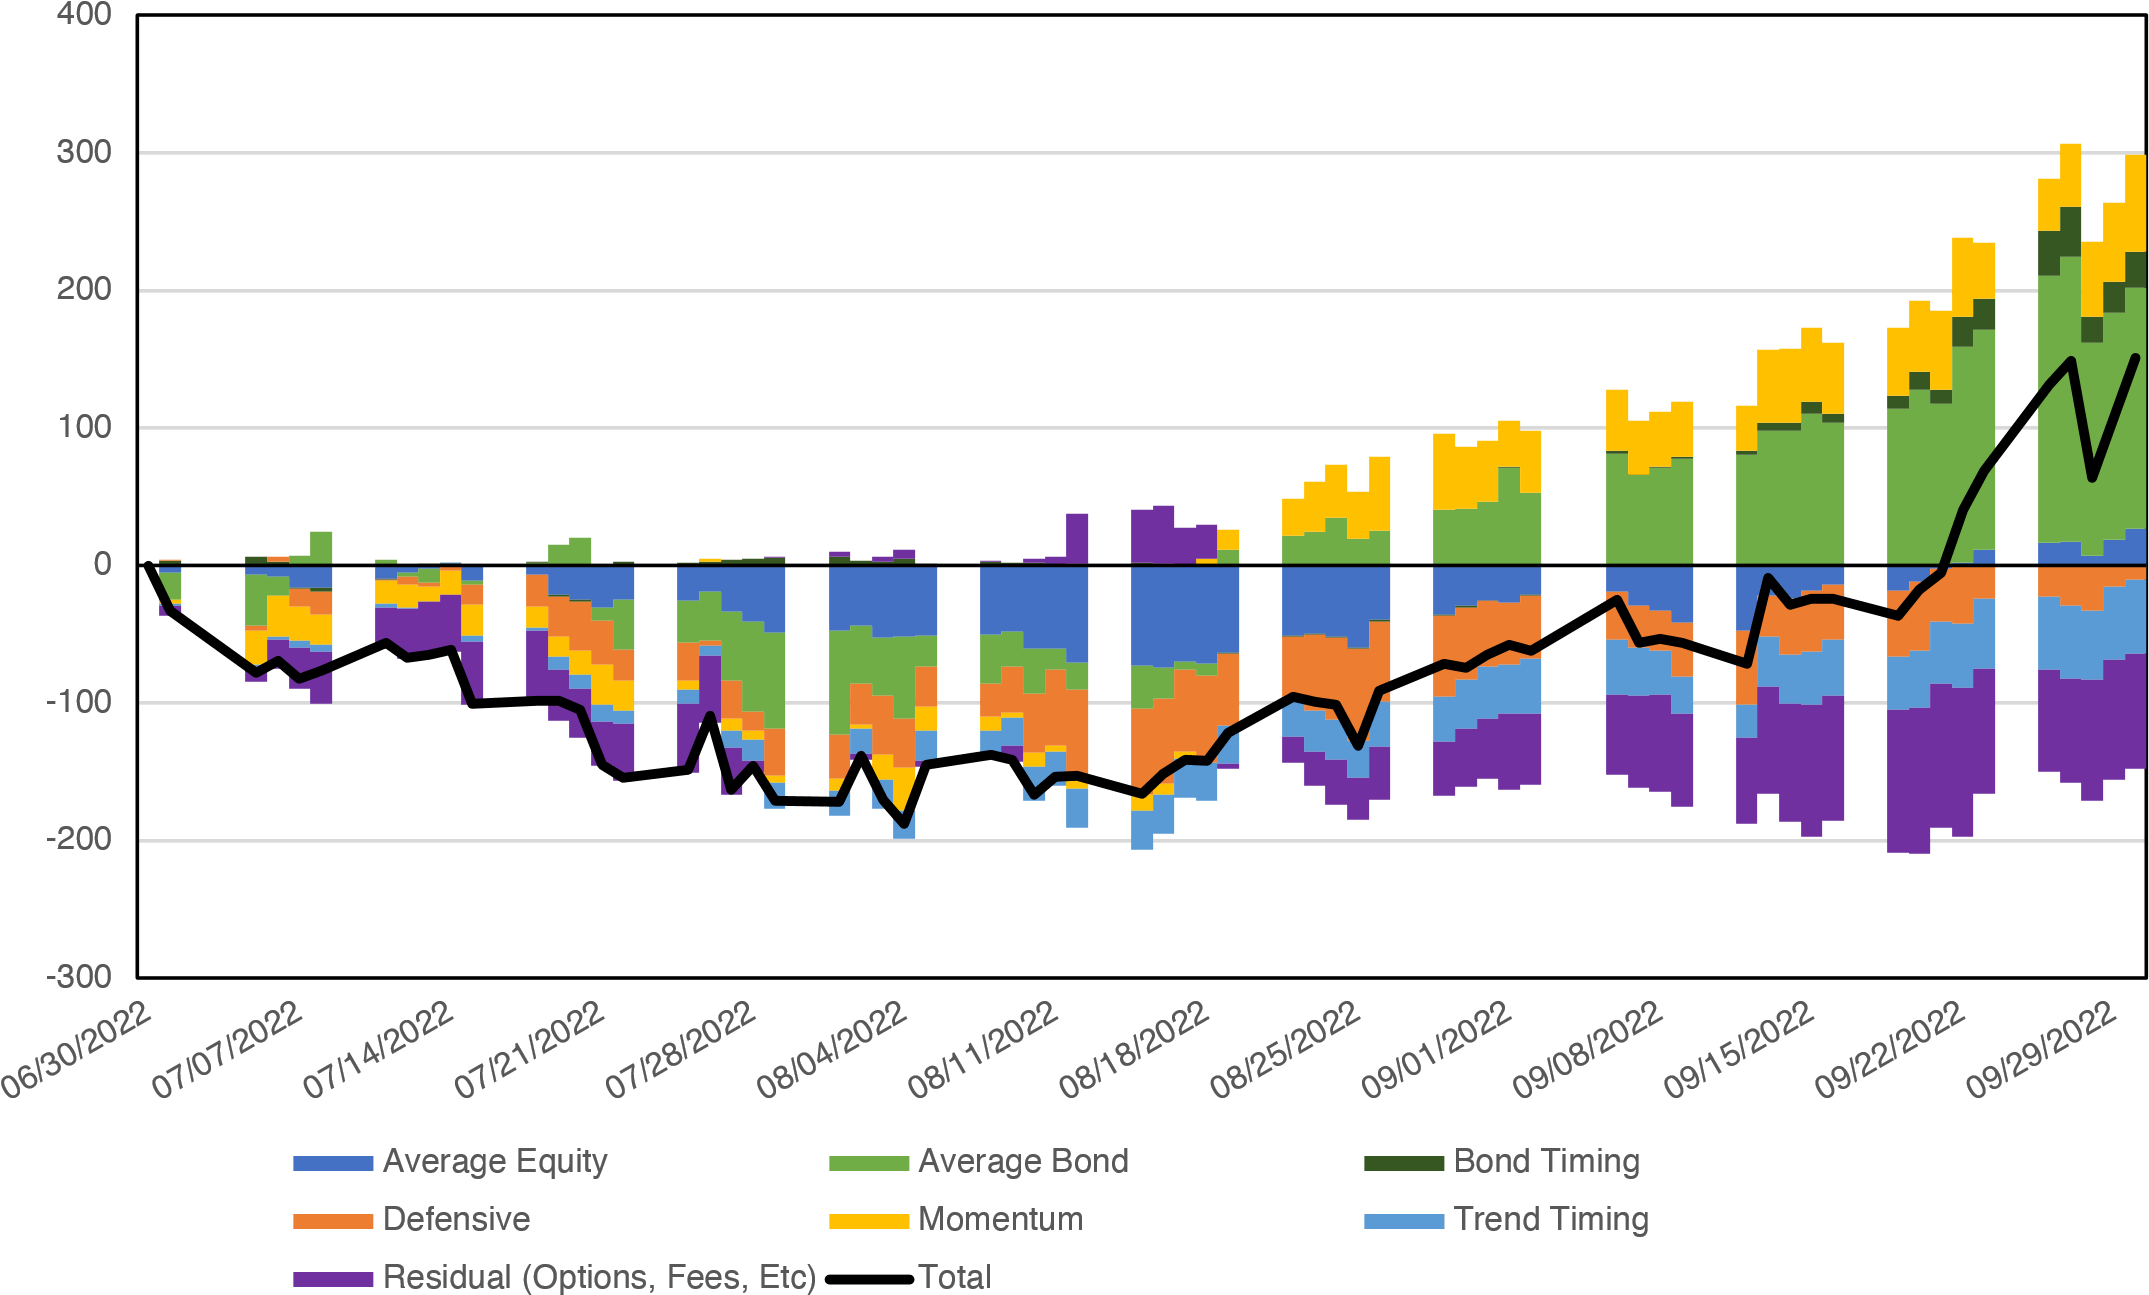
|
Source: Tiingo; Barcharts; Sharadar. Calculations by Newfound Research. “Average Equity” is a portfolio with constant exposure to the S&P 500 equal to the average weight held over the quarter by the portfolio. “Average Bond” is a portfolio with constant exposure to 10-year U.S. Treasury futures equal to the average weight held over the quarter by the portfolio. “Bond Timing” is a portfolio that is either long or short 10-year U.S. Treasury futures, capturing the daily deviation in portfolio holdings above or below the average weight held over the quarter. “Defensive” is monthly-rebalanced portfolio that is 50% Strong Balance Sheet portfolio and 50% in an equal-weight portfolio comprised of the following ETFs: JQUA, LGLV, USMV, QUAL, FQAL, and FDLO. “Momentum” is a portfolio comprised of the following ETFs: MTUM, FDMO, JMOM, VFMO, XLB, XLC, XLE, XLF, XLI, XLK, XLP, XLRE, XLU, XLV, and XLY. The ETFs are held in proportion to their average weight held in NFDIX over the quarter. The portfolio is rebalanced quarterly. The Strong Balance Sheets portfolio is constructed by: (1) selecting the top 500 U.S. securities by market cap; (2) removing Financials; (3) ranking stocks on Merton’s distanceto-default; (5) filtering out stocks that have the highest momentum; (5) picking the top 100 and equally-weighting them. The portfolio is rebalanced monthly using six overlapping tranches.“Trend Timing” is a portfolio that is either long or short the S&P 500 (“SPY”), capturing the daily deviation in portfolio holdings above or below the average weight held over the quarter from proprietary trend following signals. Returns of the aforementioned portfolios are hypothetical and are gross of all fees (including, but not limited to, advisor fees, manager fees, transaction costs, or taxes) except for underlying ETF expense ratios. The aforementioned portfolios are representative estimates and do not necessarily reflect the actual holdings of NFDIX. Past performance is not an indicator of future results. Strategy attribution is a best-efforts approximation. |
We see a tale of two markets. From July to mid-August, we can clearly see that the average exposure to equities was a meaningful drag on performance relative to the 75/75 portfolio, as was the defensive style tilt and the average exposure to bonds.
In the second half of the quarter, as both equities and bonds turned down, we see a reversal of fortune. The average exposure to bonds went on to be one of the largest contributors to relative returns and the average exposure to equities ended the quarter as a slightly positive contributor. The underperformance of defensive equities meaningfully rebounded, and momentum equities contributed significant value.
Sympathy for the Line-Item Devil
| TL;DR: Due to their embedded leverage, capital efficient funds can produce outsized returns. When appropriately sized, their returns may be dollar equivalent to an unlevered fund. Seeing larger percentage losses, however, can be uncomfortable for some investors. We discuss three practical ideas shared by advisors implementing return stackingTM concepts to combat this behavioral risk: sizing, separation, and pairing. |
Last year, we co-authored Return StackingTM: Strategies for Overcoming a Low Return Environment. Within the paper, we discussed the idea of using capital efficient funds to replicate a core 60% stock / 40% bond exposure while making room for potentially diversifying alternative investments. With the S&P 500 Index (“S&P 500”) down -15.47%, the Bloomberg US Aggregate Bond Index (“Bloomberg US Aggregate”) down -14.60%, and the SocGen CTA Index up 25.02% year-over-year, I suspect it will prove to be the most well-timed paper of my career.
Of course, it is foolish to celebrate the short-term performance of a methodology held out as being a superior long-term allocation scheme. Nevertheless, we are encouraged to see the technique work in exactly the environment we had designed it for.
Despite this short-term success, what has proven difficult in practice is the “line-item risk” associated with holding some of the capital efficient funds. What is line-item risk?
As an example, imagine two funds. The first simply provides 60% S&P 500 / 40% Bloomberg US Aggregate exposure. The second applies 1.5x leverage to the first (financed using the Bloomberg Treasury Bill Index). From 9/30/2021 to 9/30/2022, the first portfolio returned -15.12% whereas the second portfolio returned -22.90% (exactly 1.5x the first minus the cost of financing).
Yet the entire point of capital efficiency is to achieve the same exposure using fewer assets! Were we to invest $100 in the first portfolio, we would have $60 in the S&P 500 and $40 in the Bloomberg US Aggregate, whereas if we invested $100 in the second portfolio, we would have $90 in the S&P 500 and $60 in the Bloomberg US Aggregate (again, financed using the Bloomberg Treasury Bill Index). To achieve the same dollar exposure, we need only invest $66.66 dollars in the second portfolio ($66.66 x 90% = $60 and $66.66 x 60% = $40).
By achieving the same dollar exposure, we achieve nearly identical dollar losses. From 9/30/2021 to 9/30/2022, $100 invested in the first portfolio loses $15.12, whereas $66.66 invested in the second loses $15.26.4 Yet if these portfolios were productized (e.g. in a mutual fund or ETF), the first would show a -15.12% loss whereas the second would show -22.90%.
The fact that the second portfolio shows up as having a larger percentage loss – whether on Morningstar, a brokerage statement, or other reporting software – invites greater attention. For advisors trying to implement Return StackingTM using such a product, the perception of a higher loss can create undue frustration and scrutiny from clients. That is line-item risk: the possibility for a particular holding to stand out in such a negative way that clients capitulate on holding it without receiving the potential benefits.
“But Corey,” you may protest, “surely this is just a question of client education.”
The reality of our business is that it is one of information asymmetry. Investors engage advisors precisely because they need help with financial planning and investment management. Education can only go so far; much of a financial advisor’s role often boils down to that of behavioral coach. In fact, Vanguard’s Advisor Alpha framework posits that behavior management can potentially add 100 to 200 basis points to client net returns by helping them avoid potentially costly emotional decisions.5
Yet after fielding dozens of unhappy questions from clients about a specific position, many advisors may simply find that the headache and distraction caused is not worth the potential value add. As is often said: the optimal portfolio is first, and foremost, the one a client can stick with.
As the manager of a fund that strives to provide capital efficiency, I have tremendous sympathy for this scenario. As a significant allocator to the fund, I have even more empathy! I will admit my own shock in seeing the headline number at times this year, only to remind myself that the capital efficiency embedded in the fund is what has allowed me to make room for alternative allocations that are positive on the year. It’s the dollars, Corey, not the percentage!
Over the last year, I’ve had several conversations with advisors about practical solutions they have implemented in an effort to avoid the behavioral risks that can be associated with these types of funds. Obviously, education is the first solution. Where that fails, however, how data is displayed can potentially have a profound impact.
- Sizing – Advisors have noted that investors are often more sensitive to larger position sizes, regardless of the volatility of the underlying investment. Using smaller allocations to multiple capital efficient funds instead of a large allocation to a single fund can potentially reduce this sensitivity.
- Separation – While unified managed accounts have grown in popularity over the last decade, some advisors discussed opening separate accounts for their Return StackedTM models, encouraging clients to look at the headline return of the account rather than the individual positions.
- Pairing – When used for return stackingTM, capital efficient funds are explicitly in place to help make room for other things. Thinking of these positions as a single, combined position may be easier for clients than trying to walk through the math of dollar-equivalent losses.
None of these approaches necessarily change the composition of a portfolio, but they do highlight that how information is conveyed can be a vital part of the sustainability of an investment plan.
I am reminded of an anecdote told to me by a close friend and behavioral finance expert. He referenced a study where investors were provided their asset allocation in two forms. In the first, foreign developed stocks were identified as a single allocation. In the second, foreign developed stocks were broken into individual country allocations. Both portfolios were identical, but the first group complained that the portfolio had too high an allocation to foreign stocks and the second group complained that the portfolio had too high an allocation to U.S. equities.
Take from that what you will.
We appreciate the trust you place in having Newfound Research oversee your capital; helping to manage these assets is a responsibility we do not take lightly. We firmly believe that the process we have in place provides our Fund the best opportunity to meet its objective going forward, seeking to capture a significant portion of market growth while reducing the impact of severe and prolonged market declines. If you have any questions, please do not hesitate to reach out.
Sincerely,
Corey M. Hoffstein, Chief Investment Officer, Newfound Research
|
Fund Performance (Performance at NAV1, 2, 3, performance as of September 30, 2022) |
||||||
|
3 Months |
6 Months |
1 Year |
3 Year |
5 Year |
Inception (6/2/2015) |
|
|
NFDIX NAV |
-6.33% |
-20.52% |
-22.52% |
-3.29% |
-0.43% |
0.79% |
|
S&P 500 |
-4.88% |
-20.20% |
-15.47% |
8.16% |
9.24% |
9.55% |
|
50/50 S&P 500 / 1-3 Year U.S. Treasuries |
-3.04% |
-11.27% |
-9.95% |
4.25% |
5.24% |
5.32% |
| The performance data quoted represents past performance. Current performance may be lower or higher than the performance data quoted above. Past performance is no guarantee of future results. The investment return and principal value of an investment in the Fund will fluctuate so that investors’ shares, when redeemed, may be worth more or less than their original cost. For performance data current to the most recent month-end, please call toll-free 1-855-394-9777 or visit our website, www.thinknewfoundfunds.com. |
|
The performance data quoted represents past performance. Current performance may be lower or higher than the performance data quoted above. Past performance is no guarantee of future results. The investment return and principal value of an investment in the Fund will fluctuate so that investors’ shares, when redeemed, may be worth more or less than their original cost. For performance data current to the most recent month-end, please call toll-free 1-855-394-9777 or visit our website, www.thinknewfoundfunds.com. The Fund’s investment advisor has contractually agreed to reduce its fees and/or absorb expenses until at least August 1, 2024. Without these waivers, the Class I Shares total annual operating expenses would be 1.32% as of the August 2022 prospectus update. The fee waivers ensure that the net annual, operating expenses of the Class I Shares will not exceed 1.25% subject to possible recoupment from the fund in future years. Please review the Fund’s prospectus for more information regarding the Fund’s fees and expenses. Investors should carefully consider the investment objectives, risks, charges and expenses of the Newfound Risk Managed U.S. Growth Fund. This and other important information about the Fund is contained in the prospectus, which can be obtained by calling 1-855-394-9777. The prospectus should be read carefully before investing. The Newfound Risk Managed U.S. Growth Fund is distributed by Northern Lights Distributors, LLC, Member FINRA/SIPC. Newfound Research LLC is not affiliated with Northern Lights Distributors, LLC.
Risk FactorsThere is no assurance that any Fund will achieve its investment objectives. Mutual Funds involve risk including the possible loss of principal. ETFs are subject to specific risks, depending on the nature of the underlying strategy of the fund. These risks could include liquidity risk, sector risk, as well as risks associated with fixed income securities, real estate investments, and commodities, to name a few. Typically, a rise in interest rates causes a decline in the value of fixed income securities. A higher Fund turnover will result in higher transactional and brokerage costs. Like all quantitative analysis, the adviser’s investment model carries a risk that the mathematical model used might be based on one or more incorrect assumptions. No assurance can be given that the fund will be successful under all or any market conditions. Overall equity and fixed income securities market risks affect the value of the Fund. Factors such as domestic economic growth and market conditions, interest rate levels, and political events affect the securities markets. The earnings prospects of small and medium sized companies are more volatile than larger companies and may experience higher failure rates than larger companies. Options Risk: There are risks associated with the sale and purchase of call and put options. As the seller (writer) of a put option, the Fund will tend to lose money if the value of the reference index or security falls below the strike price. As the seller (writer) of a call option, the Fund will tend to lose money if the value of the reference index or security rises above the strike price. The Fund may lose the entire put option premium paid if the reference index or underlying security does not decrease in value. The Fund may lose the entire call option premium paid if the reference index or underlying security does not increase in value. Click HERE for the current NFDIX prospectus. |
DefinitionsBeta: Beta is a measure of a security’s or portfolio’s volatility relative to the market as a whole. A security or portfolio whose beta is greater than one has historically experienced a greater change in price than overall market prices; while, a security or portfolio with a beta of less than one has historically experienced a price change which is less than the price changes realized by the market as a whole. Basis Points (BPS, bps): Basis points are used to refer to an increment of 0.01%, or 1/100th of 1%. For example, an investment that has increased in value by 0.50% would be said to have “increased by 50 basis points.” |
Footnotes1Capital efficiency is the ability for investments to gain exposure to a particular market while using fewer assets. 2Residual contribution refers to the difference in total return between the generated contribution analysis and the actual fund return. 3The Fund’s investment advisor has contractually agreed to reduce its fees and/or absorb expenses until at least August 1, 2024. Without these waivers, the Class I Shares total annual operating expenses would be 1.32% as of the August 2022 prospectus update. The fee waivers ensure that the net annual, operating expenses of the Class I Shares will not exceed 1.25% subject to possible recoupment from the fund in future years. Please review the Fund’s prospectus for more information regarding the Fund’s fees and expenses. 4Technically, if we invested the remaining $33.34 in the Bloomberg Treasury Bill Index, both scenarios would lose an equal dollar amount. 5https://advisors.vanguard.com/iwe/pdf/IARCQAA.pdf
|
Editor’s Note: The summary bullets for this article were chosen by Seeking Alpha editors.
Be the first to comment