

style-photography/iStock via Getty Images
The S&P 500 Index (SP500) is down -8.4% from September 13 (-24.7% YTD), following a higher-than-expected August CPI print that spooked the equity market and triggered a sharp sell-off. The upcoming September CPI data release could potentially set the market bottom, providing a great opportunity for investors with a bullish outlook on the S&P 500.
The general market remains overwhelmed by fear that inflationary pressures could lead to even more aggressive monetary tightening by the Federal Reserve, thereby increasing the risk of a deep and painful recession. We are now just hours away from the September CPI data release, and the Cleveland Fed’s latest inflation nowcasting suggests that another selloff in the S&P 500 may be on the cards.
Cleveland Fed Inflation Nowcasting (Federal Reserve Bank of Cleveland)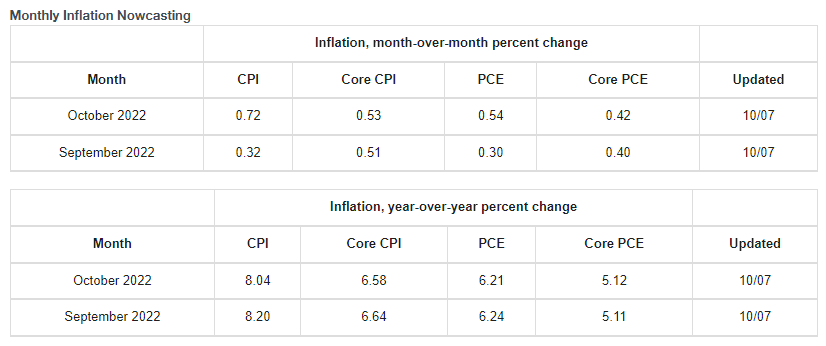
The Cleveland Fed’s inflation nowcasting model uses real-time data to estimate Core CPI as well as the Fed’s preferred inflation gauge, the Personal Consumption Expenditures price index (PCE). By both measures, the nowcasting data show that month-on-month inflation is accelerating in October compared to the September reading.
Priced In Or Not?
It is difficult to tell how much of this bad news has already been priced into the S&P 500. But trying to guess what the market is thinking sounds like a fool’s errand. Instead, investors are better off focusing on the general trend of inflation rather than the noise from monthly CPI data. And worse, tracking the higher frequency and ever more short-sighted nowcasting model we have just shared.
Nevertheless, this short-sightedness and fickle-minded spirit of short-term traders push stock prices to extremes, and this actually works to the benefit of longer-term investors. And it is our job to take advantage of this behavioural flaw. When sentiment becomes overwhelmingly bearish, prices often get driven to levels that provide a rare opportunity to pick up shares at a heavy discount.
The chart below shows that investor sentiment has rarely been this pessimistic in the last decade.
AAII, YCharts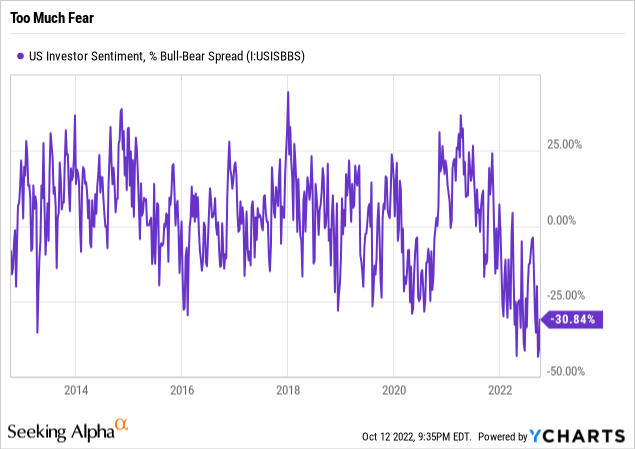
Another chart, which goes back to the 1970s, also shows that consumers have rarely been so pessimistic about the economy. More importantly, whenever consumer sentiment is at extreme lows, subsequent 12-month returns for the S&P 500 have been exceptional (averaging 24.9% over the past 8 sentiment troughs).
JPMorgan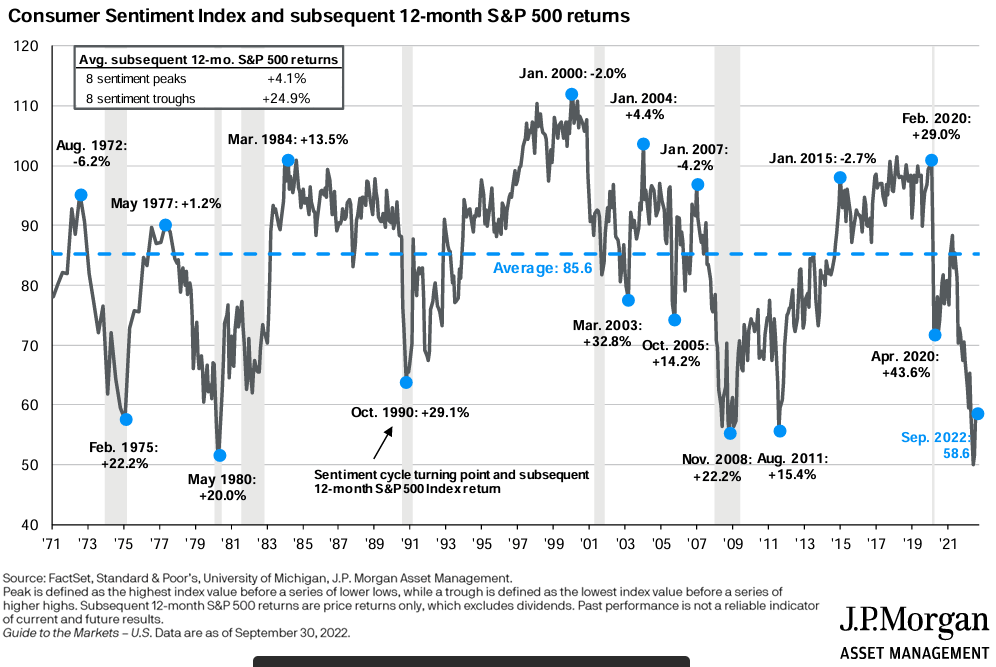
Inflation Will Trend Lower So Long We Do Not See Another Spike In Commodity Prices
Taking a more forward-looking view, the outlook for consumer price inflation appears to be in pretty good shape. We continue to see evidence of moderating inflationary pressures broadly across commodity prices, while supply-side disruptions continue to unwind.
The chart below shows the Bloomberg Commodity Index, which reflects price movements broadly across commodity futures markets. Since June, prices for commodities, which affect input costs for producers of all kinds of consumer goods, have broadly declined.
Investing.com, Bloomberg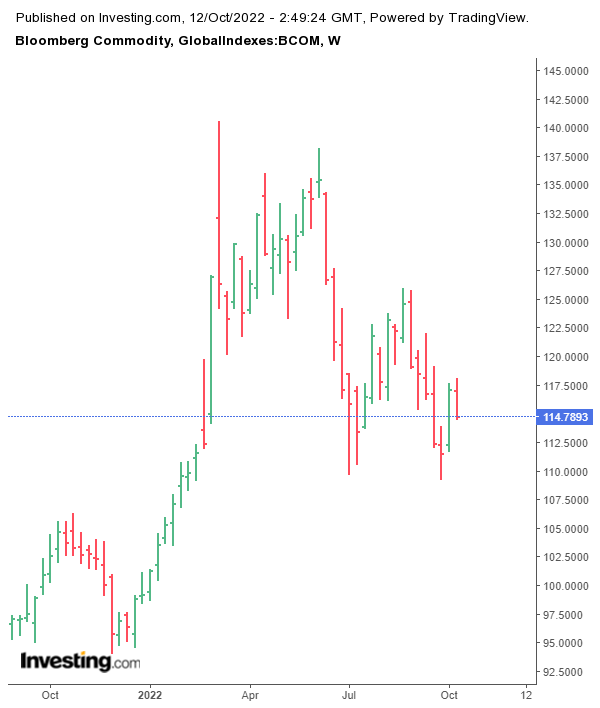
Despite the October 5 agreement by OPEC+ member countries to cut crude oil production by 2 billion barrels per day, we view the cut as more of a measure by the cartel to keep prices stable within the US$80-90/bbl range. So long as crude oil prices do not spike beyond US$120/bbl, we remain optimistic on the outlook for inflation.
Meanwhile, supply-chain bottlenecks caused by lockdowns during the pandemic and exacerbated by inventory restocking as the economy reopen, are also unwinding. The chart below shows the New York Fed’s Global Supply Chain Pressure Index, which tracks transportation cost data and manufacturing surveys to gauge global supply chain conditions. Once again, the index suggests supply chain conditions have improved steadily in recent months.
New York Fed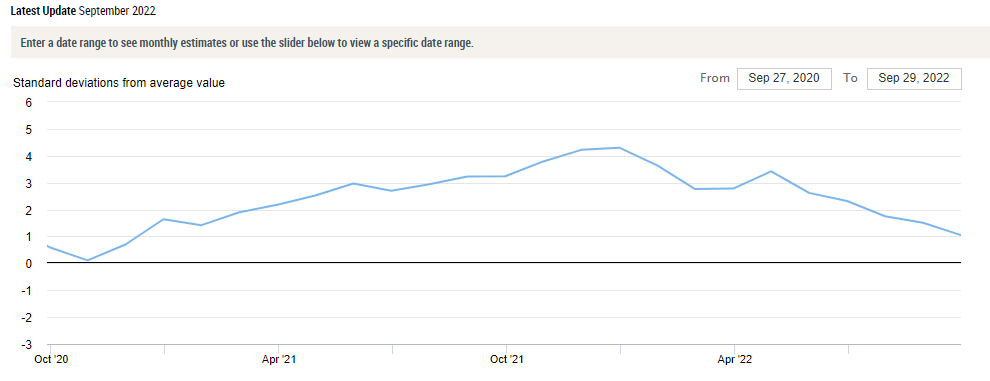
In line with the evidence we have highlighted above, we expect CPI data to continue on its downward trajectory towards the end of 2022 and into 2023.
In fact, prices do not have to be in a sustained decline for CPI data to trend lower. Prices only need to stay flat for year-on-year measures of CPI to trend lower due to base effects. For a good and detailed explanation of why the math of inflation may look worse when we only look at year-on-year data, see Inflation Math Can Make Things Seem Worse.
So long as commodity prices continue to decline or remain stable while supply-side disruptions continue to unwind, the next couple of CPI prints should reaffirm our view that inflation is largely driven by supply-side factors and will ultimately be transitory.
Technical Picture Is Looking Good
The technical picture for the S&P 500 is also beginning to look compelling. Using a longer-term Fibonacci Retracement extending from the S&P 500’s March 2020 low to its all-time high in January 2022 shows strong technical support around the 3,500 level.
If the 3,500 level holds, we see a potential rebound back towards 3,800. A successful and decisive break above this level would then suggest further upside towards 4,200, possibly by the end of 2022.
Investing.com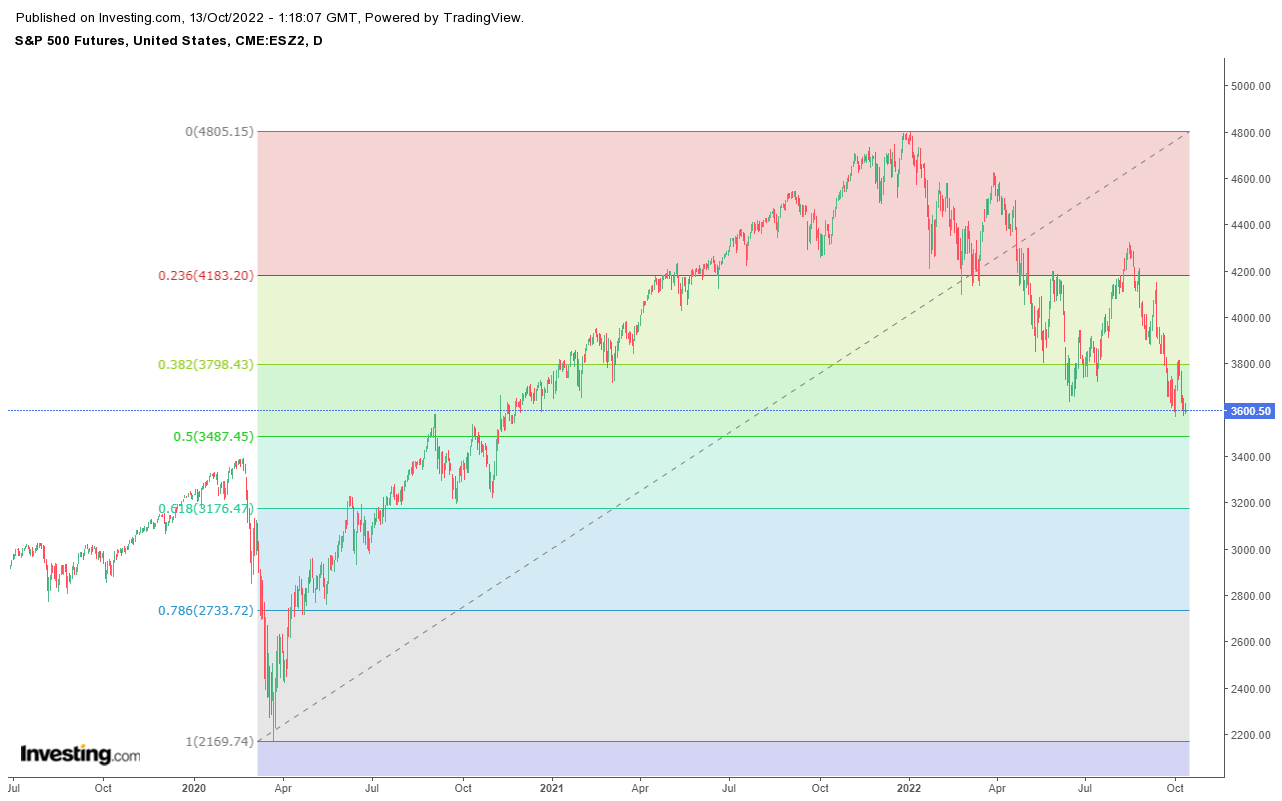
In Conclusion
We view the current pessimism in the equity market and concerns that persistent inflation will force the Fed to drive the economy into a deep and painful recession as largely unwarranted.
Instead, we view the recent selloff in the SP500 as an attractive opportunity for investors looking to enter the market. We see the SP500 setting up for a forceful rally through the remainder of 2022.
Be the first to comment