

Amazing Nature Photography
Adapting to market conditions is key in these challenging times. Hence, timely updates of theses that have played out are key. We bring you one update today and tell you why the trade is more or less done. We also go over why a certain prized distribution is likely on the chopping block.
The Trade
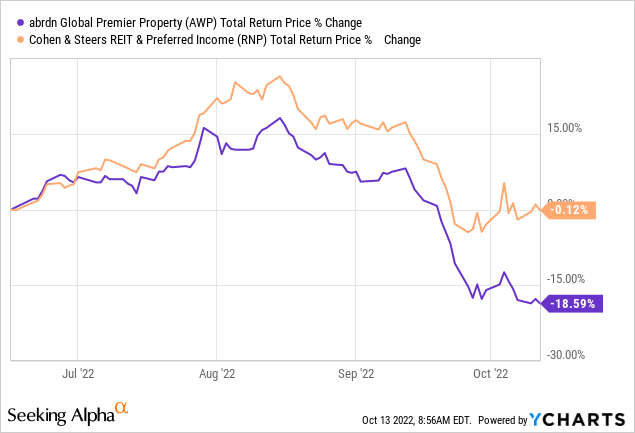
A few months back we took the stand that Cohen & Steers REIT & Preferred Income Fund (NYSE:RNP) was far, far better than Aberdeen Global Premier Properties Fund (NYSE:AWP). That was based on 4 exceptionally strong advantages for RNP. Normally, you tend to have 1 or 2 of these factors in one direction when you compare these funds. But in mid-June, all 4 of these lined up to support RNP and cast a shadow over AWP. That was a huge advantage in making the call. The result? Priceless.
AWP lost 18.59% and RNP managed to do a cliffhanger flatlining act.
We tell you why we are no longer confident that RNP can continue to outperform here and why we think the funds should move more in line with each other. We will also go over why AWP’s distribution likely drops by 25% very soon.
Factor 1
The relative discount between the two funds is one we look at first. Ideally, two equally well (or badly) performing funds should trade at the same discount or premium to NAV. For the RNP/AWP pair, we had the most hilarious setup, with the far better performing of the two, RNP trading at a bigger discount. AWP traded at a 2% discount to NAV while RNP’s discount approached 9% in June.
Relative Discount Chart From Previous Article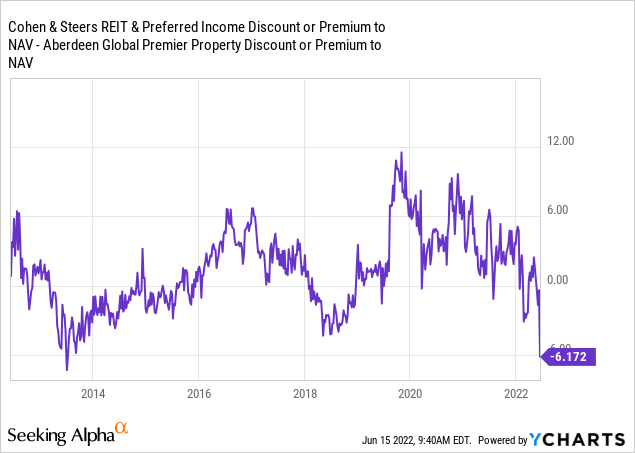
The spread was one of the worst ever and seemed to completely forget that RNP had thrashed AWP over the long run. Where are we today? You won’t believe this, but we are at the exact opposite end. RNP now rightly trades near NAV and AWP rightly trades at a 6% discount to NAV. This has created a 6.17% premium spread in favor of RNP.
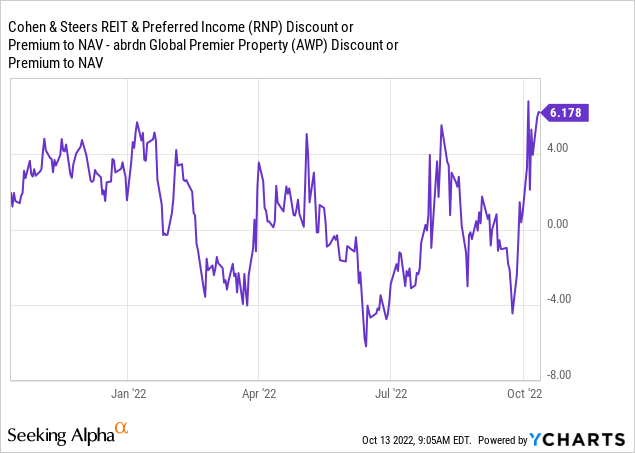
What a difference a few months can make. RNP is unlikely to improve on this much and possibly could lose a little ground here in the short term. Hence we are moving this factor to neutral.
Factor 2
AWP had and continues to have a huge foreign exposure. RNP does have some overseas exposure as well, but it is minute in comparison. Expecting a very strong US Dollar made it easy for us to ring this factor in favor of RNP. We are now looking for the final peak in the US Dollar soon and are ready to pivot away from this call. This factor likely becomes a tailwind for our beaten-up friend AWP and we move this to a positive for AWP relative to RNP.
Factor 3
Forward performance is not something we can extrapolate easily from the past. RNP has of course done far better.
CEF-Connect RNP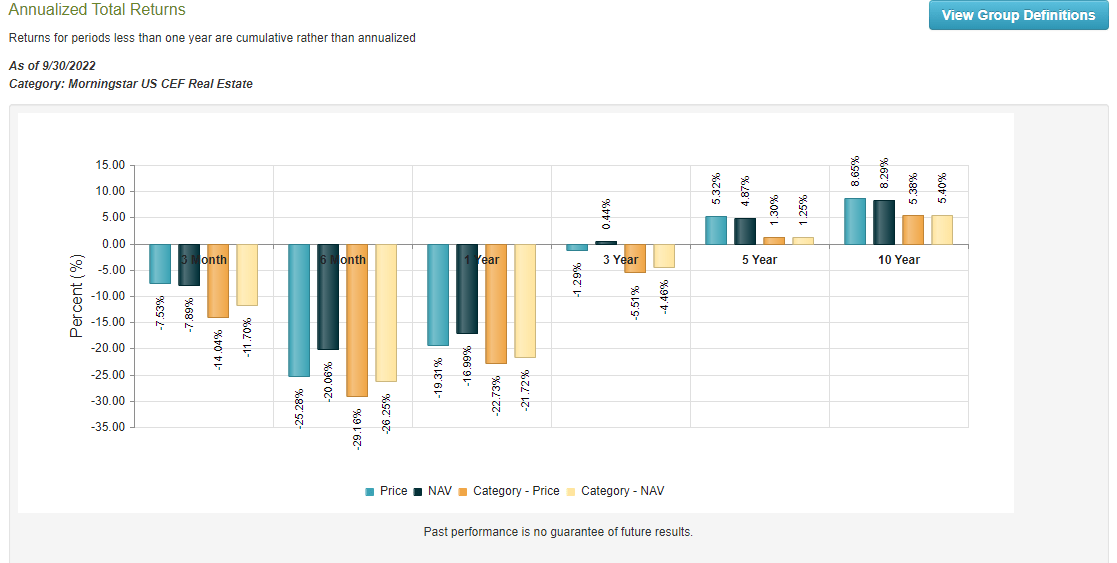
AWP has not managed to earn even a modest fraction of its distribution paid out.
CEF-Connect AWP
We think in the longer term, RNP still comes out ahead but in the shorter term, AWP could do better. This comes from AWP’s holdings being far more oversold than RNP’s. We move this factor to neutral for now.
Factor 4
AWP is a common equity fund while RNP holds a balance of preferred shares and common shares. We think that common equity holdings in REITs are likely to rebound more on the next bounce than preferred shares. The latter has been beaten down less and are moving as bond proxies at the moment. We move this to a slight positive for AWP.
Verdict
The four factors now weigh slightly in AWP’s favor after this post-CPI bloodbath. We hence think the trade is over and we can weigh the two at about the same level. While that is our relative verdict, we do want to touch on AWP’s distribution. Currently, AWP pays 4 cents a month and that works out to a very huge distribution yield.
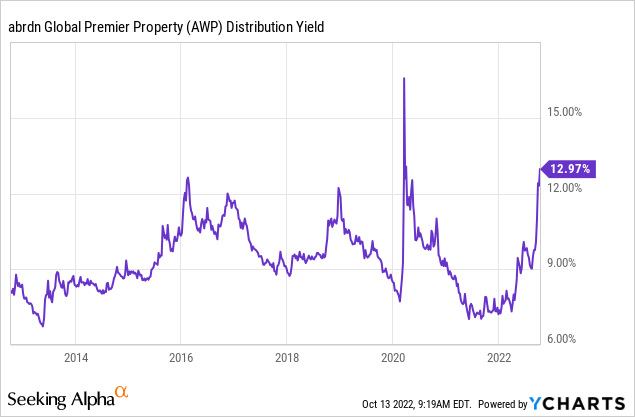
As we stated earlier, AWP is not “earning” even half of this and hence the price has dropped by 50% over the last 10 years.
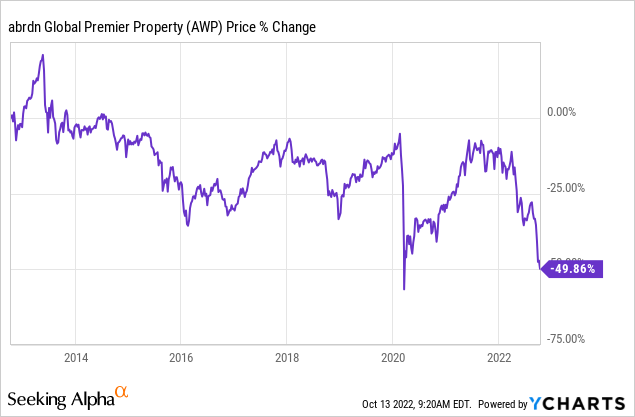
Interestingly, the total returns were almost the same, whether you reinvested your distributions or took them in cash. The current payout is above the 2018 levels, where the distribution was cut. Yes, the yield did go higher in 2020, but it was extremely brief and met by quantitative easing. Here, there are different pressures and the NAV erosion is very substantial. We think the distribution likely gets cut within 12 months.
Kenny Loggins “Danger Zone” Scale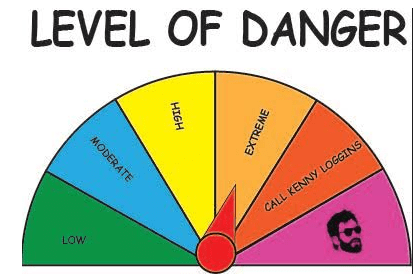
This rating signifies a 50-75% probability of a dividend cut in the next 12 months.
Please note that this is not financial advice. It may seem like it, sound like it, but surprisingly, it is not. Investors are expected to do their own due diligence and consult with a professional who knows their objectives and constraints.
Be the first to comment