Alistair Berg
Market ups and downs continue to be present, but the results of the leading equity instruments can undoubtedly be considered positive, given the context in which we find ourselves. For us European investors, if we look at the situation with an overall portfolio view, things have hardly been too bad so far. In fact, in addition to the market recovery of the last month and a half, those who have an investment with a neutral exposure would have a good part of their assets in dollars today because obviously, the companies with the highest capitalization are precisely American. Moreover, we know that the dollar has appreciated enormously against the euro over the past 12 months, contributing to the rapid recovery. But beyond the market results, like every quarter, it’s interesting to understand the market situation and to be able to give some ideas for us as knowledgeable investors who don’t want to be lured by market runs.
Better-than-expected quarter
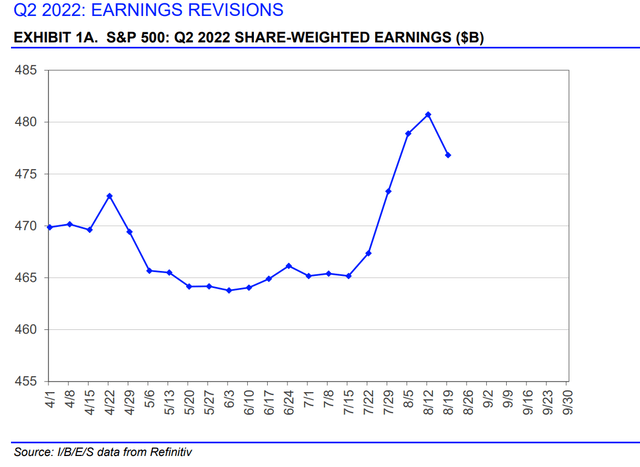
To analyze the situation, I always like to start with the last quarter’s results. Aggregate earnings for the S&P 500 (NYSEARCA:SPY) were more or less in line with expectations. As we see from the chart, earnings have been revised upward slightly over the past few weeks, but slightly higher than expected earnings around April.
The trend is always the same, with the market dragged by energy companies that almost quadrupled their earnings compared to the same quarter last year. In contrast, classic cyclical companies had significant declines, as we can see from the results of the consumer discretionary, financial, and communication services sectors. In fact, excluding energy, earnings growth would be negative year-on-year.
Margins
As noted in the first quarter, marginality is significantly impacted. Aggregate sales grew by more than profits, at +13.7% and +8.8%, excluding energy. From this point of view, the inflation situation certainly had an impact. And here, we can already begin to make a point. In fact, with the latest positive data for the U.S. CPI in July, people have started to snub the inflation-related issue much more in recent weeks. July was undoubtedly a positive month, but one cannot draw too many conclusions from one piece of data. In particular, the number was primarily affected by declines in energy.
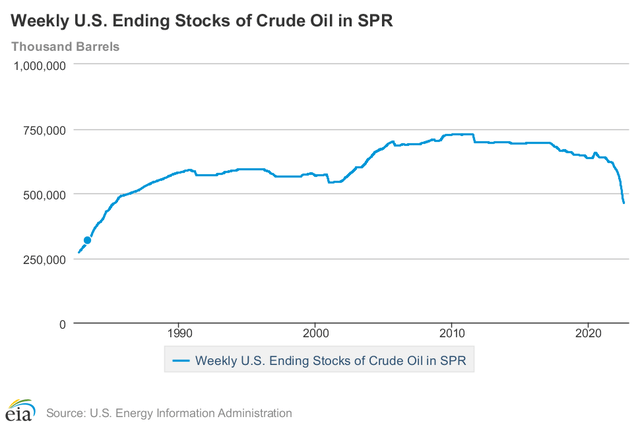
From the energy point of view, the arrival of winter is also underestimated. Unfortunately, geopolitical tensions do not seem to be calming down, and Russia still has the gas weapon, which Europe will certainly still need, at least for the coming winter. In this situation, energy prices can surge again at any time, even given that the strategic oil reserves released by the United States are dwindling. Reserves have reached low levels that have not been seen since 1985. Moreover, the plan is to release these reserves by the United States may the end of next October, bringing further pressure to energy prices.
Expected profits for the next four quarters
In this situation, do analysts expect the situation to worsen? Not really. Indeed the expectation is for $232.6 in earnings per unit of the S&P 500 over the next four quarters. In general, the expected growth in earnings is about 8% for 2022 and 2023. But we will discuss this in more detail at a later date.
The evaluation of the index
How can one think of a congruous price for the S&P 500? Usually, what is done by the various analysts is to find a congruous multiple for the market, given the earnings expectations. For earnings, we have already had the first perplexities, but taking the $232 expected by analysts as good, is the current multiple precisely congruous with the market situation?
The market today is at a forward price-earnings ratio of 18.4. How can one tell whether this multiple is appropriate for the market?
What is the multiple? The multiple is nothing more than a function of monetary policy and earnings growth:
- As the yield on the bond market grows, through a rise in interest rates, the yield demanded by the stock market will be higher as alternatives are created, such as bond investment.
- Secondly, the country’s overall economic situation, but in particular the growth of the firm’s profits in the index: as with stocks, a market that grows more is more valuable than one that has stagnant or declining profits.
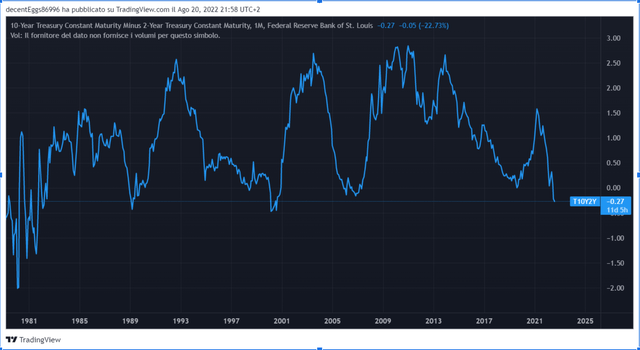
How is the United States doing in that respect? Well, we know that interest rates have been increased aggressively. However, the 10-year remains at not excessively high levels, more or less in line with what we had been used to seeing between 2013 and 2019. Add to this an inverted yield curve for quite some time now.
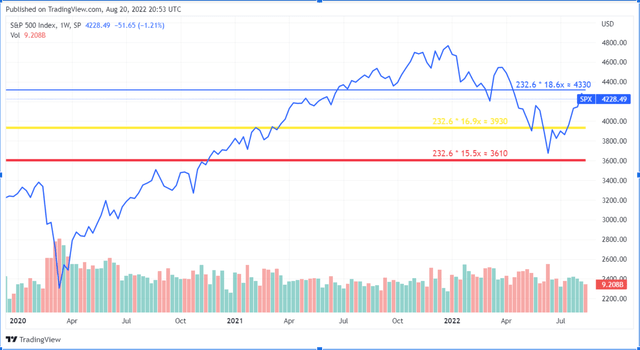
Recall that an inverted curve at some points, in this case between 2 and 10 years, can favour depending on the duration and magnitude of a recession. Now, compared to the brief reversal in March, which was talked about so much on social media, but which had no value because of its minimal magnitude and very low duration, we are in a worse situation, with an inversion that has gone up to almost 50 basis points and the situation that has been going on for more than 40 days. On the other hand, is the current multiple justified? Today the forward multiple is at 18.2. In this chart, I show you the various levels of the S&P 500, given the earnings expected by analysts and the historical average of the forward PE over the past 5, 10 and 15 years.
In these cases, the S&P 500 would then have targets of about 4300, 3900, and 3600, respectively. So which of these three numbers can make the most sense if we believe the analysts? If we want to simplify the discussion and base it only on expected earnings growth, we see how, over the past five years, earnings have had an aggregate growth of just over 14%, while over the past ten years, an aggregate growth of 8% per year. Simplifying the whole macro discourse and relying only on expected earnings and expected growth, at present, the 10-year average seems more appropriate than a 5-year average, and this would result in a fair price of 3900 for the S&P 500, still not exaggeratedly lower, a 7% lower than where we are today.
As we said, we add the risks of analysts’ forecasts. But, as we know, many analysts follow market moods rather than venture into projections that might deviate from the outcome. Right now, indeed, what the consensus is showing is a belief that we may get to the so-called “soft landing” that would allow the U.S. economy to pass through the recessionary period without too much trouble, with still expected rising profits. Obviously, with declining profits, there would be, on the one hand, an actual decline in the target price of the S&P 500 and, on the other hand, a decrease in the expected multiples, precisely because of a more negative outlook than expected. This is why forward multiples and the historical average of multiples of the S&P 500 should be taken with caution, especially for those with shorter time horizons.
To this, we still add the risks of a new worsening of the energy situation and more robust interest rate hikes than expected by the market, which is back in total euphoria, discounting much lighter hikes than may be possible, should inflation data not continue to fall in the coming months.
So what can be done?
To date, I really struggle to be optimistic about the next 6-12 months, and I believe that surprises and pitfalls are just around the corner. How to set up your portfolio according to these ideas is another matter. A lot will depend on your time horizon, risk profile and ability to save against the portfolio. For those with a shorter time horizon (because perhaps they are older, have little savings capacity relative to the portfolio, thus creating little “new” liquidity to invest), and have invested in the declines of the first half of the year, it might indeed make sense to pull the oars in the boat and take some of the gains created by this rally. This is because, in any new market decline, it would help to have part of the portfolio liquid to precisely take advantage of a decline that is certainly possible. But, on the other hand, younger and more risk-averse might stand by and watch because it might make more sense for them to accept that they could see their invested assets fall because it would still be relatively less significant for their higher savings capacity relative to the portfolio’s counter value.
In short, first and foremost, there is to assess one’s personal, financial and psychological situation, after which to have a strategy for the accumulation and decumulation of liquidity in a situation as volatile as the one we are experiencing in the last year. The important thing is to be clear about why you are investing and not simply try to guess whether the latest rise might be a market reversal or a bear market rally because we will only know that in retrospect anyway.
A little statistical pill before we close: the S&P 500, from the post-war period to the present, after entering a bear market, and recovering more than 50% of what it had lost before, as happened precisely after this recent market rally, has never collapsed again touching new lows. Will this be the first time this statistic is disproven, or will we not reach new lows? Let me know what your idea is by leaving a comment.


Be the first to comment