

Sundry Photography
In this analysis of Renesas Electronics Corporation (OTCPK:RNECF), we analyzed the company’s MCU business segment which represented 38% of revenue and is its second-largest product segment behind Analog at 41% of revenue. As seen in the chart below, the company had lost market share in the past 3 years of the MCU market and lost its market leadership position to NXP (NXPI) in 2021 as it had higher average revenue growth of 12.1% compared to 8.8% for Renesas.
As the company lost market share in the MCU market, we analyzed its revenue growth in the past 3 years based on its MCU revenue as well as the company’s reported revenue segment breakdown. Furthermore, we compared the company’s MCU product portfolio to determine if it has a performance and product breadth advantage over competitors. Lastly, we analyzed the company’s MCU revenue based on its automotive MCU revenue and non-automotive MCU revenue.
Omdia, Khaveen Investments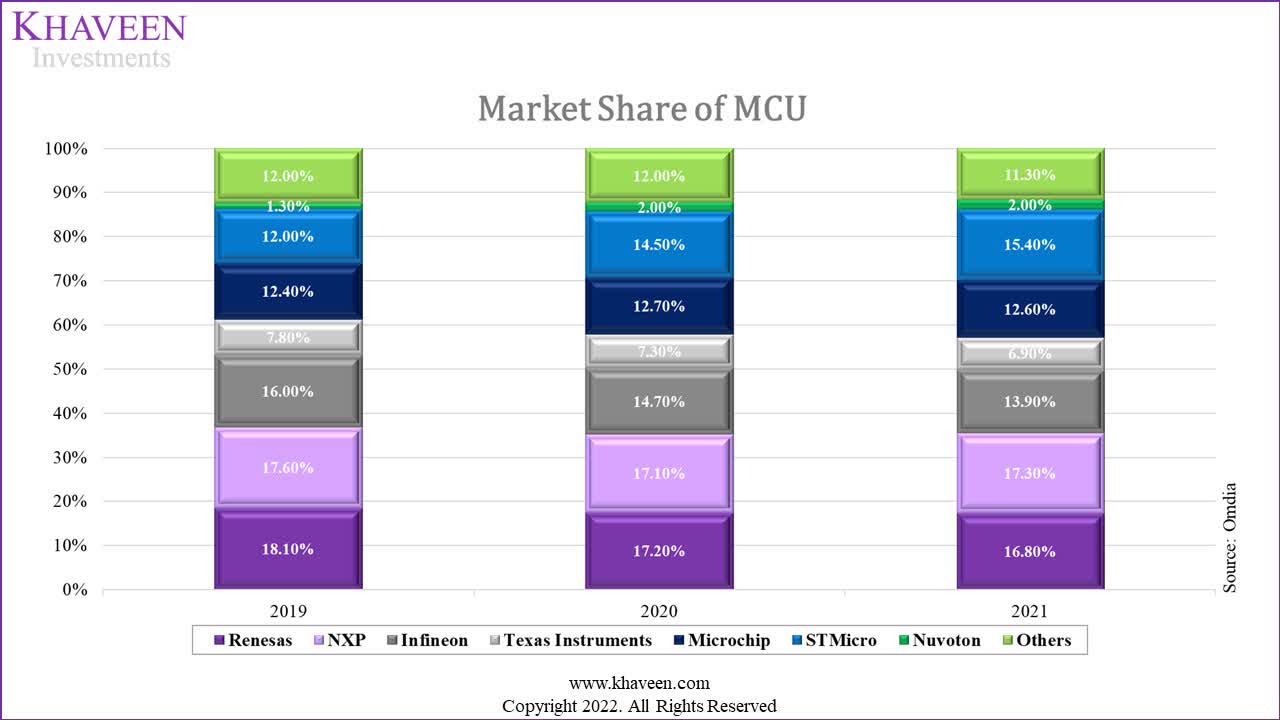
Positive But Below Average MCU Revenue Growth
|
MCU Revenue Growth % |
2020 |
2021 |
Average |
|
Renesas |
-6.1% |
23.6% |
8.8% |
|
NXP |
-4.0% |
28.1% |
12.1% |
|
Infineon (OTCQX:IFNNY) |
-9.2% |
19.7% |
5.3% |
|
Texas Instruments (TXN) |
-7.5% |
19.7% |
6.1% |
|
Microchip (MCHP) |
1.2% |
25.6% |
13.4% |
|
Average |
12.1% |
Source: Omdia, Khaveen Investments
Based on the table above, the company’s MCU revenue grew at an average of 8.8% in the past 2 years based on Omdia data. This is below the average growth of the top 5 competitors including NXP, Infineon, Texas Instruments and Microchip. Among these competitors, Microchip had the highest growth rate followed by NXP. Therefore, despite Renesas losing market share, the company’s MCU revenue still had positive growth but at a lower average than its competitors.
Additionally, we analyzed the revenue breakdown of the company’s segment in the past 5 years in the table below.
|
Segment Revenue (JPY mln) |
2017 |
2018 |
2019 |
2020 |
2021 |
Average |
|
Automotive |
413,082 |
389,683 |
371,145 |
341,001 |
462,309 |
|
|
Growth % |
-5.66% |
-4.76% |
-8.12% |
35.57% |
4.26% |
|
|
Industrial/Infrastructure/IoT |
353,428 |
346,569 |
329,705 |
363,609 |
515,547 |
|
|
Growth % |
-1.94% |
-4.87% |
10.28% |
41.79% |
11.32% |
|
|
Other |
12,745 |
20,521 |
17,393 |
11,063 |
16,562 |
|
|
Growth % |
61.01% |
-15.24% |
-36.39% |
49.71% |
14.77% |
|
|
Total Revenue |
779,255 |
756,773 |
718,243 |
715,673 |
994,418 |
|
|
Growth % |
-2.9% |
-5.1% |
-0.4% |
38.9% |
7.65% |
Source: Renesas, Khaveen Investments
As seen above, the company’s two main segments are Automotive and Industrial/Infrastructure/IoT. The company had average total revenue growth of 7.65%. The company’s Industrial/Infrastructure/IoT segment had higher revenue growth than its automotive segment at an average of 11.32% compared to 4.26%.
Thus, despite the company losing market share, we believe it still had positive revenue growth but underperformed compared to competitors, which could indicate the company’s disadvantage in MCUs against competitors with below-average growth.
Performance and Product Breadth Disadvantage Compared to Competitors
To identify the possible factor for its low growth compared to competitors, we compared the company’s MCU products in the table below based on maximum frequency performance, bit size, and RAM to determine whether Renesas has superior performance compared to competitors. Additionally, we compared the companies in terms of the breadth of their portfolios by the number of MCU products listed on Digikey.
|
Overall MCUs |
Max Frequency Performance (MHz) |
Bit Size |
Max RAM (‘mb’) |
Number of Products |
|
Texas Instruments (Arm-based MCUs) |
800 |
24 |
5.12 |
21,455 |
|
Renesas (RX Portfolio) |
240 |
32 |
1.024 |
15,637 |
|
NXP (ARM Cortex-M MCUs Powerhouse Portfolio) |
528 |
32 |
0.256 |
31,216 |
|
Infineon (AURIX 32-bit) |
300 |
32 |
6.912 |
33,206 |
|
Microchip (PIC32MZ EF) |
300 |
32 |
0.64 |
57,924 |
|
Average |
434 |
30 |
3 |
31,888 |
Source: Company Data, Digikey, Khaveen Investments
Based on the table, Renesas RZ portfolio has the lowest maximum frequency performance compared to competitors with similar bit sizes to NXP, Infineon and Microchip but with lower max RAM capacities than the average. Thus, we believe this indicates the performance disadvantage of Renesas over competitors. Furthermore, in terms of product portfolio breadth, Renesas has the lowest number of total products from Digikey which highlights its weakness compared to competitors. In comparison, Microchip has the highest number of products and the highest revenue growth in the overall MCU market as discussed in the first point.
Therefore, we believe that Renesas has a weaker portfolio breadth compared to its competitors of the top 5 MCU suppliers with the lowest number of products on top of its performance disadvantage with lower than average frequency and max RAM capacities.
Automotive MCU Growth Higher Than Non-Automotive MCU
Moreover, we analyzed the company’s MCU business for its automotive segment. In the table below, we compiled the market share data from Strategy Analytics of the automotive MCU market share.
Strategy Analytics, Khaveen Investments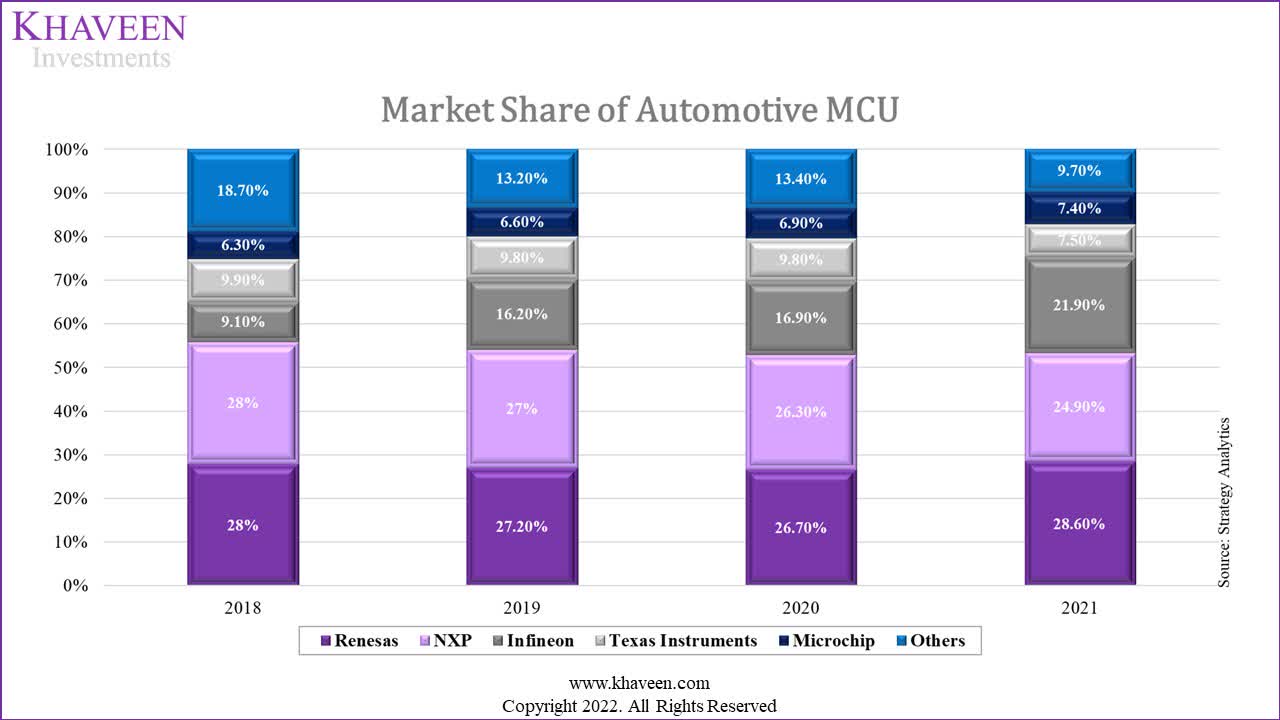
|
Company |
Average 2-year Automotive MCU Revenue Growth |
Average 2-year Non-Automotive MCU Revenue Growth |
|
Renesas |
12.50% |
4.20% |
|
NXP |
4.50% |
21.50% |
|
Infineon |
29.20% |
-11.10% |
|
Texas Instruments |
-5.40% |
16.80% |
|
Microchip |
15.60% |
12.90% |
|
Average |
11.30% |
8.90% |
Source: Strategy Analytics, IC Insights, Khaveen Investments
Based on the table above, Renesas’ market share in automotive MCU declined from 28% in 2018 to 2020 but recovered in 2021 and maintained its market leadership with a 28.6% market share with average revenue growth of 12.5% in the past 2 years. The only companies with above-average revenue growth were Renesas, Microchip and Texas Instruments. On the other hand, NXP continued to lose market share from 2018 and joined Texas Instruments as the only other company within the top 5 to lose share. Meanwhile, Infineon close the gap on NXP and its share surged in 2019 following its acquisition of Cypress. Moreover, Microchip also gained market share but remained in the 5th position.
In comparison, we calculated the non-automotive MCU revenue growth among the top 5 competitors. Renesas has below-average growth compared to its competitors at 4.2% in the past 2 years while NXP has the highest growth as it overtook Renesas to become the market leader. Thus, despite its high Industrial/Infrastructure/IoT segment revenue growth, its non-automotive MCU revenue growth had been lower than its automotive MCU revenue growth. Based on the company’s presentation, its Analog revenue as a % of total revenue had increased from 30% in 2019 to 41% in 2021 whereas its MCU revenue declined from 47% to 38% in the period. Thus, we believe that the company’s higher Industrial/Infrastructure/IoT segment growth compared to its automotive could be due to the superior growth of its Analog product revenue.
|
Automotive MCUs |
Max Frequency Performance (MHz) |
Bit Size |
Max RAM (‘mb’) |
Number of Products |
|
Texas Instruments (TMS570, TMS320F28x) |
300 |
32 |
0.516 |
87 |
|
Renesas (RH 850) |
400 |
32 |
5.12 |
23 |
|
NXP (MAC57D5xx MCUs) |
320 |
32 |
1.3 |
35 |
|
Infineon (AURIX 32-bit TriCore) |
300 |
32 |
6.912 |
198 |
|
Microchip (PIC32MZ EF, SAM V7x) |
300 |
32 |
0.64 |
198 |
|
Average |
324 |
32 |
3 |
108 |
Source: Company Data, Digikey, Khaveen Investments
Based on the table, we analyzed the company’s automotive MCU portfolio based on maximum frequency performance, bit size and RAM capacity as well as the number of products. Renesas RH 850 portfolio has the highest frequency performance and above-average maximum RAM capacities which indicates its performance advantage. Though, it has the lowest number of products which highlights its weaker product breadth. Infineon and Microchip, the two companies with the highest average revenue growth had the largest portfolio breadth (198 products). Although Renesas has the lowest number of products, it had above-average revenue growth which we believe could be due to its performance advantage over competitors with the highest frequency performance.
Risk: Tight Supply
Based on the company’s latest earnings briefing, management indicated that the company’s utilization rate was over 90%. Additionally, the company’s utilization rate had increased since Q1 2020. We believe this highlights the tight supply situation of the company and could pose a threat to its revenue growth outlook.
Verdict
All in all, despite the company losing market share of the overall MCU market to NXP in 2021, the company still had positive MCU revenue growth but lower than its competitors at an average of 8.8% compared to 12.1% for the top 5 companies and positive growth across both Automotive and Industrial/Infrastructure/IoT segments. Based on a comparison of the top 5 companies’ portfolios, we determined that Renesas has a disadvantage in terms of product performance and its portfolio breadth with the lowest number of products. Furthermore, we compared the company’s automotive and non-automotive MCU revenue growth where its automotive revenue growth had been higher than non-automotive despite its superior Industrial/Infrastructure/IoT segment growth which we believe is due to the higher growth of its Analog products.
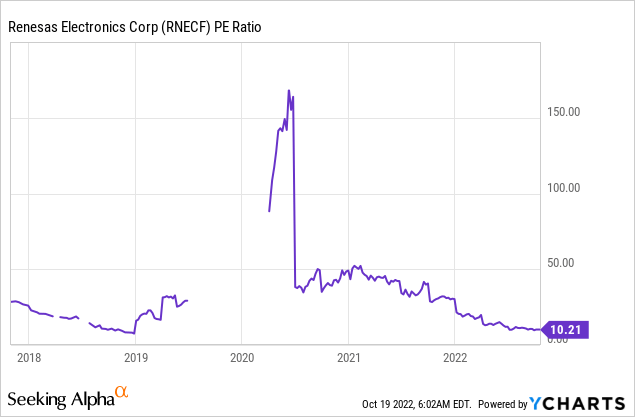
Based on the analyst consensus price target, the company has an upside of 77.9% with a target price of JPY2,176.92, thus we rate the company as a Strong Buy as its stock price had declined by 24% YTD. Moreover, the company’s current PE ratio of 10.21x is lower than its 5-year average of 37.18x, thus we believe highlights its undervaluation.
Be the first to comment