

baona
As most of you know, after many years of significantly under-performing the market, a confluence of bullish developments has the energy sector on fire this year. SM Energy (NYSE:SM) is a smallish shale O&G producer with operations in the Midland Basin of the Permian (82,000 net acres) and in the Austin Chalk formation in South Texas (155,000 net acres) and it certainly has participated in the rally (+145% YTD). The Energy Sector rally continued again today (Monday, Aug. 29th), with the Energy Select Sector SPDR ETF (XLE) +1.5% and SM +2.1%. Today, I’ll take a look at SM Energy to see if it might be a good energy stock to hold in your portfolio going forward.
Investment Thesis
After the massive impact the global pandemic had energy producers due to the drastic fall in demand, energy companies have apparently learned that the “drill-baby-drill” mantra that caused them to over-produce into an already over-supplied global market was a ticket to nowhere. Indeed, that “strategy” was a disaster for energy investors for 10-years, wherein the Energy Sector was the worst performing sector of the entire market (by far…) despite oil making multiple trips to $100+/bbl. Today, shale drillers in the US, despite 10s of billions of bbls of proven reserves, a near 100% shale drilling success rate, short-cycle drill-to-pipe times of less than two months, and breakeven points at or below $40/bbl WTI, have decided that “disciplined investment” is the way to go.
But a warning for investors: don’t be fooled by the false narrative being pushed by some energy CEOs and politicians that there is a “shortage” of oil – it’s just the opposite: we live in an age of energy abundance (as just shown above), all it takes is shale drillers willing to drill for it, or for OPEC to unleash it. However, due to Putin’s horrific war-of-choice on Ukraine and the resulting sanctions place on Russia by the United States and its Democratic & NATO allies, and OPEC’s decision to keep millions of bpd of production off the global markets, WTI is currently trading close to $97/billion, close to 2.5x the breakeven price of most shale O&G producers these days. That being the case, let’s take a look at SM Energy to see if it might be a good stock to own as the rally continues. We’ll start with earnings.
Q2 EPS Report
SM Energy released its Q2 EPS report earlier this month and it was a beat on both the top- (by $0.02/share) and bottom lines (by $176 million). Highlights included:
- Revenue of $990.38 million was up 76% yoy.
- Production of 146,600 boe/d was up 7% yoy (but down 3% sequentially).
- 57% of production came from the Midland Basin and 43% from South Texas.
- The production split was 46% oil, 39% natural gas, and 15% NGLs.
- Net income was $323.5 million ($2.60/share) compared with a net loss of $223.0 million (-$1.88/share), for Q2 FY2021.
- Free-cash-flow was a record $276.6 million, or an estimated $2.22/share based on the 124,343,000 fully diluted shares outstanding.
That all looks great, right? Now let’s take a look at what’s wrong.
My Concerns
First off, SM’s production split is only 46% oil. Most top-tier shale O&G producers are significantly above a 50% oil split.
Next, note that SM went into this rally with a heavy debt load. That being the case, the company has used the up-cycle cash-flow to pay down debt and now has a net-debt-to-adjusted EBITDA of less than 1x and expects to have less than $1 billion of debt (net of cash) by Q4 of this year. While this is all good, note that the company paid no dividends during Q2 while most all shale drillers are using their significant free-cash-flow and falling all over themselves to reward long-suffering shareholders with significant base + variable dividends. Instead of paying dividends to ordinary shareholders, SM has used YTD cash-flow of $590.9 million to pay down $551.4 million of debt.
Meantime, again – while most shale O&G producers have been buying back shares – SM’s Q2 average outstanding share count (124.343 million) was up 5.1% yoy due primarily to stock-based compensation to the executive management team. Can you say shareholder dilution?
Yet perhaps the most disappointing aspect of SM Energy is the fact that its hedging program, likely put in place due to its high debt-level going into the up-cycle, is dramatically and negatively affecting returns. Note the following chart from the Q2 EPS report reference above:
SM Energy Q2 EPS Report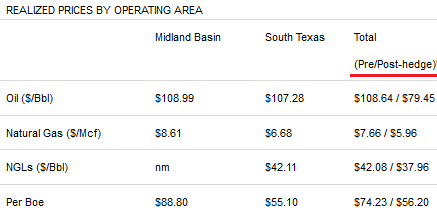
Note that despite a very strong pricing environment, SM Energy’s hedge book effectively captured only 73% of its oil production’s realized pricing potential, only 78% of its natural gas production’s realized pricing potential, and 90% of its NGLs’ potential realized pricing. Overall, SM Energy’s average realized price of $56.20/boe during Q2 equated to only 76% of what an un-hedged portfolio would otherwise have realized.
Going Forward
While SM Energy is going to likely have a solid 2H of the year due to strong market dynamics, note that the company will still significantly under-achieve what otherwise would have been possible were it not for its (lousy …) go-forward hedge book:
SM Energy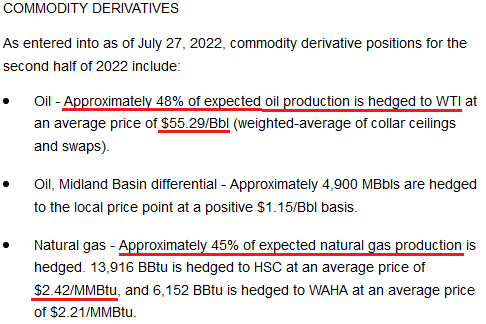
As can be seen in the above graphic, SM has 48% of 2H oil production hedged at only $55.29/bbl WTI (currently trading at $96.68/bbl) and 45% of natural gas production in a range of $2.42-$2.21/MMBtu (currently NYMEX = $9.35/MMBtu).
Risks
SM Energy, being a O&G commodity price taker, is exposed to the ups-n-downs of the global energy market. A big decline in demand due to a slowing global economy (i.e. inflation, higher interest rates, covid-19 shut-downs, etc.) could negatively impact realized pricing. That said, and as shown above, SM Energy does have downside protection due to its hedge-book … which is about the only positive aspect of that hedge book. But prices would have to fall dramatically from current levels in order for much of the hedge book to turn “green”.
SM Energy has used the current up-cycle to dramatically improve its balance sheet:
SM Energy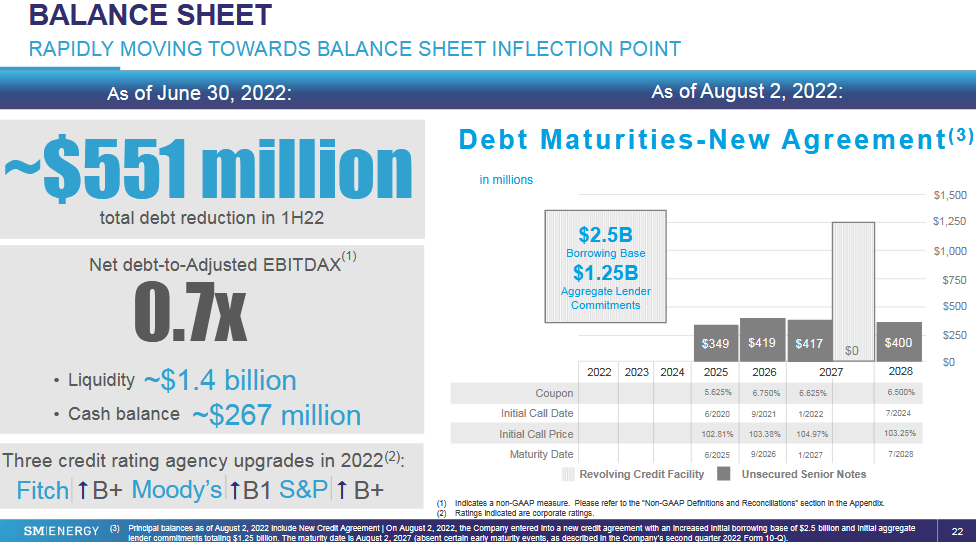
This work is to be applauded, and the credit rating agencies are certainly doing so with upgrades across the board. However, SM Energy still has $1.585 billion of rather high-cost debt (5.625% to 6.75%) coming due in years 2025-2028. That being the case, a few more quarters of debt repayment look to be in store before ordinary shareholders can expect any meaningful dividend income from the company.
On the other hand, some energy investors like to bet on the levered players. Note Occidental Petroleum (OXY) was one of the highly-levered plays that has significantly outperformed the broad Energy Sector (as measured by the XLE ETF over the past year) – and so too has SM Energy:
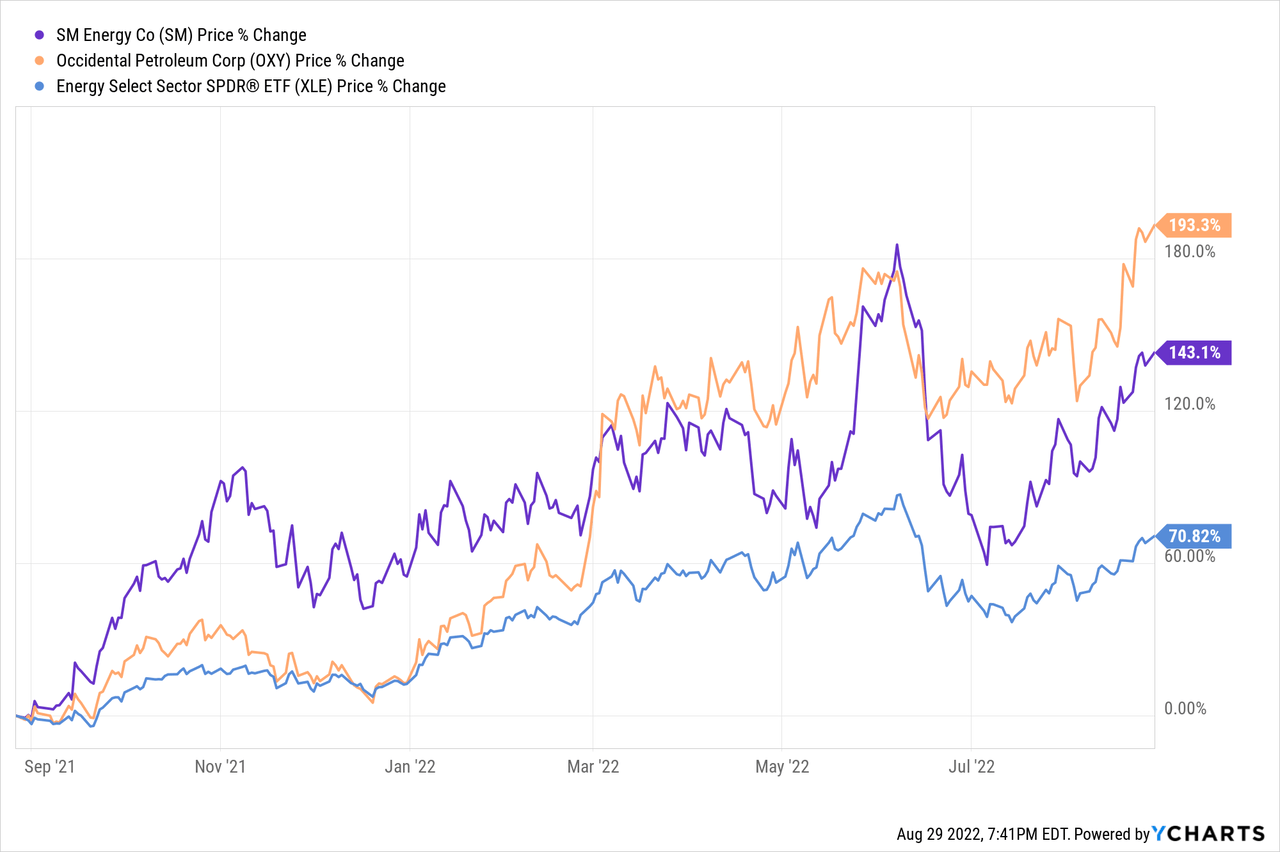
If the current strong pricing environment were to last, say, another year, SM Energy could potentially keep outperforming the broad energy sector. Yet in my opinion, and at this stage of the cycle, I’ll go with the proven producers that already have strong balance sheet and are delivering strong dividend income (and dividend growth) for investors.
Summary & Conclusion
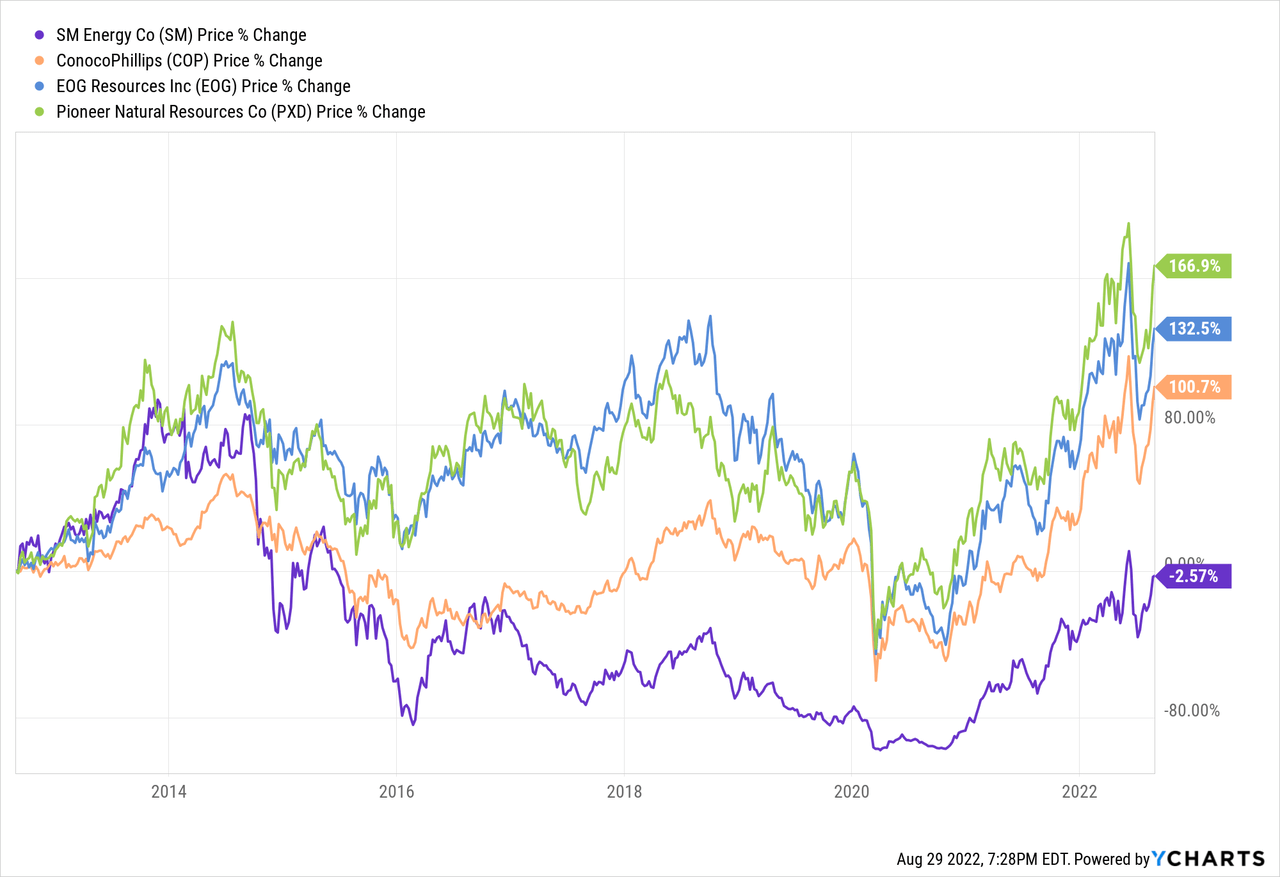
While SM Energy has some high-quality acreage and is arguably an efficient operator (long-laterals, strong well results) with a 13+ year drilling inventory, investors simply aren’t getting the income that many top-tier shale O&G producers are providing these days. And – in my opinion – shareholders won’t be getting any meaningful income for at least a couple more quarters. That being the case, investors would be much better off owning O&G producers like ConocoPhillips (COP), which has a 100% un-hedged production profile (the company believes hedging is a “zero-sum game”), or producers like EOG Resources (EOG) and Pioneer Natural Resources (PXD), all of whom have instituted base+variable dividend policies today (see PXD Could Deliver $30/share of FY22 Dividends) and already very strong balance sheets. That being the case, if I didn’t own SM Energy, I certainly would not buy it here. And if I did own SM Energy, I’d sell it and move the proceeds into COP, EOG, or PXD – all of which I expect to outperform SM Energy on a total return basis.
I’ll end with a comparison the price of SM Energy stock versus these peers over the past decade. When you add dividend payments, SM would be even a bigger laggard:
Be the first to comment