

blackdovfx
With the vision of connecting people and things everywhere and every time Skyworks Solutions, Inc. (NASDAQ:SWKS) is a wireless connection manufacturer with a very broad market and diversified product portfolio.
The company manages direct production plants and can be fast and flexible in a market that travels very fast and has very high growth rates. The global mobile network traffic is growing by 38% in the last 12 months and is quite doubled in the last 2 years. The growth and profitability data indicate that the company is in excellent health and that it has all the foundations to be able to compete and win any type of challenge in this context.
By analyzing the data of the last quarter Q4 more closely, we realize that, however, growth is slowing down slightly and that it is behind its competitors and the global market. Listening to the voice of management, the first quarter of 2023 should further testify to a slowdown due to weak demand.
In terms of share price valuation, the company seems slightly expensive. My point of view is to wait for an acceleration of revenue on the one hand and/or a purchase opportunity at a lower price on the other hand. My rate, at the moment, is Hold.
Company quick overview
Skyworks Solutions, Inc., is a wireless networking manufacturer. The company mainly designs, manufactures, and markets semiconductors used in the most varied industrial applications: automotive, aerospace, defense, medical, and smartphones as well as entertainment and gaming. The target is to connect people and things everywhere.
Among the main customers, there are names such as Amazon (AMZN), Apple (AAPL), Ericsson (ERIC), General Electric (GE), Google (GOOG) (GOOGL), Microsoft (MSFT), Samsung (OTCPK:SSNLF), Sony (SONY), and many more.
In 2021 Skyworks acquires Silicon Laboratories Inc. (automotive business) to further expand into the electric vehicle (EV) sector.
SWKS Annual Report
Market Overview
According to the last 2022 Ericsson Mobility Report, global mobile network traffic is growing at 38% in the last 12 months and is quite doubled in the last 2 years. The growth in the consumption of video content on the network is driving the global growth of wireless traffic. This is expected to increase by around 30% yearly basis until 2028.
Reading the Report about 5G and fixed wireless access:
By the end of 2022, 5G subscriptions are expected to reach 1 billion, and more smart 5G devices with additional capabilities are expected in the market during 2023. Our outlook for 2028 is that 5G subscriptions will pass 5 billion and Fixed Wireless Access (FWA) connections will reach 300 million, where 5G will account for almost 80 percent of FWA connections.
This means 5X Growth in 5G mobile connection and 3X growth in FWA connection.
The IoT connections are expected to grow at 18% CAGR until 2028
With 5G and video demand as the main catalysts for the growth in connectivity demand, the market is expected to grow at a very high rate (30% annually) for the next 5 years.
Financial and Highlights
Revenue and Profitability
SWKS 10-K Form + Author Graph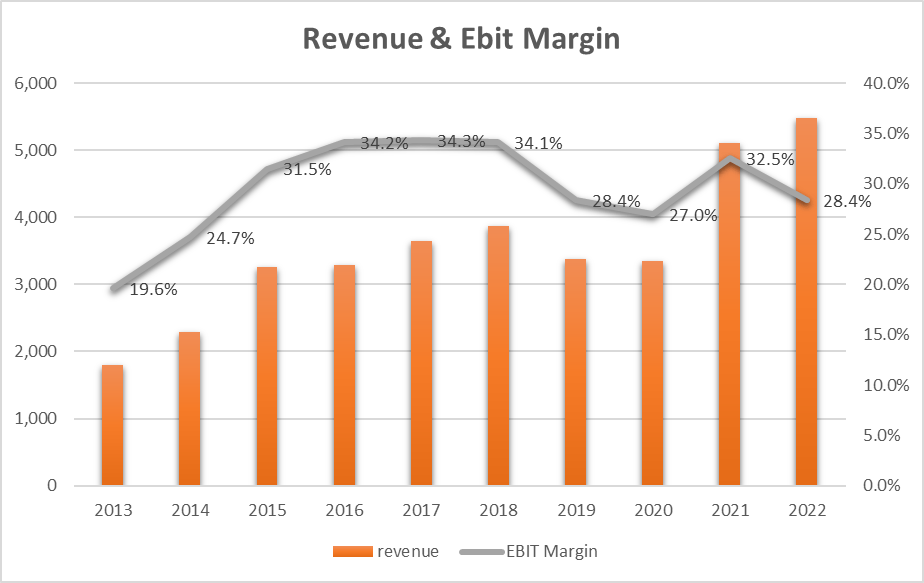
The orange bars show the revenue trend with a growth of 13.2% (CAGR) since 2013. In particular, 2022 saw a growth of 7.4% compared to 2021 with a deceleration therefore compared to previous years. However, the trend is stable and growing, fueled in 2021 by the acquisition of Silicon.
As far as the EBIT Margin is concerned, we have a growth (CAGR) of 18% while 2022 sees a decrease of almost 4 points compared to 2021.
The main reason is related to an increase in operating costs in terms of headcount as we can read from the latest Form 10-K:
The increase in research and development expenses in fiscal 2022, as compared to fiscal 2021, was primarily related to headcount-related expenses, including share-based compensation, as a result of our increased investment in developing new technologies and products. The increase in headcount was partially due to the Acquisition in the fourth quarter of fiscal 2021.
The increase in selling, general, and administrative expenses in fiscal 2022, as compared to fiscal 2021, was primarily related to increases in headcount-related expenses, partially offset by a decrease in acquisition costs each as a result of the Acquisition in the fourth quarter of fiscal 2021.
The increase in expenses, therefore, seems structural and we will have to see a more sustained increase in revenue to recover the 2021 margin figure.
However, the above seems not to be prosecutable at the beginning of 2023 when the company says (last earnings call):
Now, let’s move on to our outlook for Q1 of fiscal 2023. Given broad demand weakness, we expect revenue to decline on a sequential basis. Specifically, we anticipate revenue between $1.300 billion and $1.350 billion.
SWKS 10-K Form + Author Graph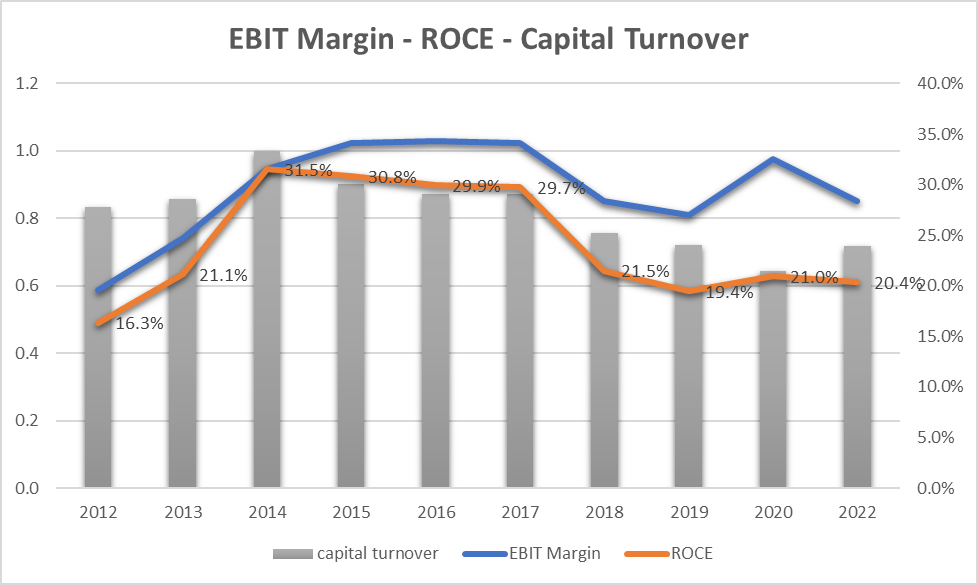
Looking at ROCE (Return on Capital Employed) – orange line – we can see how this has always been lower than EBIT (blue line) over time and that, starting from 2014, it has had a downward trend. This is mainly due to the Return on Capital (gray bars) which consistently stays below 1. In other words, every $1 employed in the company produces less than $1 in sales. This is because capital employed (in terms of assets) is growing faster than sales or the company is investing in assets more than it can recover from revenue. In any case, the 2022 ROCE, or 20.4% is a figure of absolute respect and identifies a company in great health. What I’d like to see in the coming quarters is a more marked reversal of the Capital Employed trend.
Free Cash Flow, EPS, Dividend, and CapEx
SWKS 10-K Form + Author Graph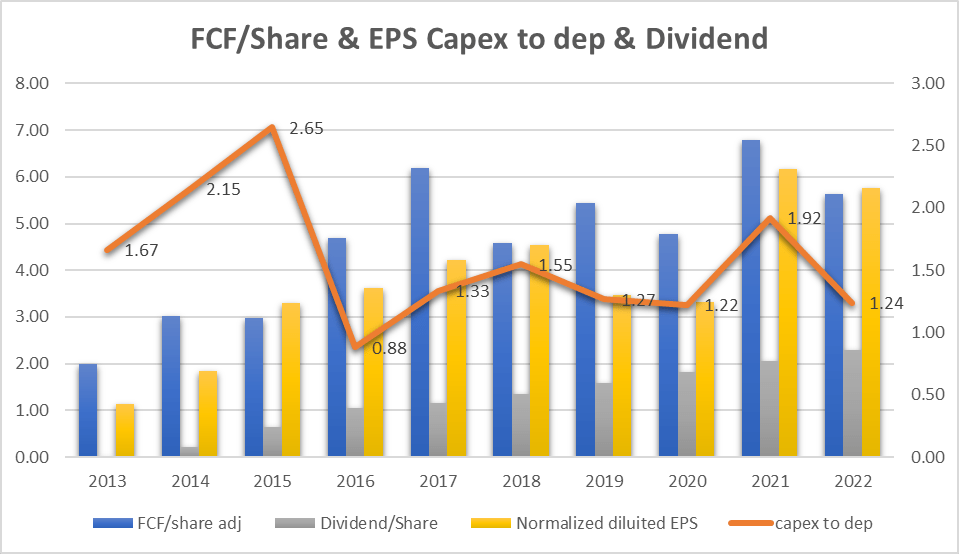
The yellow bars show the trend of the EPS registering a growth (CAGR) of 19.7% since 2013. The most interesting thing is the trend of the blue bars (Free Cash Flow/share) which closely follows that of the yellow bars. This means that the company can transform profits into free cash flow stably, constantly, and with an increasing trend.
Cash flow also contributes to a more than a sustainable distribution of dividends (grey bars) which closely follow the trend of EPS and FCF.
Finally, the orange line represents the trend of the ratio between CapEx and depreciation. Being always greater than 1 means that the company is continuously investing in development and that it is doing it rationally, especially in the last 5 years and also in 2022 as we can hear from the last earnings call:
So in fiscal 2022, we did $489 million, $490 million of CapEx, which was 9% to revenue. So we definitely will continue to invest in the business, but we also will do that in a smart way. And given some of the demand softness that we experience now, we definitely are going to manage our CapEx accordingly.
Valuation
Earnings Power Value Model
Assuming that the cash profit remains constant over the long term, I use the EPV (earnings power value) method to calculate the share price
The method starts with EBIT. The second step is to add depreciation and amortization and then subtract stay-in-business CAPEX.
The result is the Cash Trading Profit
I then subtract the taxes by calculating the amount using the actual tax rate that the company pays.
The result is the After-Tax Cash Trading Profit
At least to calculate the total company enterprise value I divide the After-Tax Cash Profit by the interest Rate I define as fine for this kind of Company (SWKS is a stable company so I decided to use 8%)
The result is the Total Company Earnings Power Value. Dividing the result by the total number of shares we find the value per single share.
The table below shows the calculation for SWKS
| EBIT | 1,557.70 |
| Dep & amort | 394.40 |
| CAPEX | -489.40 |
| Cash Trading Profit | 1,462.70 |
| TAX | 13.60% |
| TAX | -198.927 |
| After TAX cash profit | 1,263.77 |
| Interest Rate | 8% |
| EPV | 15797.16 |
| share in issue | 160.2 |
| EPV per share | 98.6 |
$98.6 represents the share price valuation using the EPV method. If we compare the data with the current market price ($94) we see that the current price could be seen as fair.
FCF/Share Model
To define a maximum buying price, I use also a formula based on FCF/Share and interest rate.
The formula is:
Maximum buying price = Cash profit per Share/interest rate – 20% (safety discount)
If TTM Cash Profit per share is $5.63
Interest Rate=inflation Rate = 7.1%
Maximum price before Safety discount = 5.63/7.1%= $79.3
The maximum price at 20% discount = $66.1
Under the FCF/Share analysis, it seems that the actual price of $93 is overrated.
Direct competitor comparison
To compare SWKS with direct competitor companies in the Semiconductors industry I have defined the following peers:
• Qorvo, Inc. (QRVO)
• QUALCOMM Incorporated (QCOM)
• Broadcom Inc. (AVGO)
• Texas Instruments Incorporated (TXN)
• Analog Devices, Inc. (ADI)
Using Seeking Alpha’s Quant Ratings we have a ‘Hold’ verdict for all the companies.
Seeking Alpha
Therefore, according to this metric, we cannot identify a company that performs better than the others.
Going a little bit deeper:
Seeking Alpha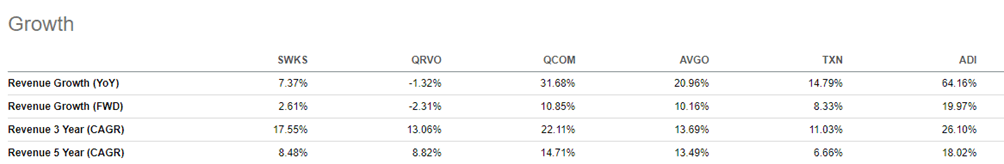
in terms of revenue growth in the last year if we exclude QRVO (which is the smallest of the companies and which has a negative figure) we can see how SWKS with a 7.37% is by far the company with the slowest growth. All competitors grew by double digits.
Seeking Alpha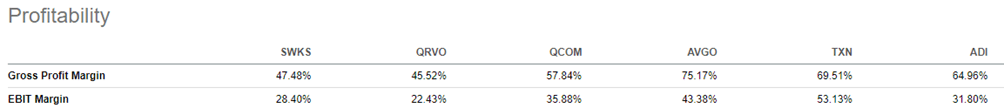
Always excluding QRVO also in terms of Gross and EBIT Margin, SWKS appears to be the company with the lowest parameters. The comparison, in a somewhat simplistic way, could indicate that in 2022 the largest companies managed to perform better both in terms of revenue growth and in terms of margins.
Risks
Inventory trend
SWKS 10-K Form + Author Graph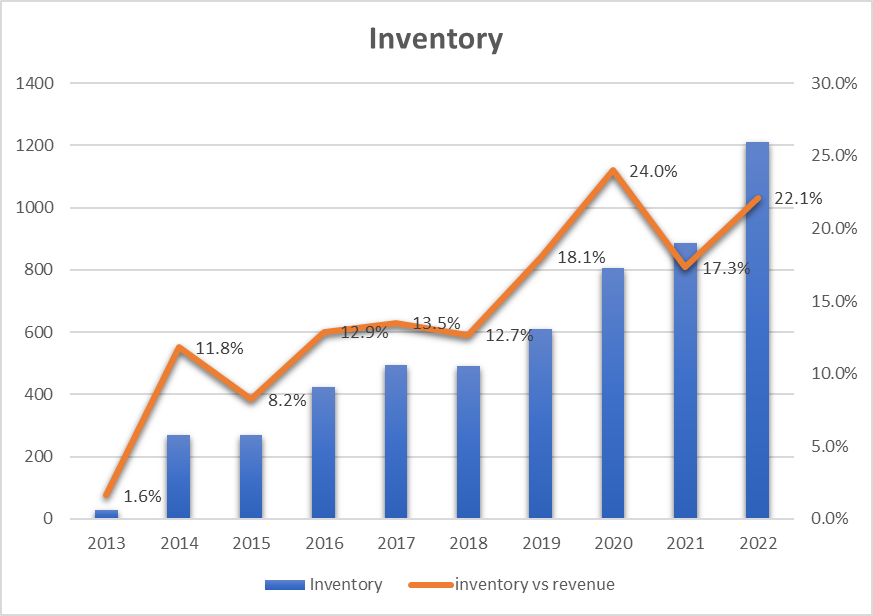
Inventory data is growing rapidly and if we could have accepted a completely altered inventory for 2020 (due to COVID), what seems a bit worrying is the 2022 level (22.1% of Revenue) and the trend that continues to rise. A rapidly growing inventory can represent a risk both of a financial nature and therefore of profitability but also an increase in complexity in the physical management of goods with a consequent increase in expenses.
Management seems aware of the inventory trend as we can hear from the last earnings call:
I think, the supply chain disruptions and the tightness in the supply chain is probably going to get a little bit easier. So that will allow us to potentially in the future, reduce some of those buffer stocks and will further help us to gradually bring down the days of inventory.
Revenue Growth
As we have seen, revenue growth was 7.4% in 2022 YoY, down compared to previous years (13.2% CAGR) and above all much lower than direct competitors who grew by double digits in the same market. Furthermore, if we listen to the latest management call, the management believes that in 2023, due to weak demand, revenue could slow down further. This represents an element of risk in terms of growth and profitability in the long run.
Conclusion
Skyworks Solutions has recorded important and constant growth in terms of revenue in the last 10 years. What has grown the most is the EBIT Margin which stands at 28.4% in 2022. This is a very good figure which underlines the company’s ability to compete in a very difficult market such as that of semiconductors. The Return on Capital Employed is also very high at 20.4% and is however lower than the EBIT. A great ability to transform profits into cash flow further distinguishes the company. In terms of growth, the revenue is growing more slowly than in the past and if compared with the competitors, the growth rate is significantly lower. A fair evaluation in terms of Earnings but overvalued if we use the Cash Flow makes me lean towards an expectation rating. My rate is Hold.
Be the first to comment