


xxmmxx/iStock via Getty Images
DISCLAIMER: This note is intended for US recipients only and, in particular, is not directed at, nor intended to be relied upon by any UK recipients. Any information or analysis in this note is not an offer to sell or the solicitation of an offer to buy any securities. Nothing in this note is intended to be investment advice and nor should it be relied upon to make investment decisions. Cestrian Capital Research, Inc., its employees, agents or affiliates, including the author of this note, or related persons, may have a position in any stocks, security, or financial instrument referenced in this note. Any opinions, analyses, or probabilities expressed in this note are those of the author as of the note’s date of publication and are subject to change without notice. Companies referenced in this note or their employees or affiliates may be customers of Cestrian Capital Research, Inc. Cestrian Capital Research, Inc. values both its independence and transparency and does not believe that this presents a material potential conflict of interest or impacts the content of its research or publications.
Recession LOL
Were you to spend any time at all reading or watching the news you would conclude that the End May Very Well Be Nigh, such is the degree of doom and gloom about the place. Well, as we noted recently, nobody told Apple (NASDAQ:AAPL) stock.
Typically in a recessionary environment – US GDP has been negative for two quarters so why anyone is worried about a future recession is puzzling to us – it happened already! – the lower-risk move in growth stocks is to own enterprise-facing names rather than consumer facing. Such logic would conclude – own Microsoft (MSFT) in preference to Apple during the bad times.
Such logic would on this occasion be wrong. Apple Corporation stock has been exceptionally resilient this year (as it was in the depths of the COVID crisis) and, moreover, the stock is setting up for a strong finish to the year. Better still – if we’re wrong? Then the recent lows are close enough that a protective stop can be set that is near enough to actually protect your capital but far enough away not to be simply hunted and then left in the dust while the stock moons without you.
Our logic here is primarily technical on the stock chart, but for good measure let’s take a look at Apple fundamentals. They are, needless to say, very strong.
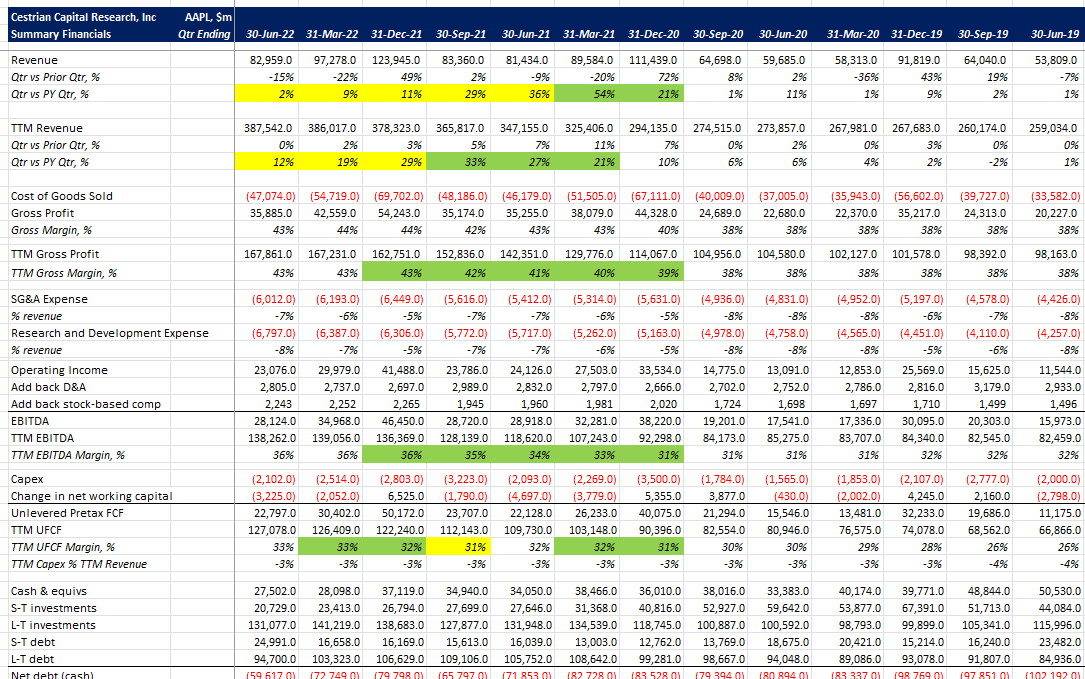
AAPL Fundamentals (YCharts.com, Cestrian Analysis)
Fundamental valuation multiples are unthreatening to buyers. 18.2x TTM unlevered pretax FCF isn’t so bad for this thing – you’ll pay a lot more than that for many ex-growth defense primes.
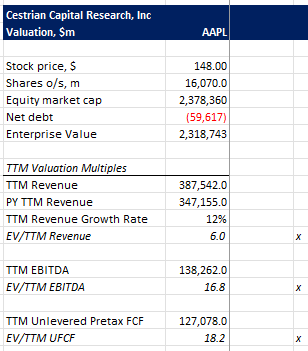
AAPL Valuation (YCharts.com, Cestrian Analysis)
But let’s turn now to the chart logic.
First, let’s look at the larger degree. (You can open a full page version of this chart by clicking HERE).

AAPL Chart I (TrendSpider, Cestrian Analysis)
From the 2018 lows – the last time the Federal Reserve tried to normalize interest rates – AAPL put in the following pattern (all prices are split-adjusted).
- Wave 1 up, from a $35 low to a $82 high right before the COVID crisis.
- Wave 2 down, bottoming at the 61.8% retracement of that Wave 1 up (that’s around $53/share). This is meaningful – the S&P500, the Nasdaq, and most tech names we cover put in a much deeper correction, a 78.6% retrace of their own Wave 1 up. So right there in 2020 the market was telling you that Apple stock was proving more resilient than others.
- Wave 3 up, peaking at the 2.618 extension of that Wave 1 up. (This sounds fancy but isn’t. It just means you take the share price movement in Wave 1, multiply it by 2.618, and add that to the share price at the bottom of Wave 2). This 2.618 extension is the same run-up that the Nasdaq-100 (QQQ) achieved, but with a lower downside as we note above. So far then, Apple has the same upside but less downside than the QQQ ETF.
- Wave 4 down from the all time high of around $183 down to (so far) a low of around $129 struck in June this year. That’s the 38.2% retracement of the Wave 3 up.
Let’s pause there for a moment. What AAPL stock has delivered since late 2018 is quite remarkable. It has provided:
- The same degree of upside as the QQQ ETF, and;
- More upside than the SPY ETF, and;
- Less downside both in the COVID crisis of Q1 2020 and the rates repricing of 2022 than either of those ETFs or indeed underlying indices.
Same or better upside, less downside than the indices. Nice.
Measuring from 24 December 2018 – which for most names was the 2018 Taper Tantrum low – AAPL has comprehensively outpaced the indices and the other big tech names, as the chart below shows.

AAPL Chart II (YCharts.com)
Not bad for a company that sells a slightly improved phone every year plus a slightly more modern version of the early photo sharing apps that were new and cool in maybe 2002.
So where next?
We think the stock chart tells a bullish story.
The first thing to note is that the stock has yet to move below the June lows. That alone is unusually bullish. Amongst the big tech single stock names, only Amazon (AMZN) shares this prize. Here’s those names plus the S&P and Nasdaq ETFs since June 15 this year.
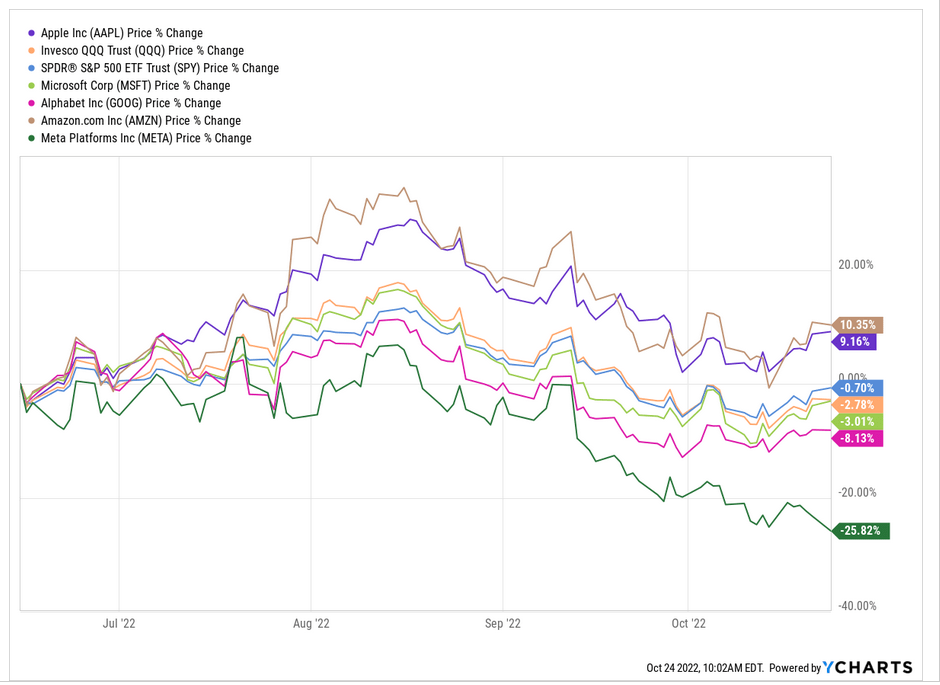
AAPL Chart III (YCharts.com)
The second thing to note is that if you look at daily closing prices on the AAPL chart below, the September and October lows hug the 78.6% retrace of the June to August move up pretty well. That’s suggestive of a smaller-degree Wave ii down as we illustrate here. (Full page version of this chart, here).
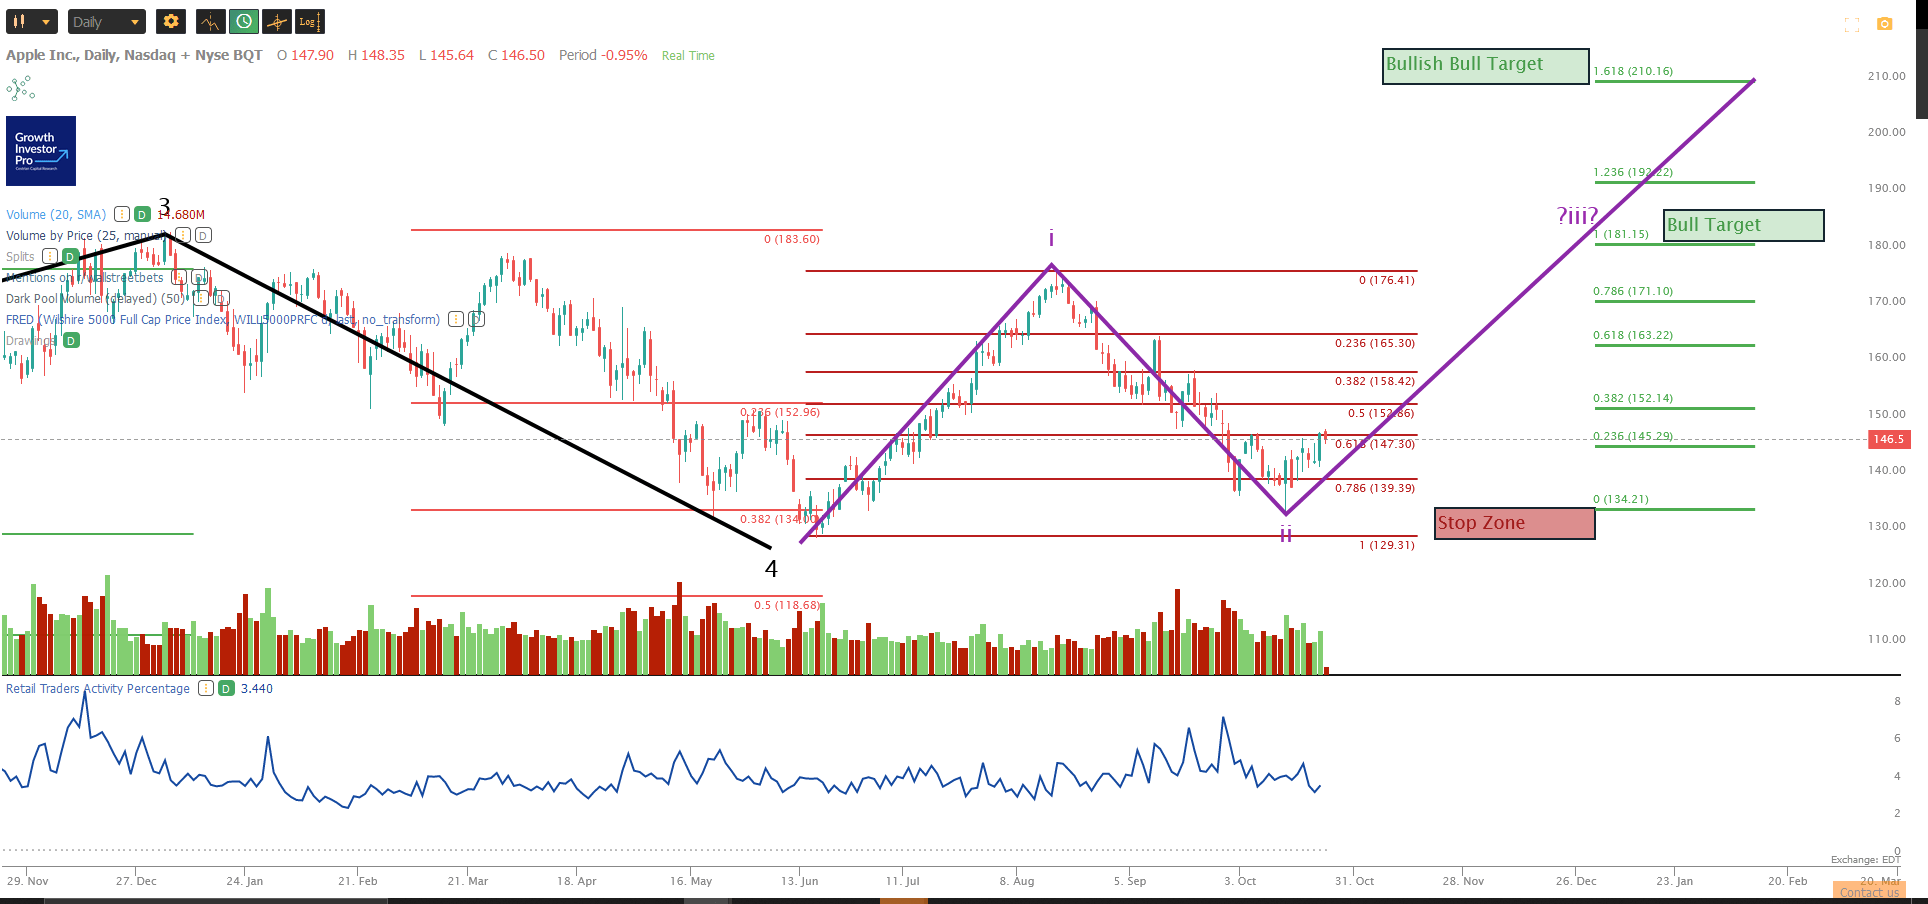
AAPL Chart IV (TrendSpider, Cestrian Analysis)
This pattern offers a very nice setup for the rest of the year, as follows.
Short-term bull target (meaning within say 3-6 months), min. $182 – that’s the 100% extension of the post-June Wave i up and, not coincidentally, equal to the all time high. That’s about 24-25% up from the price at the time of writing.
Feeling lucky, punk? A more bullish target at $210, which is the 1.618 extension of that Wave i – a 44% move up from here. (You would probably want to use a trailing stop if you were pursuing this lofty ambition).
Stop loss – you could place a stop somewhere between the October low of $134 (that’s quite a tight stop that could get hunted) and the June low of $129 (if the stock gets there, something has gone awry and you probably won’t mind too much if the stop gets hit). Let’s say you choose the wider stop, that’s an $18 drop from here.
Risk/reward looks good on that basis. Bull target and a wide stop gives you 25% up and 12% down, so let’s call that 2:1 risk/reward from here; the more ambitious target with the same wide stop gives you 44% up and 12% down so let’s call that 3.5:1 risk/reward from here.
We like those odds and we don’t think the stop placement is too brutal if it gets hit, so, on that basis we continue to rate AAPL at Accumulate.
We’ll get right back to you after earnings!
Cestrian Capital Research, Inc – 24 October 2022.
Be the first to comment