

da-kuk
Author’s note: This article was released to CEF/ETF Income Laboratory members on October 18th, 2022. Please check the latest data before investing.
The Weekly Closed-End Fund Roundup will be put out at the start of each week to summarize recent price movements in closed-end fund (CEF) sectors in the last week, as well as to highlight recently concluded or upcoming corporate actions on CEFs, such as tender offers. Data is taken from the close of Friday, October 14th, 2022.
Weekly performance roundup
0 out of 23 sectors were positive on price (down from 21 last week) and the average price return was -2.98% (down from +1.65% last week). The lead gainer was Covered Call (-0.38%) while Commodities lagged (-5.89%).
Income Lab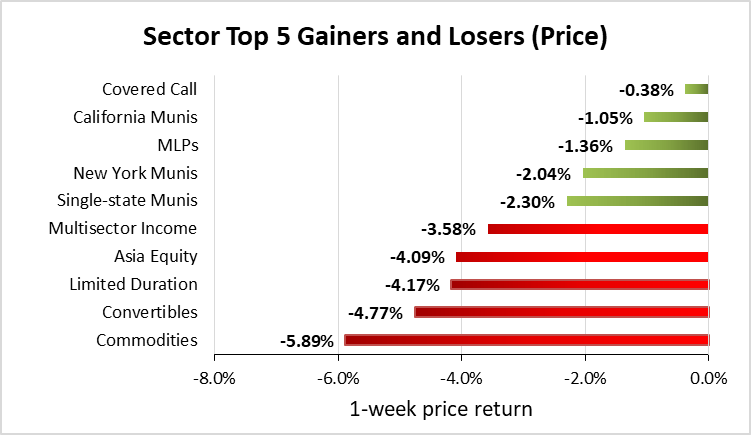
0 out of 23 sectors were positive on NAV (down from 19 last week), while the average NAV return was -2.07% (down from +1.09% last week). The top sector by NAV was MLPs (+0.08%) while the weakest sector by NAV was Commodities (-5.19%).
Income Lab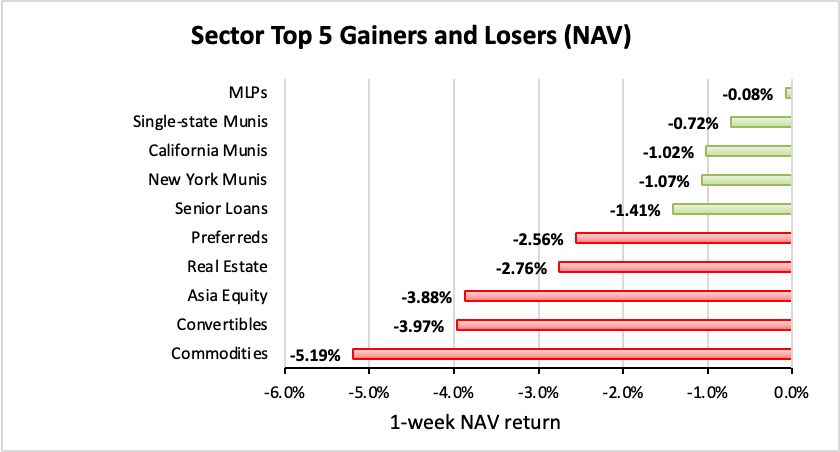
The sector with the highest premium was Covered Call (-1.06%), while the sector with the widest discount is Asia Equity (-14.82%). The average sector discount is -7.52% (down from -6.71% last week).
Income Lab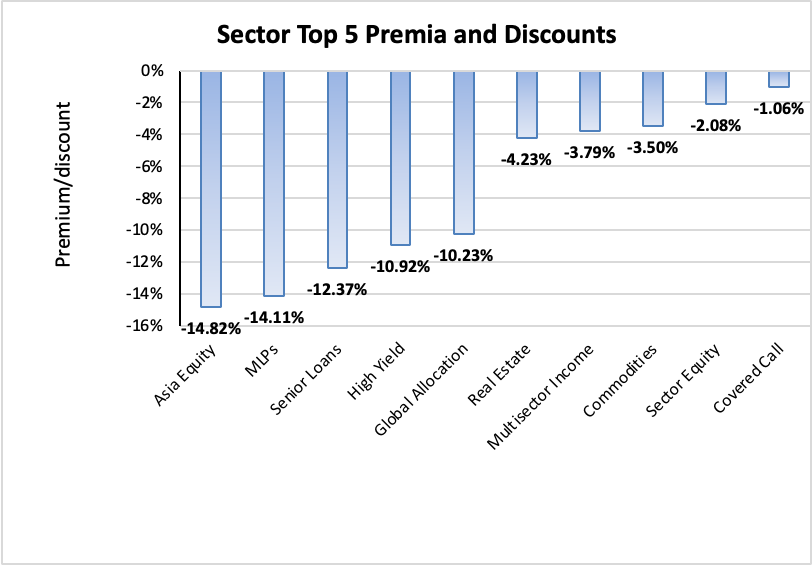
The sector with the highest premium/discount increase was Covered Call (+1.22%), while Limited Duration (-2.06%) showed the lowest premium/discount decline. The average change in premium/discount was +0.75% (down from +0.75% last week).
Income Lab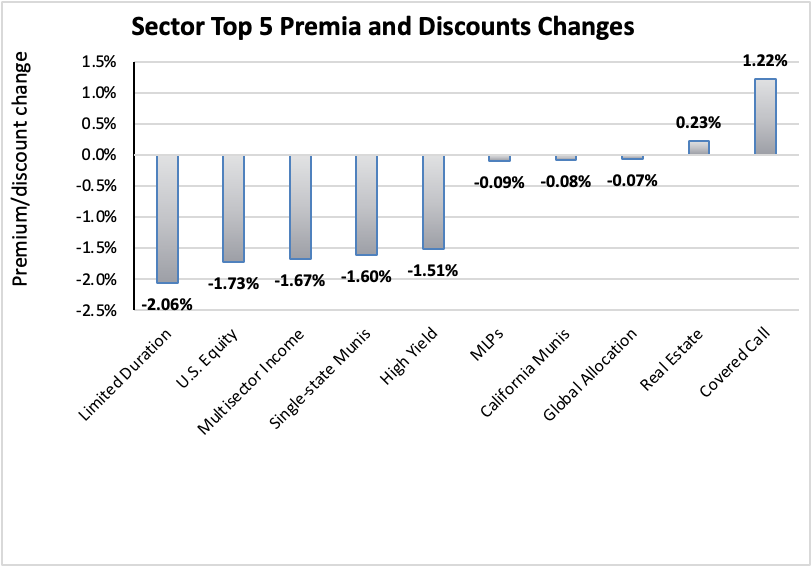
The sector with the highest average 1-year z-score is MLPs (+0.65), while the sector with the lowest average 1-year z-score is Senior Loans (-1.67). The average z-score is -0.94 (down from -0.73 last week).
Income Lab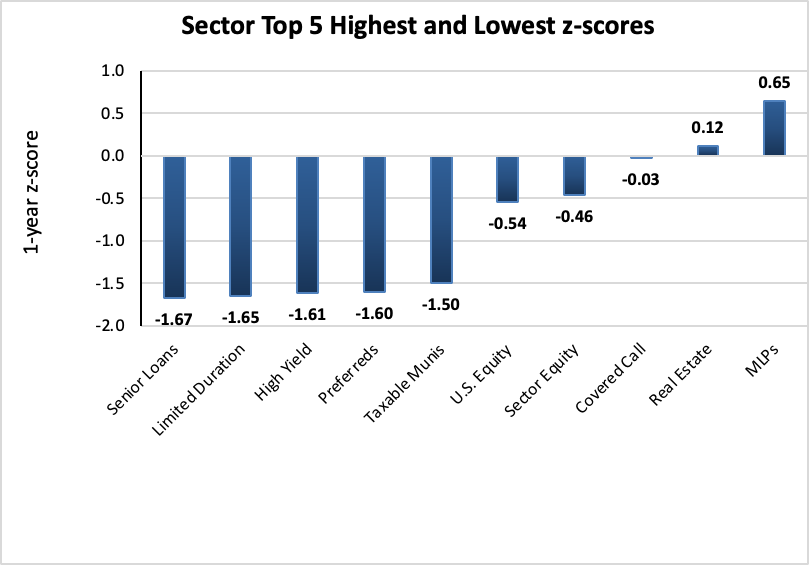
The sectors with the highest yields are Asia Equity (16.33%), Global Equity (13.71%), and Global Allocation (12.87%). Discounts are included for comparison. The average sector yield is 9.14% (down from 9.52% last week).
Income Lab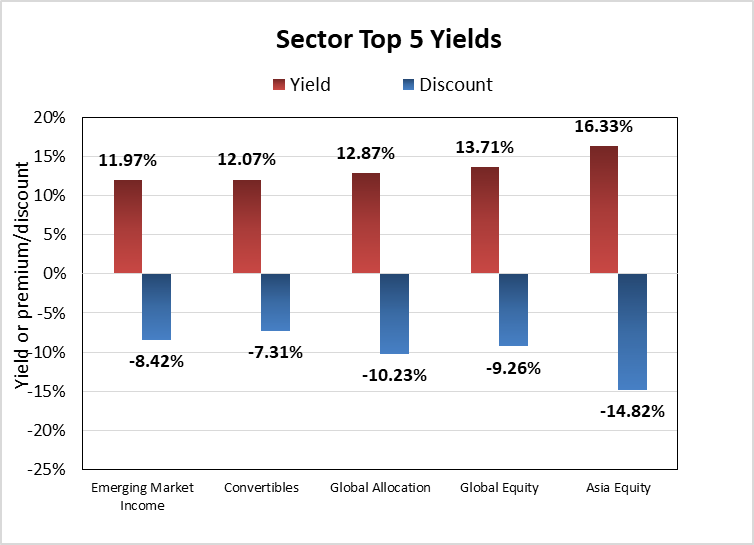
Individual CEFs that have undergone a significant decrease in premium/discount value over the past week, coupled optionally with an increasing NAV trend, a negative z-score, and/or are trading at a discount, are potential buy candidates.
| Fund | Ticker | P/D decrease | Yield | P/D | z-score | Price change | NAV change |
| Nuveen AZ Quality Muni Inc | (NAZ) | -8.44% | 3.95% | 2.84% | 0.2 | -8.28% | -0.75% |
| Nuveen Core Equity Alpha | (JCE) | -8.11% | 21.70% | 17.34% | 3.9 | -12.02% | 0.80% |
| Gabelli Equity | (GAB) | -7.52% | 12.07% | 9.47% | -1.3 | -7.45% | -1.09% |
| Virtus Stone Harbor Emerging Markets Inc | (EDF) | -7.40% | 20.51% | -2.50% | -2.1 | -8.83% | -1.91% |
| Cornerstone Strategic Value | (CLM) | -7.26% | 27.39% | 21.66% | -1.1 | -9.79% | -4.41% |
| High Income Securities | (PCF) | -6.27% | 13.83% | -11.40% | -2.2 | -7.65% | -1.11% |
| Virtus Stone Harbor Emg Mkts Total Inc | (EDI) | -6.27% | 20.74% | -5.81% | -1.9 | -7.95% | -1.83% |
| Cornerstone Total Return Fund | (CRF) | -6.05% | 27.31% | 22.51% | -1.1 | -8.96% | -4.45% |
| RiverNorth Opportunities Fund | (RIV) | -6.05% | 17.00% | -1.56% | -1.7 | -7.69% | -2.01% |
| JHancock Financial Opportunities | (BTO) | -5.87% | 8.41% | -5.96% | -3.1 | -3.16% | 2.91% |
Income Lab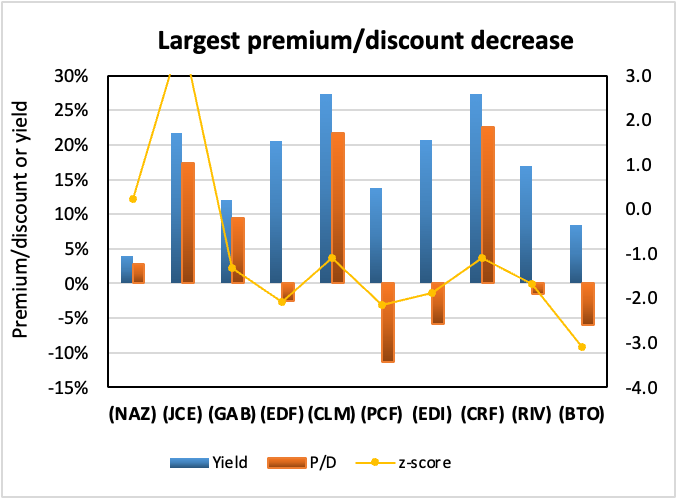
Conversely, individual CEFs that have undergone a significant increase in premium/discount value in the past week, coupled optionally with a decreasing NAV trend, a positive z-score, and/or are trading at a premium, are potential sell candidates.
| Fund | Ticker | P/D increase | Yield | P/D | z-score | Price change | NAV change |
| Eagle Point Income Co Inc | (EIC) | 10.97% | 11.05% | 19.18% | 2.1 | -1.65% | -9.64% |
| Delaware Inv National Muni Income | (VFL) | 5.76% | 4.85% | -1.42% | 2.1 | 4.90% | -1.22% |
| Madison Covered Call & Eq Strat | (MCN) | 5.60% | 10.27% | 8.01% | 1.1 | 3.39% | -1.96% |
| Tortoise Energy Independence Fund, Inc. | (NDP) | 4.71% | 6.81% | -8.51% | 2.5 | 2.37% | -2.86% |
| Gabelli Conv Inc Secs | (GCV) | 4.60% | 9.16% | 28.12% | 2.0 | -0.19% | -3.76% |
| Eaton Vance Tx-Mgd Glbl Buy-Write Opp | (ETW) | 4.57% | 10.81% | 2.80% | 0.9 | 3.20% | -1.38% |
| Columbia Seligman Premium Technology Gr | (STK) | 4.36% | 7.99% | 5.46% | 0.5 | -1.61% | -2.36% |
| Nuveen Municipal Credit Opps Fund | (NMCO) | 4.31% | 6.26% | -3.25% | -0.4 | 2.32% | -2.23% |
| Nuveen MO Quality Muni Inc | (NOM) | 3.70% | 3.23% | 8.58% | 0.9 | 2.76% | -0.72% |
| Eaton Vance Tax-Adv Global Dividend Inc | (ETG) | 3.55% | 10.42% | 0.34% | 0.9 | 1.15% | -2.42% |
Income Lab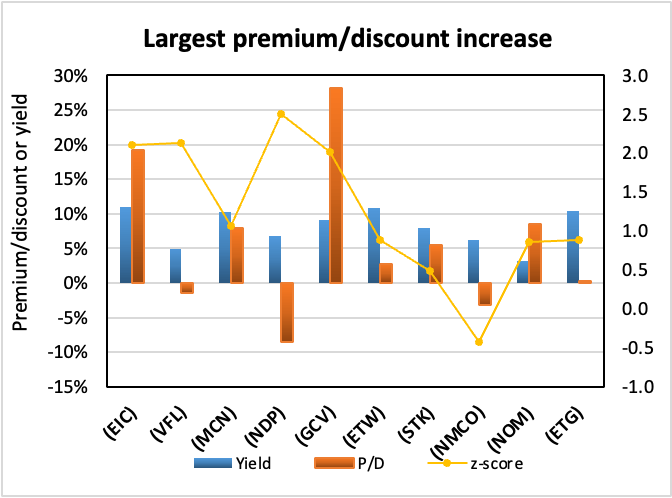
Recent corporate actions
These are from the past month. Any new news in the past week has a bolded date:
October 14, 2022 | BlackRock Corporate High Yield Fund, Inc. (HYT) Announces Results of Its Rights Offering.
September 27, 2022 | RiverNorth/DoubleLine Strategic Opportunity Fund, Inc. Announces Final Results of Rights Offering
September 26, 2022 | RiverNorth/DoubleLine Strategic Opportunity Fund, Inc. Announces Preliminary Results of Rights Offering.
September 19, 2022 | Virtus Total Return Fund Inc. Completes Rights Offering.
Upcoming corporate actions
These are from the past month. Any new news in the past week has a bolded date:
October 4, 2022 | RiverNorth Opportunities Fund, Inc. Announces Transferable Rights Offering.
October 3, 2022 | Tortoise Announces Tender Offers for its Closed-End Funds.
September 20, 2022 | First Trust/abrdn Emerging Opportunity Fund Announces Approval of Liquidation.
August 11, 2022 | Abrdn’s U.S. Closed-End Funds Announce Special Shareholder Meetings Relating to Proposed Acquisition of Assets of Four Delaware Management Company-Advised Closed-End Funds.
Recent activist or other CEF news
These are from the past month. Any new news in the past week has a bolded date:
October 5, 2022 | BlackRock Closed-End Fund Share Repurchase Program Update.
October 3, 2022 | Virtus Convertible & Income Fund, Virtus Convertible & Income Fund II Commence Tender Offers for Outstanding Auction Rate Preferred Shares.
October 3, 2022 | Virtus Convertible & Income Fund II Postpones Monthly Distribution on Common Shares.
————————————
Distribution changes announced this month
These are sorted in ascending order of distribution change percentage. Funds with distribution changes announced this month are included. Any distribution declarations made this week are in bold. I’ve also added monthly/quarterly information as well as yield, coverage (after the boost/cut), discount and 1-year z-score information. I’ve separated the funds into two sub-categories, cutters and boosters.
Cutters
Income Lab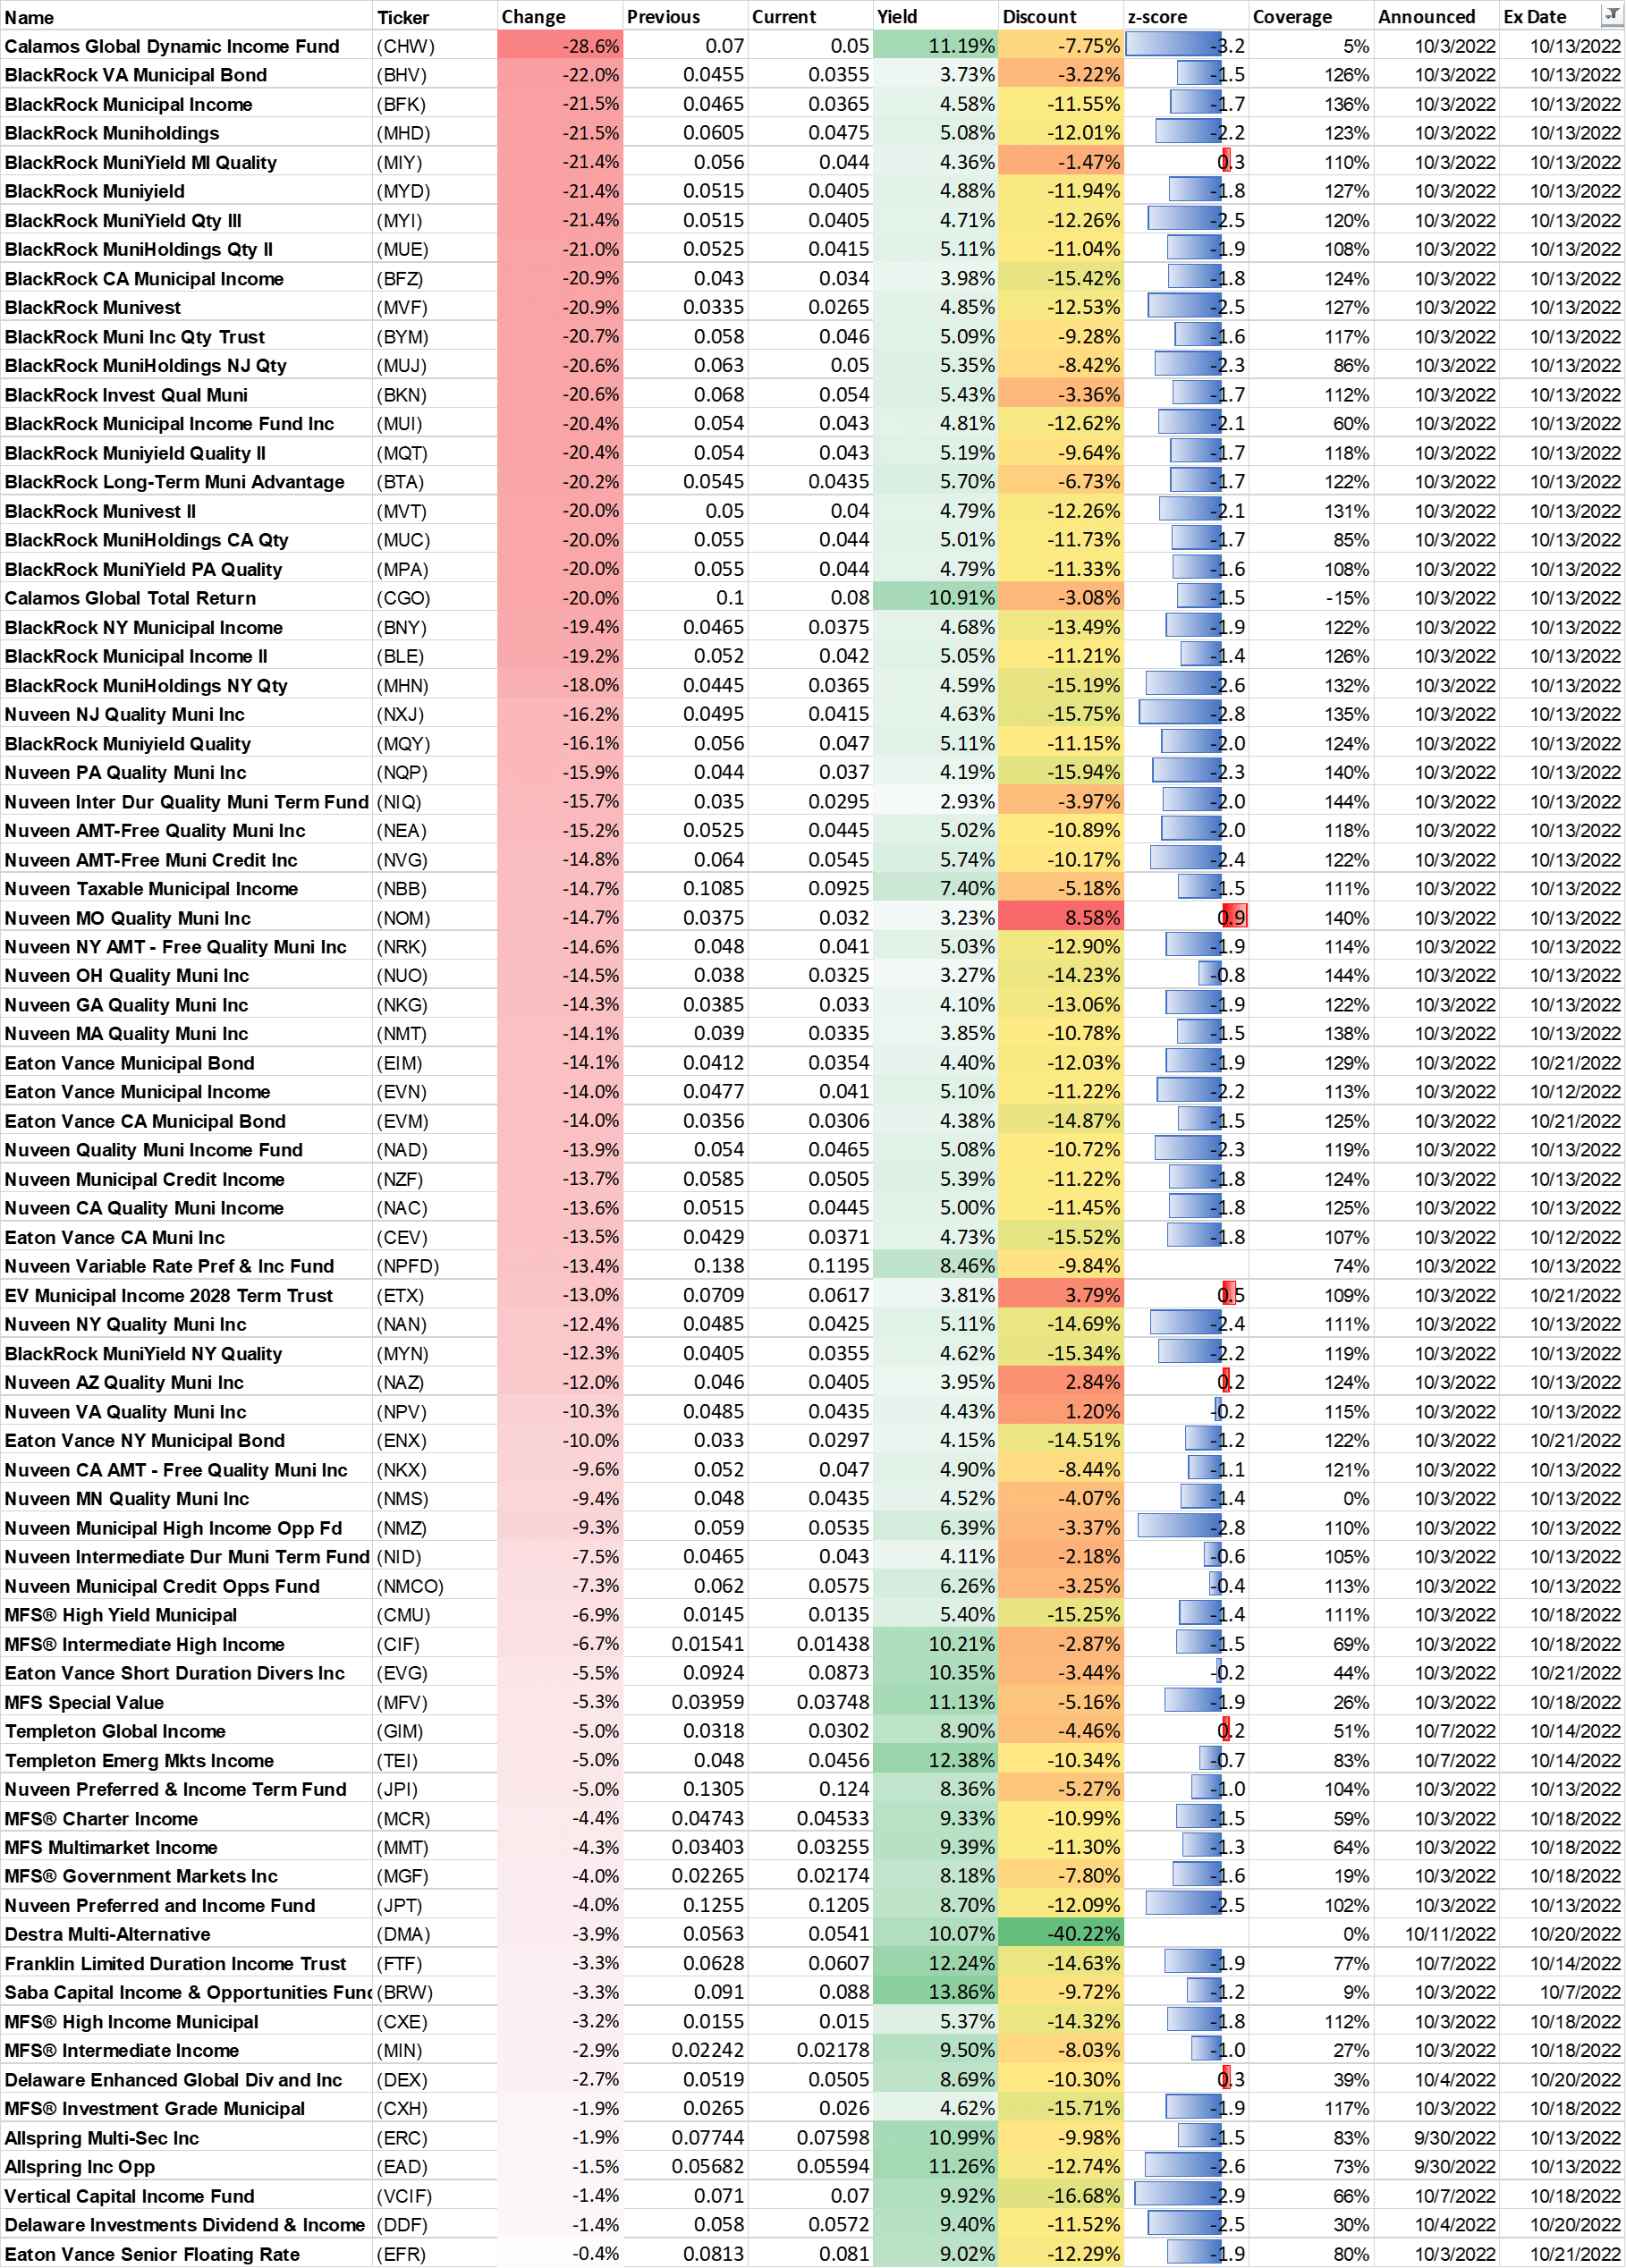
Boosters
Income Lab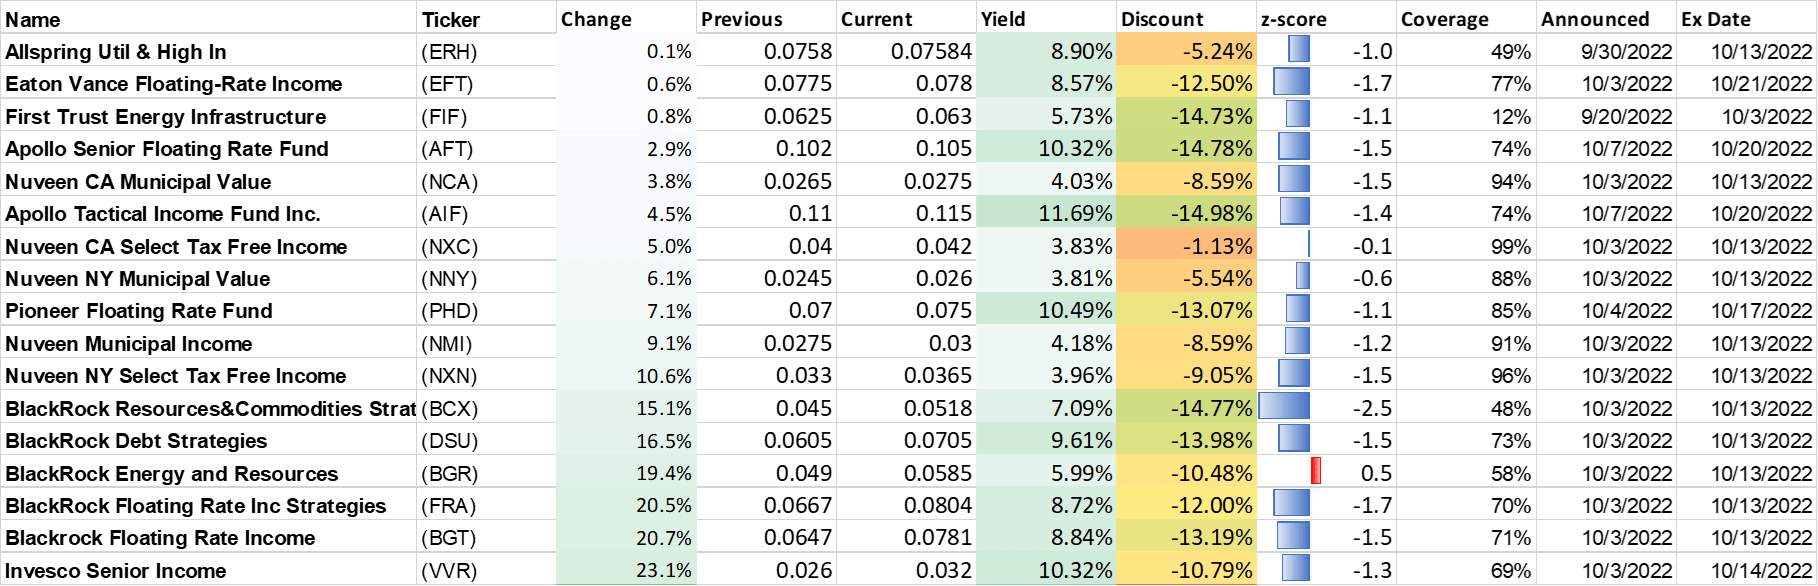
Commentary
1. HYT rights offering results
Will be discussed in a separate public post.
2. BlackRock CEFs repurchasing shares
In other news, BlackRock CEFs have provided their quarterly update on their share repurchase programs. It looks as though a significant number of shares have been repurchased by their funds this quarter, including many of their more deeply discounted funds.
BlackRock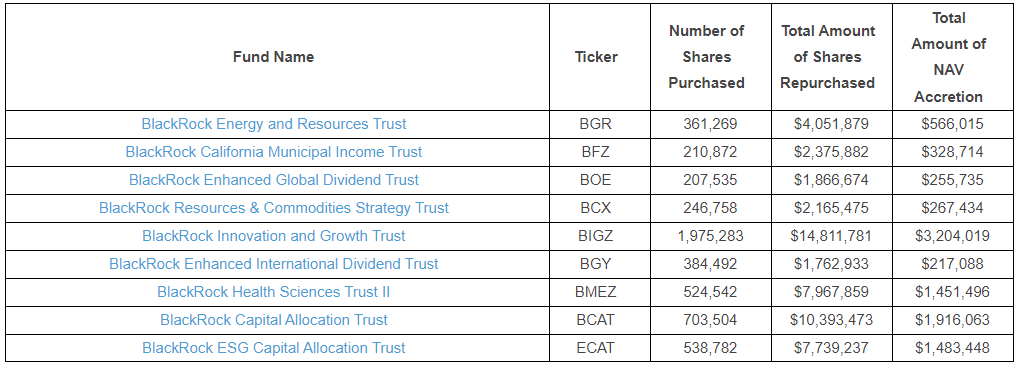
As a reminder, rebuying shares at a discount is accretive to NAV/share and improves performance for all shareholders. However, CEF managers generally do not voluntarily repurchase shares because this reduces AUM and hence fee income. Thus, the fact that BlackRock is proactively rebuying its own shares is a sign of management alignment with shareholders.
Taking BIGZ for example, BlackRock repurchased nearly 2 million shares or $14.8 million worth of shares. This was nearly 1% of outstanding shares and resulted in $3.2 million of NAV accretion, which provides around a +0.16% boost to the NAV.
Of the above list, BOE and BMEZ are portfolio positions.
Strategy Statement
Our goal at the CEF/ETF Income Laboratory is to provide consistent income with enhanced total returns. We achieve this by:
- (1) Identifying the most profitable CEF and ETF opportunities.
- (2) Avoiding mismanaged or overpriced funds that can sink your portfolio.
- (3) Employing our unique CEF rotation strategy to “double compound“ your income.
It’s the combination of these factors that has allowed our Income Generator portfolio to massively outperform our fund-of-CEFs benchmark ETF (YYY) whilst providing growing income, too (approx. 10% CAGR).
Income Lab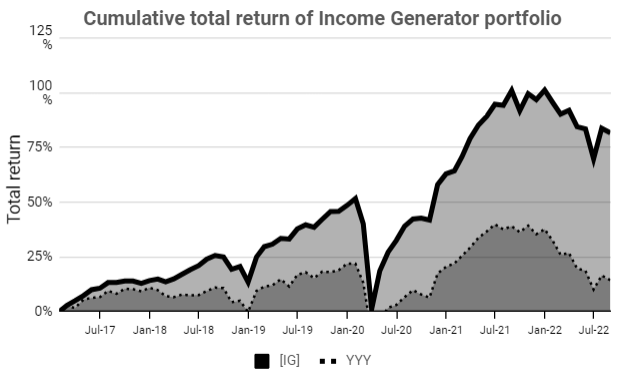
Remember, it’s really easy to put together a high-yielding CEF portfolio, but to do so profitably is another matter!
Be the first to comment