

imaginima
Introduction and Overview
ROK Resources (OTCPK:PTRDF) is a liquids-weighted junior Canadian E&P focused on growth, with operations concentrated in Frobisher (SW Saskatchewan) and Kaybob (Alberta). While much of our focus is often within Alberta, we would be remiss if we didn’t highlight what may potentially be one of the most attractive growth plays, in the province next door. In the assessment below, we will share our perspectives on ROK’s operations in Alberta and Saskatchewan, and highlight the meaningful upside that has yet to be priced into the company’s stock price.
Operational Assessment
ROK Resources’ gross production is roughly 3,000 boe/d, with a third of its production concentrated in the Kaybob region (~1,000 boe/d), half its production from Southeast Saskatchewan (~1,500 boe/d), and the balance of its production from Southwest Saskatchewan (~500 boe/d). Given its smaller scale, ROK will be compared to other peers with production below 5,000 boe/d in each respective region.
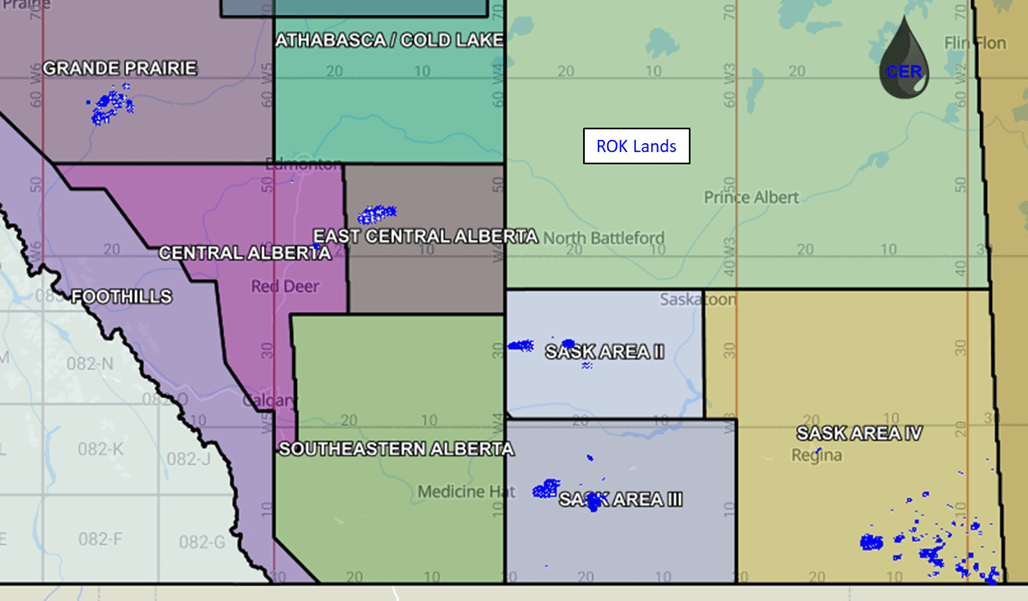
The below table summarizes ROK’s production across all assessed regions in the Western Canadian Sedimentary Basin. The map below illustrates ROK’s acreage position across the WCSB.
Figure 1: Summary of Land Position and Production by Region (Source: XI Technologies, geoSCOUT, generated and formatted by CER) Figure 2: Summary of Land Position and Production by Region (Source: XI Technologies, geoSCOUT, generated and formatted by CER)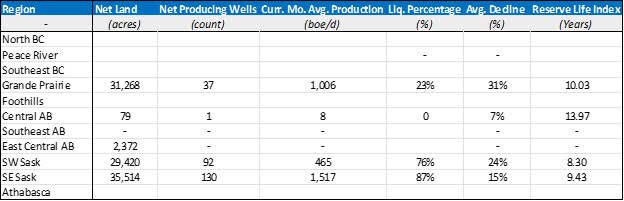
Acreage and Production
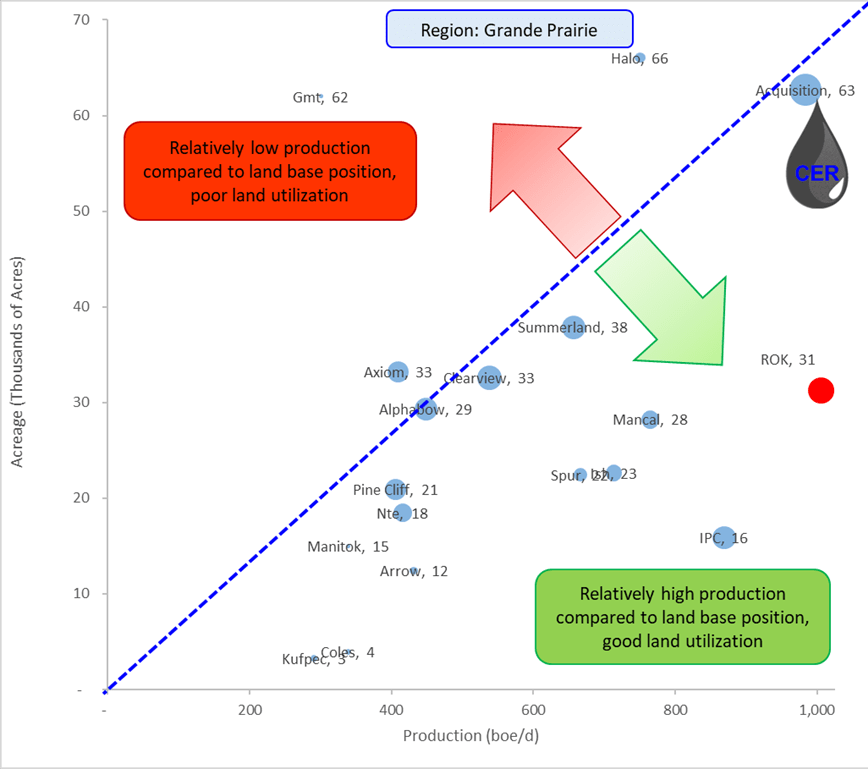
Both in Saskatchewan (where ROK maintains a majority of its production) and in the Grande Prairie (where ROK is reactivating several Kaybob wells), the company demonstrates excellent land utilization. As indicated by the plots below, ROK maintains high production relative to its acreage position indicative of highly effective geological mapping, successful drilling and downhole stimulation activities. Furthermore, ROK also maintains a relatively modest number of wells (indicated by the bubble size in the plots below), relative to peers in the area, indicating its production per well is competitive relative to peers in the area. In addition to its core acreage in Saskatchewan and in Kaybob, the company also holds 2.1% working interest in the Weyburn-Midale CCUS project, which in addition to supporting the company’s ESG objectives may also provide exposure to future carbon credit revenues.
Figure 3: Net Acreage (Y-Axis), Production (X-Axis) and Net Well Count (bubble size) by Operator (Source: XI Technologies, geoSCOUT, generated and formatted by CER) Figure 4: Net Acreage (Y-Axis), Production (X-Axis) and Net Well Count (bubble size) by Operator (Source: XI Technologies, geoSCOUT, generated and formatted by CER)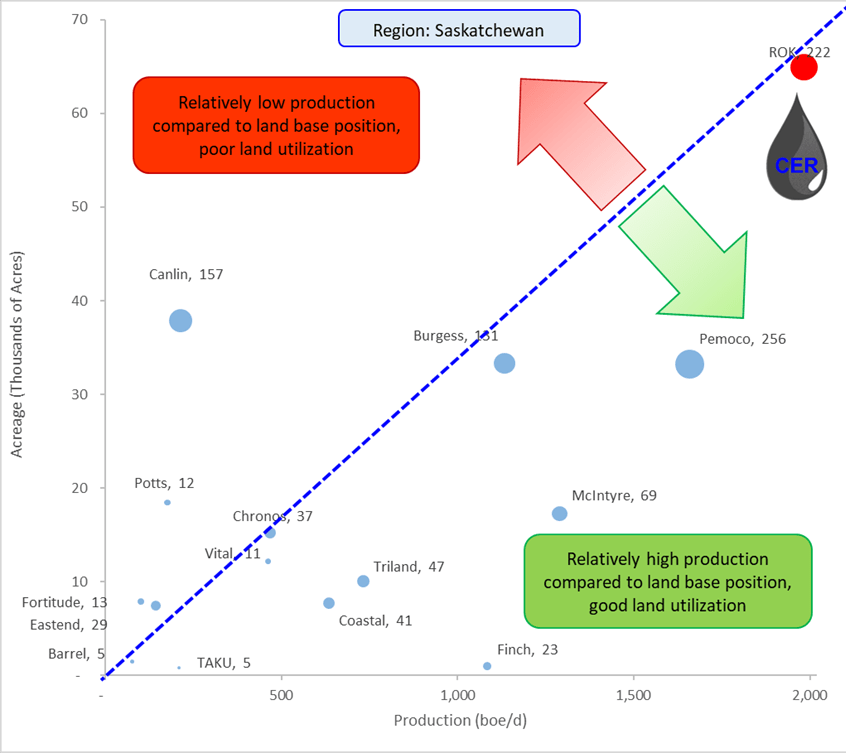
Production Decline and Drilling Activity
ROK is targeting a 2022 exit production of 3,500 boe/d (71% liquids), or a 22x increase from 2021 volumes (158 boe/d average). The company disclosed a 2022 capital program of C$20 million, the majority of which will be deployed in Saskatchewan as the company has 12 Frobisher horizontal wells for 2022. Moreover, the company holds over 20 booked locations in Southeast Saskatchewan (in the Frobisher area) with wells paying out in just five months at $80WTI. These are some of the most attractive well economics in North America, closely rivaling some of the Clearwater well economics.
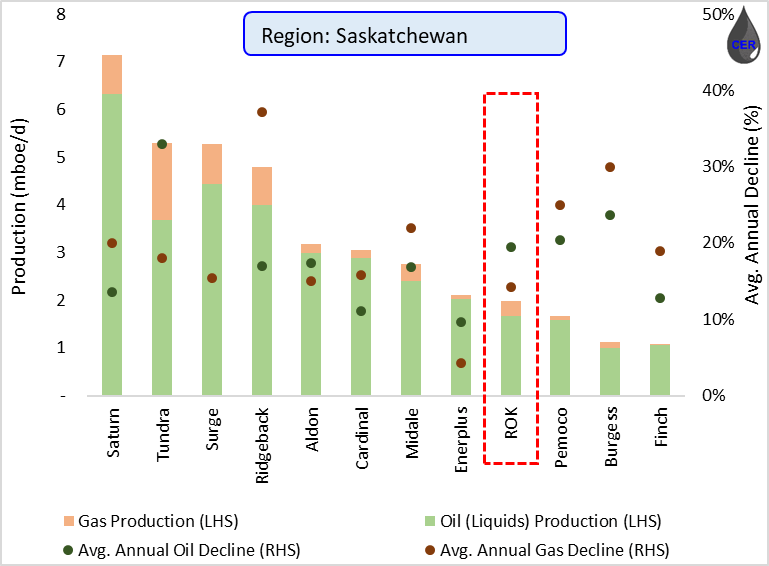
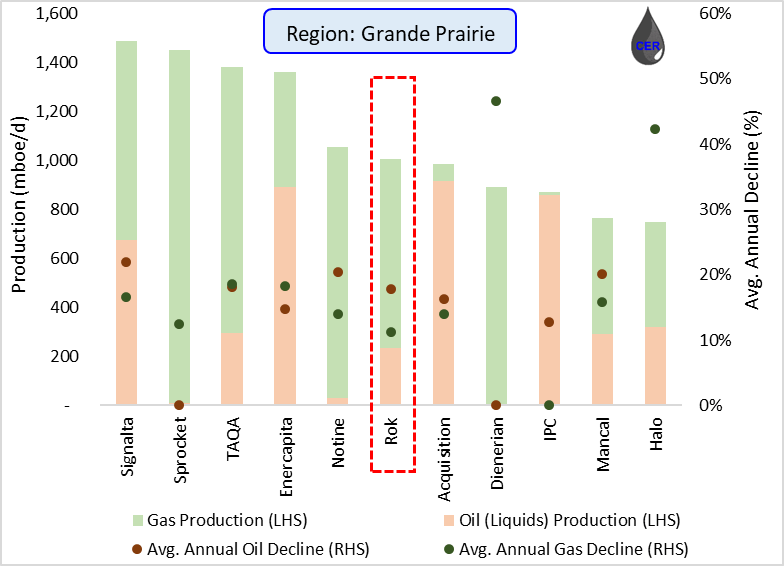
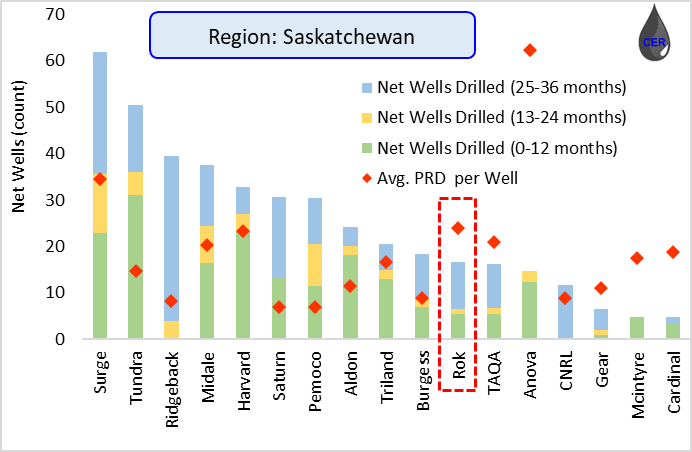
In terms of its current production, the company has maintained moderate to shallow declines across both of its core regions (Kaybob and Saskatchewan) rivaling those of other larger capitalized peers (TAQA, Surge, Saturn, Ridgeback) in the area. Another testament to the company’s drilling history is illustrated in figure 8 below, where despite its lower drilling activity relative to peers, ROK displays some of the highest average production per well in the area.
Figure 5: Southeast Saskatchewan (Frobisher) Well Economics (Source: ROK Company Disclosures) Figure 6: Production (LHS) and Average Annual Decline (RHS) by Operator (Source: XI Technologies, geoSCOUT, generated and formatted by CER) Figure 7: Production (LHS) and Average Annual Decline (RHS) by Operator (Source: XI Technologies, geoSCOUT, generated and formatted by CER) Figure 8: Net new drills (LHS) and Avg. Production (RHS) by Operator (Source: XI Technologies, geoSCOUT, generated and formatted by CER)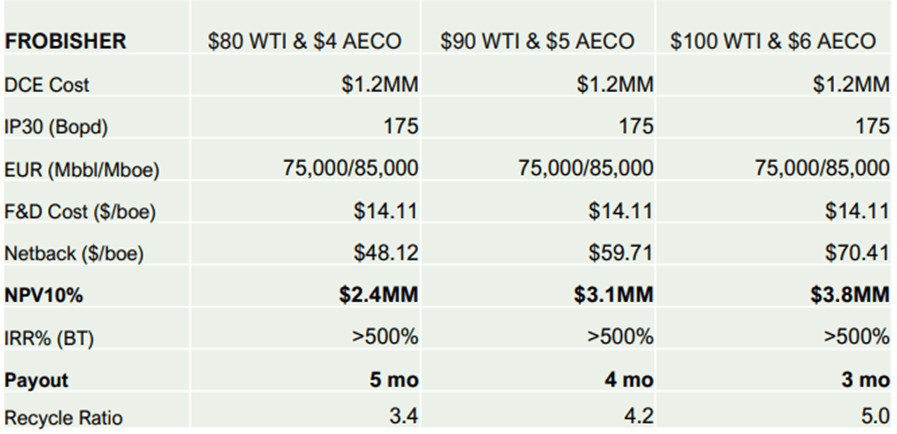
Reserves
The company holds approximately 6.9 MMboe of PDP reserves and 15.5 MMboe of 2P reserves, which equate to a Reserve Life Index of ~14 years at current production levels (3,000 boe/d in Q2). Furthermore, ROK’s PDP reserves are estimated at C$0.33/share which is roughly where the stock trades today, while their 2P BT NPV10 reserve volumes map out to C$0.90/share (or roughly a ~165% upside from current pricing). The company is forecasting over C$150 million of cumulative FCF by 2025 (at GLJ forecast pricing, as of April 1, 2022), with ~C$115 million from its current PDP reserves, translating to over a 40% FCF yield and possible privatization of the company within 3 years.
Figure 9: ROK Reserve Volumes Summary (Source: ROK Company Disclosures )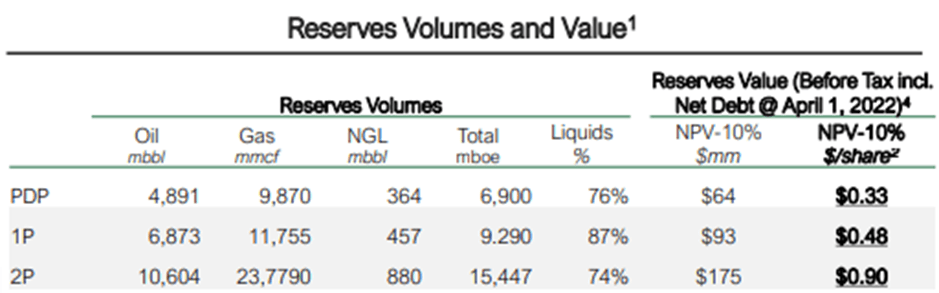
Economic Assessment
In the following five sections we consider ROK’s latest earnings and break down its intrinsic valuation; starting with a commodity pricing outlook, production forecast, calculating field and corporate netbacks, and finally by discounting free cash flow back to present value.
Earnings and Return of Capital
Q2 volumes were ~3,054 boe/d, which drove funds flow of C$17.2 MM or $0.09/share. Given its transformational acquisition of Federated Co-operatives Limited (FCL) back in Q1 for ~C$72 million, the company is now focusing on deleveraging its balance sheet. Net Debt was reduced to C$38.4 million as of June 30, 2022. Most impressively, the company realized C$18.3 million in operating income, which equates to C$65.99/boe in operating netback throughout Q2.
Pricing
ROK’s production can be separated into three main streams: light oil (~62%), NGLs (~6%), and natural gas (~32%). Back-calculating realized pricing based on the company’s sales prices, ROK has realized just shy of the Edmonton Light (from its light oil volumes), AECO (from its natural gas production) and Edmonton Condensate (for its NGL volumes) respectively. In our forecast, we have integrated these three benchmarks based on the 3 Consultant’s Average (GLJ, Sproule, McDaniel) pricing as of June 30, 2022.
Figure 10: Commodity Price Outlook (Source: McDaniel, generated and formatted by CER)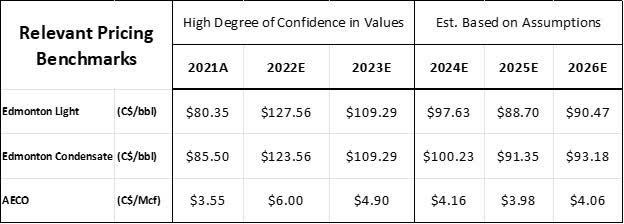
Production
As a result of the company’s acquisition of FLC earlier in the year, its production has increased dramatically year over year and management has projected volumes to reach 3,500 boe/d by 2022 exit. Given its smaller scale and growth focus, we have incorporated production growth up to 10,000 boe/d by 2026.
Figure 11: Production Outlook (Source: 2022 Management Presentation, generated and formatted by CER)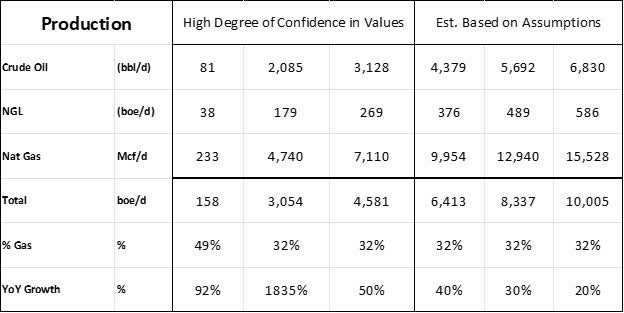
Netback
Given the current pricing environment, its smaller scale and projected Frobisher well economics, ROK is positioned to post some of the most attractive netbacks in the industry. As with any oil and gas company, a major risk is a downturn in commodity prices as we have seen over the past month. Given its current indebtedness post-acquisition, ROK has mitigated this downside risk with both fixed price WTI and Henry Hub swaps through to 2024. The company’s current hedging program represents ~75% of its current base production hedged at approximately US$93.61/bbl WTI and US$4.09/MMbtu Henry Hub over the next 24 months. This is a prime example of a company with explosive growth and upside potential while also providing incredibly competitive downside protection to its shareholders.
Figure 12: Operational Netback (All figures in CAD) (Source: 2022 Management Presentation, generated and formatted by CER)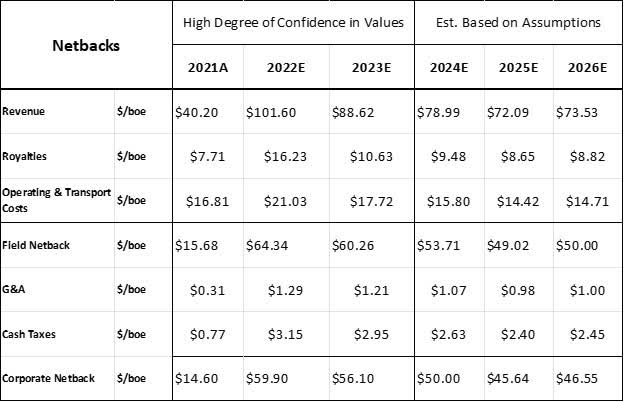
Cash Flow
Given the company’s smaller scale, high degree of indebtedness and shorter track record, we have incorporated several aggressively conservative assumptions. Firstly, we have incorporated a long-term discount rate of 25%, which is nearly twice as high as what we regularly use. Secondly, we have assumed the company’s capital program to triple by 2026 in order to support the projected production growth profile to 10,000 boe/d. Thirdly, we have also incorporated a 10% annual share dilution (denoted by an increase in outstanding share count) starting in 2022 through to 2026 as the company scales and seeks more capital. Incredibly, despite these very conservative assumptions, we continue to estimate over a 200% upside from the current pricing levels to over C$1.05/share.
Figure 13: Free Cash Flow and Present Value (All figures in CAD) (Source: 2022 Management Presentation, generated and formatted by CER)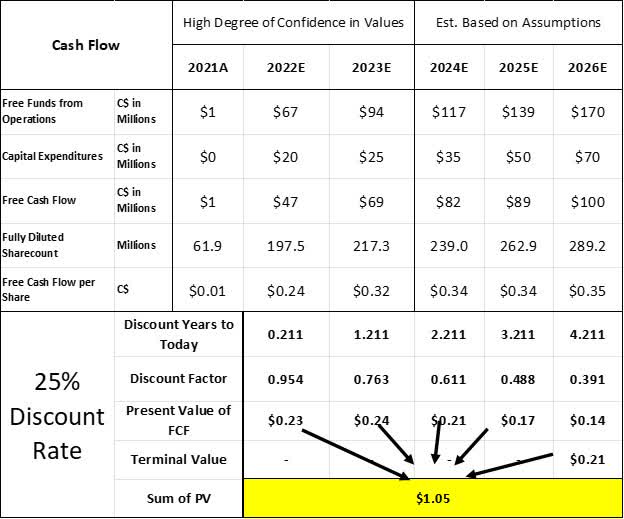
Comparables
Despite its smaller scale, relatively lower liquidity (Market cap of ~C$50 million and ~15% of shares are insider held) the company remains incredibly attractive from a trading multiple perspectives as well. As illustrated below, the company appears undervalued across several trading multiples compared to other Canadian peers of similar size.
Figure 14: Trading Multiples of Various Comparable Peers (Source: ROK Company Disclosures)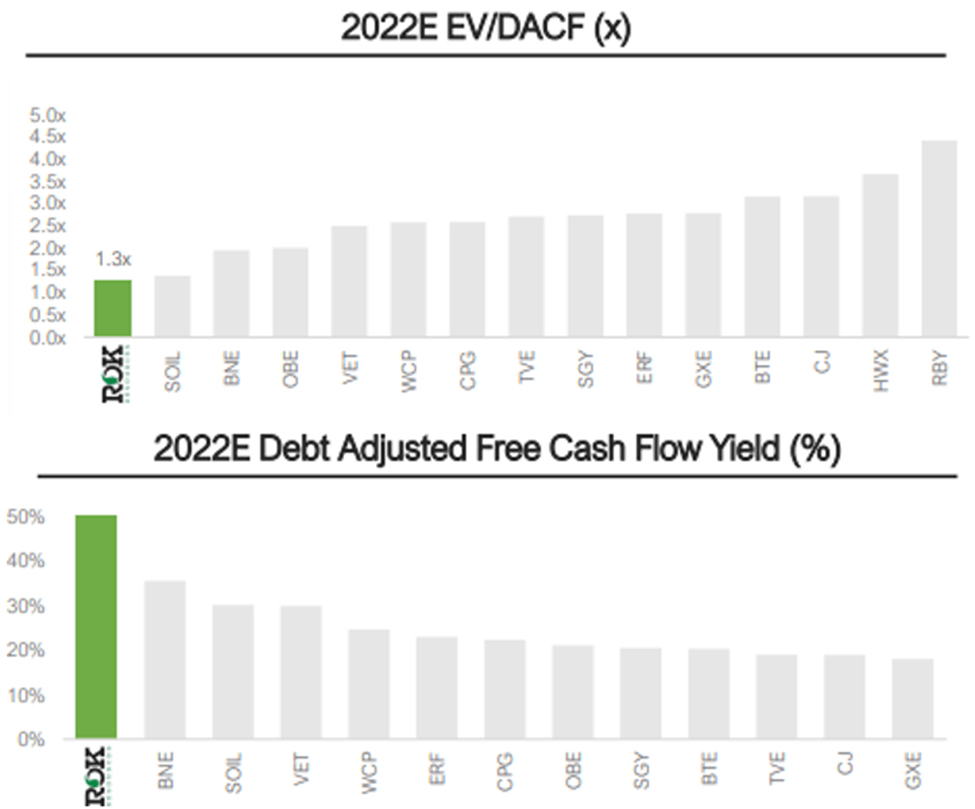
Conclusion
ROK is an incredibly versatile operator with incredible upside torque while also providing investors with meaningful downside protection (given its current hedging program securing 75% of its production at > US$90WTI and > US$4.0/MMbtu Henry Hub until 2024). Despite the smaller scale, ROK remains a competitive operator in each region where it operates, relative to other peers in the area. As far as intrinsic valuation, ROK falls between around C$1.05 per share given current commodity, production, and free cash flow outlook, implying an incredible 200% upside from the current valuation. Given the company’s growth focus strategy, we estimate FCF to be prioritized firstly towards deleveraging and production growth over the next year with a secondary focus over the next year being return of capital to shareholders, which will be meaningful given the proven operating netbacks and top tier Frobisher acreage that the company is privy to. Moreover, ROK also continues to trade at attractive multiples relative to peers, and as such warrants a buy recommendation.
Risks
The most significant risk to our price target and rating is unexpected changes in crude oil and natural gas prices. The valuation of oil and gas assets is subject to risk with respect to drilling results and reservoir performance. Other risks include the impact of foreign exchange rates and government legislation as it relates to royalties, income taxes, and environmental policy. Potential risks to our price target and rating include the following: 1) Variable drilling program results. ROK’s future growth is highly dependent on continued drilling success. If results turn out to be below expectations or operational issues exist, this could hamper the company’s growth profile significantly and have a negative effect on its stock price. 2) Fluctuation in commodity prices. ROK’s production is only partially hedged going forward, as such, the company continues to be exposed to changes in commodity pricing. 3) Given the relative size of the company, equity prices will be illiquid and subject to higher volatility.
Be the first to comment