

miniseries/E+ via Getty Images
During turbulent times, investors are bound to seek out safety. Safe havens help to protect capital while, hopefully, generating some return in the process. One asset class that is typically seen as a safe haven is the REIT. With medium to long-term contracts in most cases and stable cash flows based on the ownership of assets, these are generally great companies to buy into. But not all REITs are equal and, depending on their emphasis, some could even be considered rather risky. One category of REIT that few investors would consider to be excellent for difficult times would be those that focus on retail, particularly shopping centers. Despite this, improved year-over-year performance has helped keep shares of one shopping center REIT, SITE Centers (NYSE:SITC), elevated compared to the broader market. On top of this, shares of the enterprise are getting more appealing from a price perspective. If current trends persist, this could lead the business to being an attractive opportunity. However, for now, I would still retain my ‘hold’ rating on the firm.
Improvements beget stability
The last time I wrote an article about SITE Centers was in April of 2021. In that article, I told investors that the company had largely recovered from the pain associated with the COVID-19 pandemic. I thought that the company was demonstrating some degree of stability. However, due to how shares were priced, I ended up rating the enterprise a ‘hold’, which is my way of saying that I feel that shares will generate a return more or less matching the market for the foreseeable future. Since then, the company has outperformed my expectations. While the S&P 500 has dropped by 9.3%, shares of SITE Centers have generated a loss for investors of just 4%.
Author – SEC EDGAR Data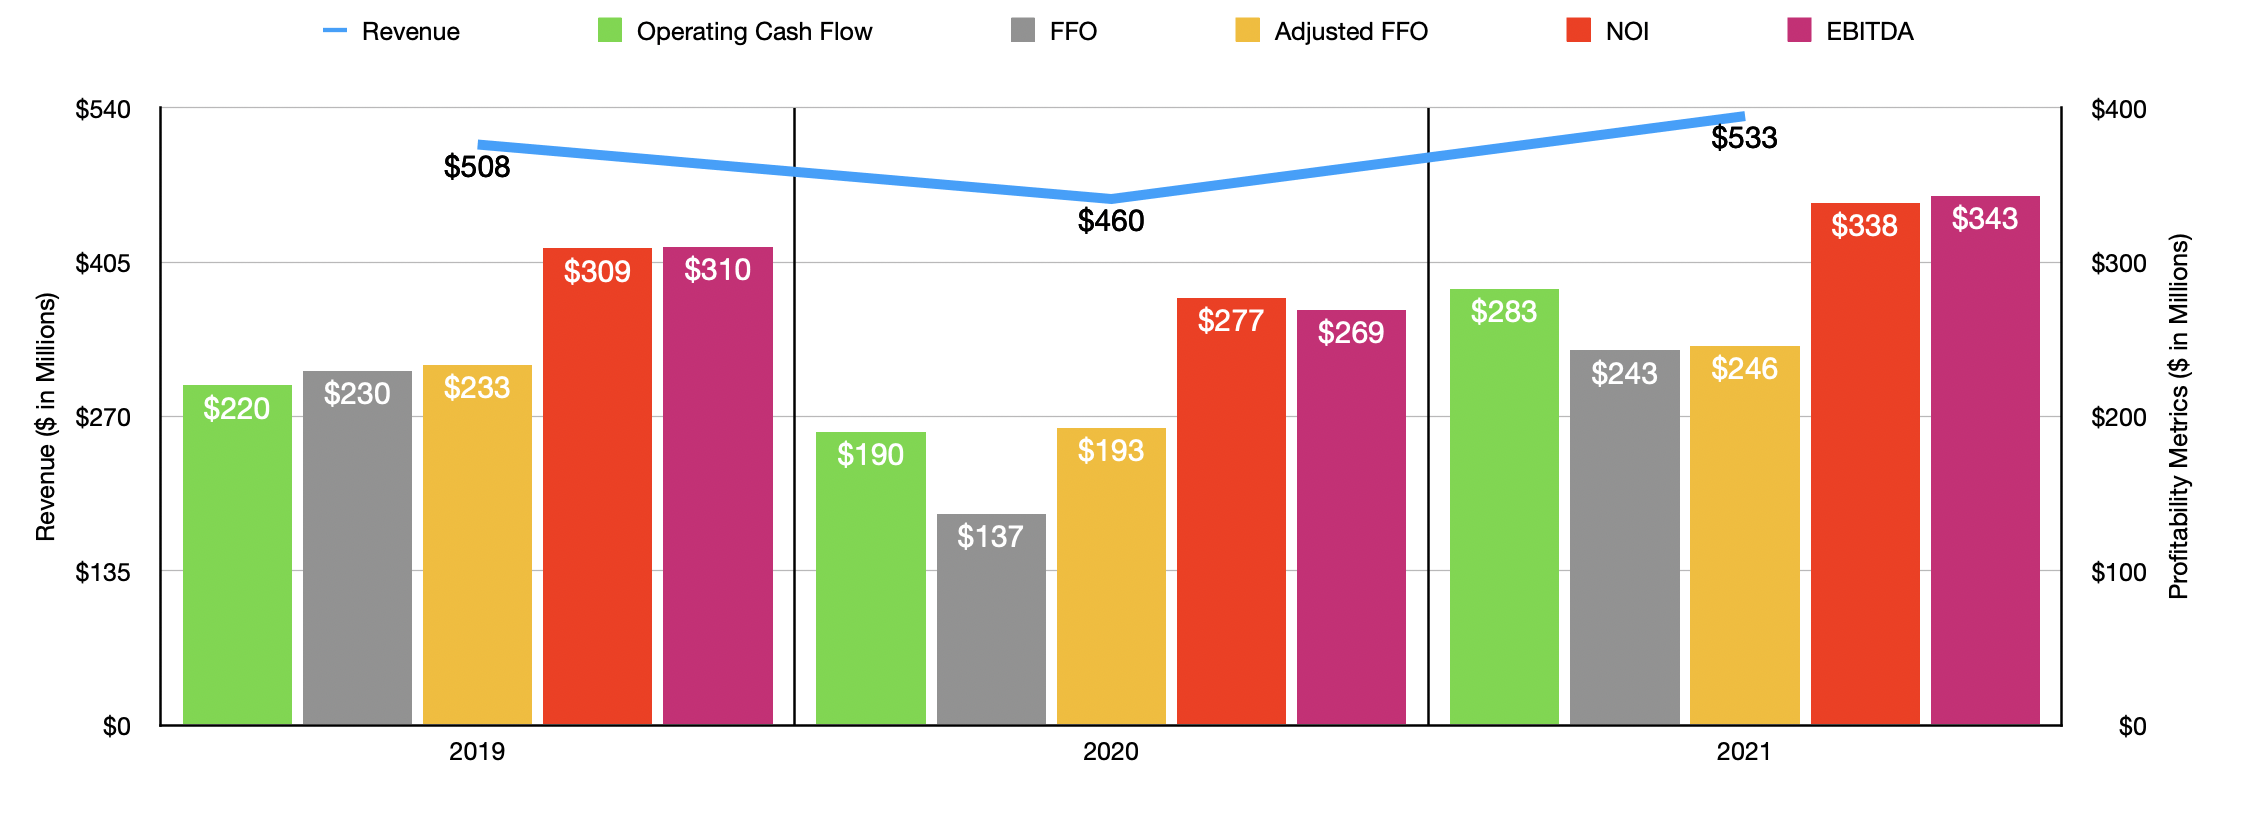
This return disparity may not seem like much. But at the end of the day, it can add up to a lot of money. While the market can be subject to wild fluctuations, I would make the case that the outperformance achieved by SITE Centers was wholly warranted. Consider, for instance, the company’s performance for its 2021 fiscal year as a whole. Revenue for that time came in at $532.9 million. This stacks up against the $460.3 million achieved in 2020 and it’s even higher than the $408 million reported for the company’s 2019 fiscal year. This improvement came even as the number of properties the business owns dropped, declining from 138 in 2020 to 136 by the end of 2021. The company benefited from an increase in occupancy from 89% to 90%. However, the average annual rent per square foot under its leases managed to drop slightly from $18.50 to $18.33. Of course, this does come with one caveat. The number of wholly-owned properties the company had managed to increase nicely from 2020 to 2021, climbing from 78 to 92. This came at the expense of joint ventures which reported a decline from 60 properties to 46.
Profitability for the company also managed to improve in 2021. Operating cash flow rose from $190.2 million in 2020 to $282.5 million last year. FFO, or funds from operations, grew from $176.6 million to $242.8 million. On an adjusted basis, this metric expanded from $192.8 million to $245.7 million. Meanwhile, NOI grew from $276.7 million to $338.3 million. And finally, EBITDA also improved, rising from $269.1 million to $342.9 million.
Author – SEC EDGAR Data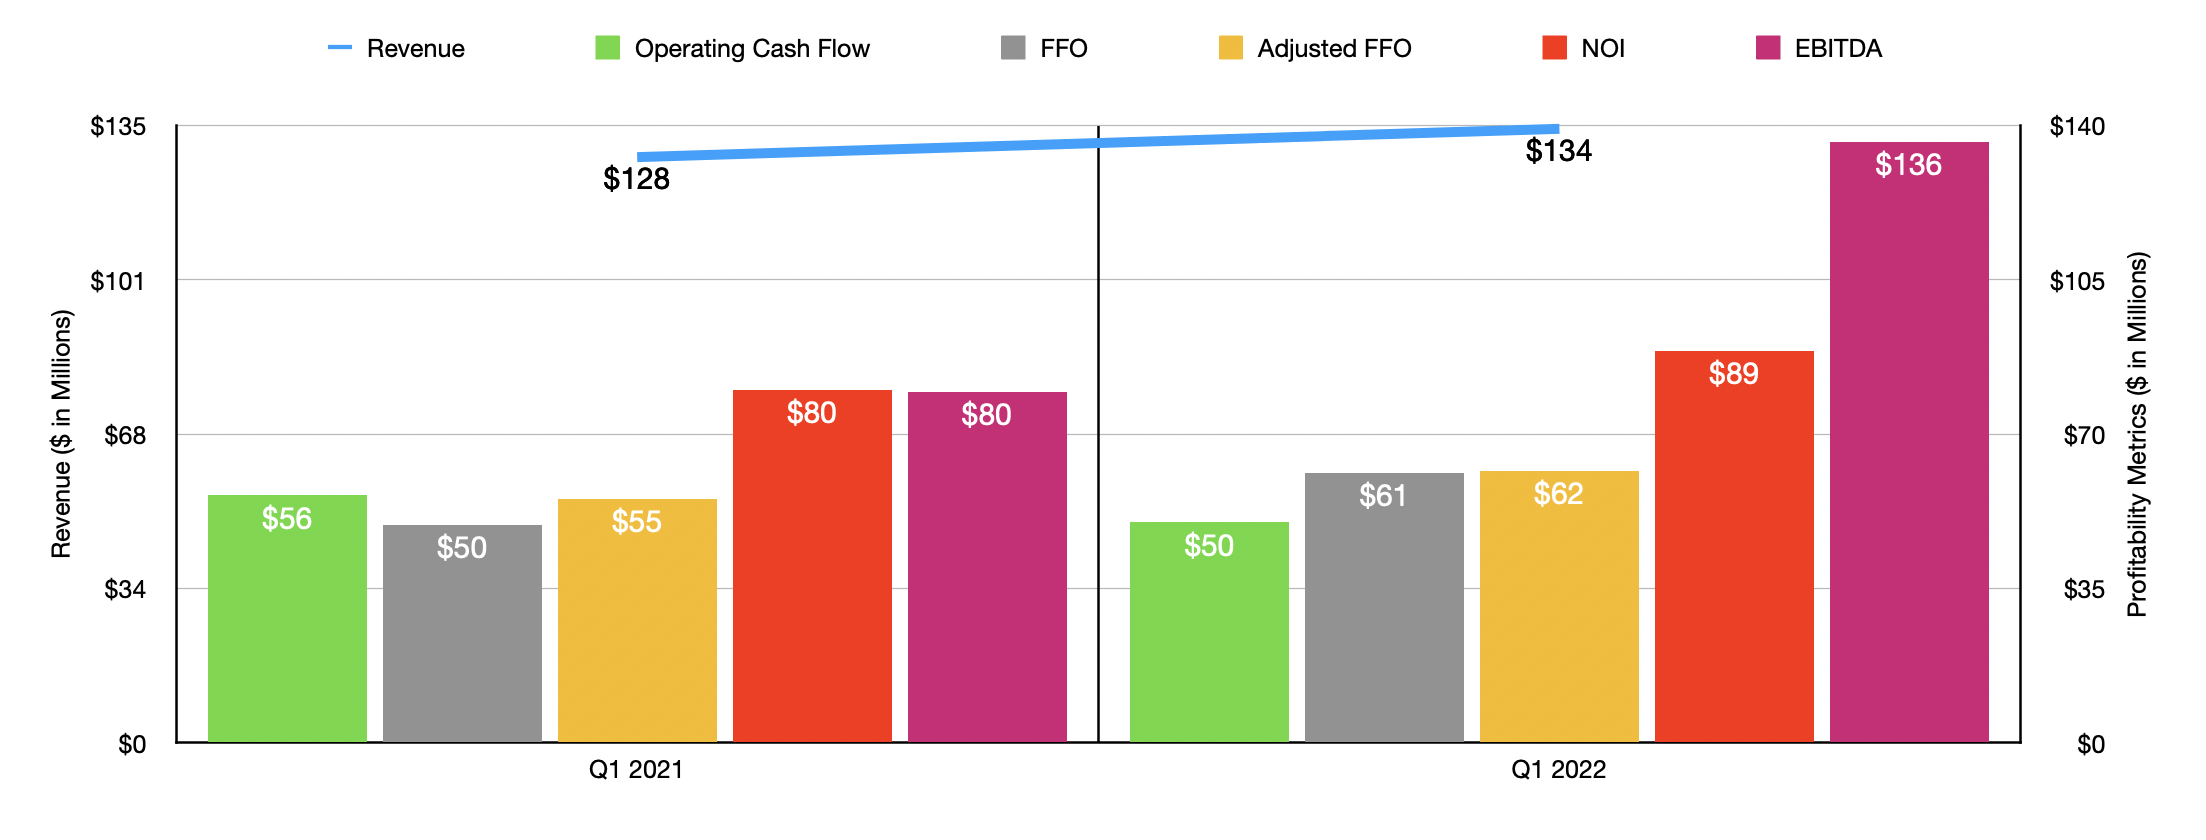
All of this is proof of a solid recovery for the company. But keep in mind the firm’s historical track record of declining sales from year to year. Falling profits have also followed suit as well, as I indicated in my prior article on the business. The good thing for investors, however, is that performance improvements have continued into the current fiscal year. Revenue, for starters, totaled $134.3 million in the first quarter of 2022. That compares to the $128.1 million achieved one year earlier. This 4.8% increase year-over-year came even as the number of properties the company had ownership over remained flat at 138. Instead, it was driven by two factors. First, we saw the company’s occupancy rate climb from 88.6% to 90.2%. And second, the average annual income the business brought in per square foot also improved, climbing from $18.39 to $18.55. Though the latter may not seem like much, that improvement, given the 42.2 million square feet of GLA (gross leasable area) the company has at the aforementioned occupancy rate, would result in an extra $6.1 million in revenue for the business over the course of a year, or $1.5 million over a three-month window.
For the 2022 fiscal year, the only guidance management gave was in relation to FFO per share. The current expectation is for this number to be between $1.10 and $1.15. At the midpoint, this would translate to FFO of roughly $240.6 million. Given how close that is to the 2021 results for the company, I decided just to value the business based on its historical performance. Doing this, we see that shares of the company are fairly affordable at this point in time. For starters, the price to operating cash flow multiple, with operating cash flow adjusted to deduct preferred distributions from it, would come out to 10.8. This compares to the 15.6 reading when I last wrote about the firm. Using the price to FFO approach, the multiple of 12.1 is better than the 16.5 in my prior article. On an adjusted basis, this number comes in at 11.9 compared to 15.1. The price to NOI multiple declined from 10.5 to 8.7, while the EV to EBITDA multiple fell nicely from 19 to 14.1.
Author – SEC EDGAR Data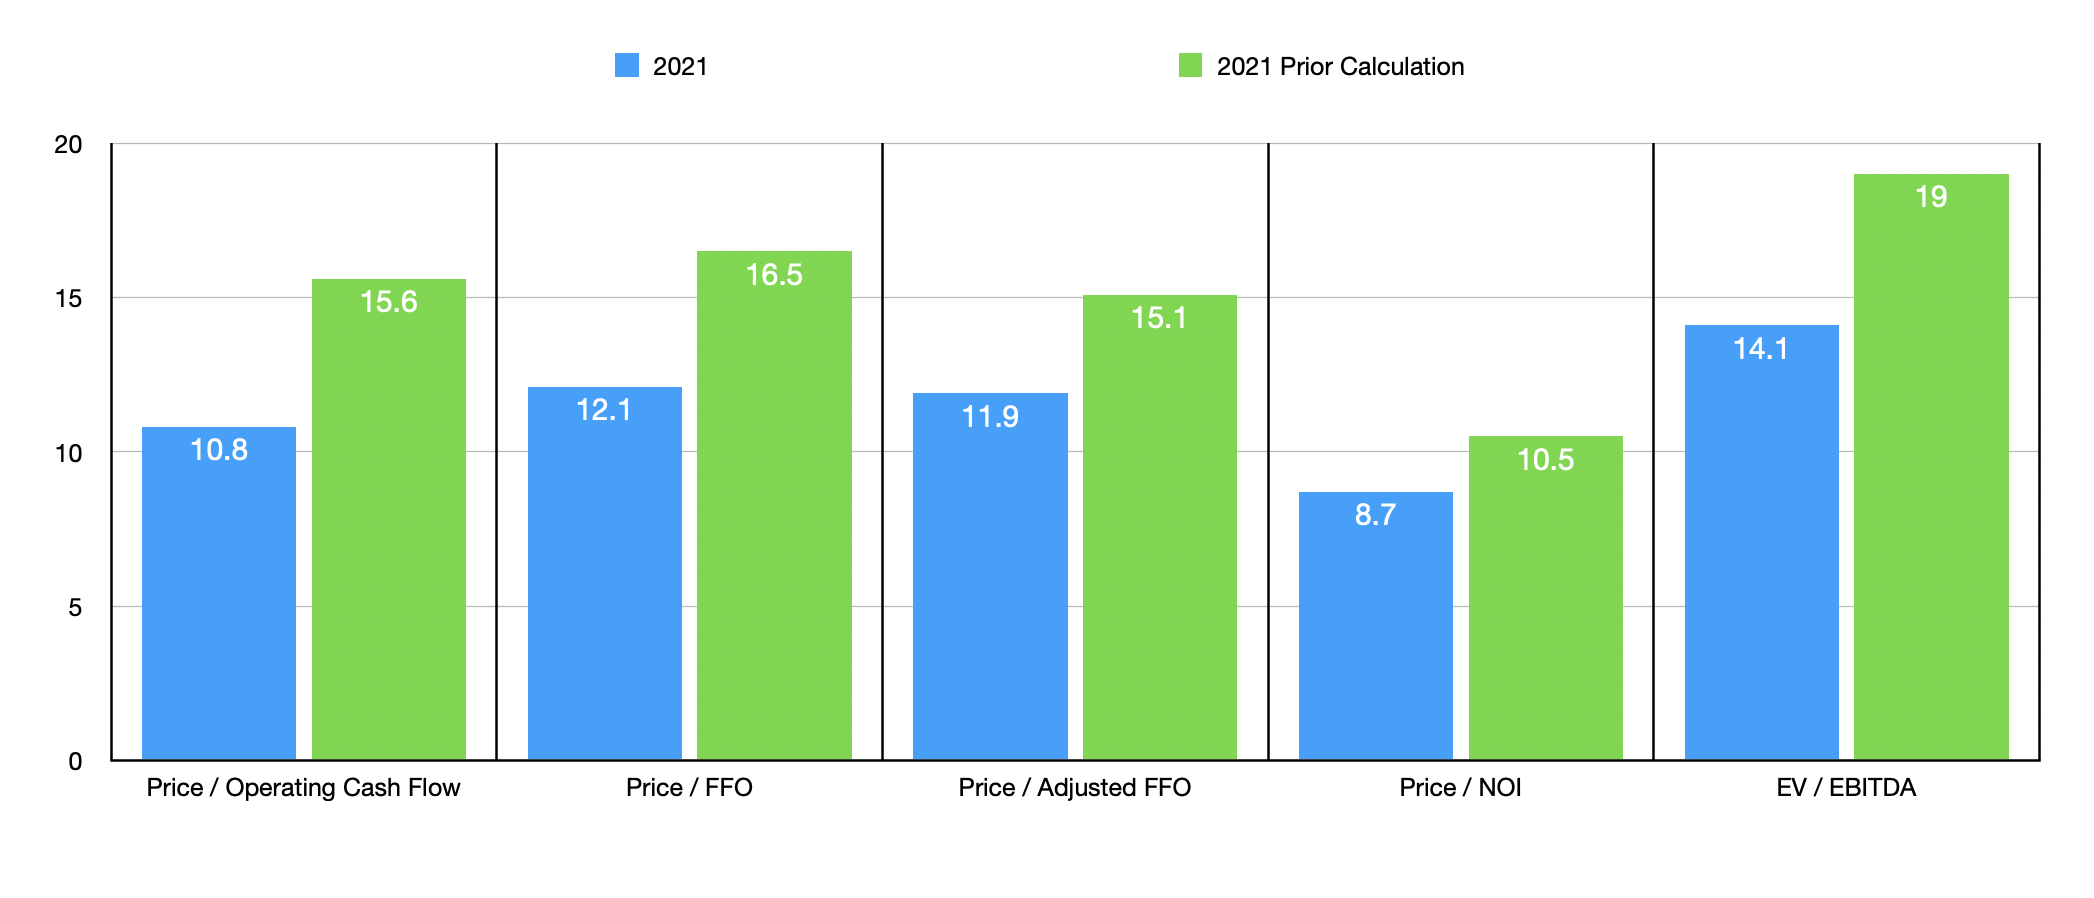
In addition to shares being cheaper now than they were previously, shares are also fairly cheap compared to similar players in the space. As part of my analysis, I decided to compare SITE Centers to five similar firms. On a price to operating cash flow basis, these companies ranged from a low of 6.6 to a high of 18.8. Only one of the five companies is cheaper than SITE Centers. Meanwhile, using the EV to EBITDA approach, the range is from 12 to 22.9. In this case, two of the five companies are cheaper than our prospect.
| Company | Price / Operating Cash Flow | EV / EBITDA |
| SITE Centers | 10.8 | 14.1 |
| The Macerich Company (MAC) | 6.6 | 12.0 |
| Retail Opportunity Investments (ROIC) | 14.3 | 16.2 |
| Urban Edge Corp (UE) | 13.4 | 13.7 |
| InvenTrust Properties (IVT) | 18.8 | 22.9 |
| Acadia Realty Trust (AKR) | 14.7 | 16.1 |
Takeaway
Based on the data provided, SITE Centers continues to improve. That says a lot when you consider the operational history of the enterprise. At the end of the day, shares are also looking more attractive than they were previously. But given the uncertainty caused by the broader economy and the challenges that shopping centers face, I cannot be as bullish on the firm as I would like. If conditions were different, I might ultimately rate the enterprise a ‘buy’, but for now, I’ve decided to retain my ‘hold’ rating on the business.
Be the first to comment