

Vertigo3d/E+ via Getty Images
Imagine a business where you earned a royalty on the amount of wealth in the world, and as wealth increased you would automatically see your earnings increase as well. You would have to do relatively little to maintain your royalty, so that your expenses were less than half your revenue, so you would get to keep more than half of revenue as profit. And imagine that the wealth on which the royalty was calculated was based mostly on stocks, the fastest appreciating asset on average. What’s more, most of the revenue you get is recurring in nature, and you have to reinvest very little to grow the business, so you get a lot of free cash flow that you can use to pay dividends, do share buybacks, or invent new lines of business. The closest we have seen to this imaginary business is MSCI (NYSE:MSCI).
As can be seen in the slide below, ~$16.7 trillion assets are bench-marked to MSCI indexes, meaning MSCI earns a small fee/royalty from this total. Even if the fee is small, the amount is so large that it becomes a huge source of revenue, and very attractive revenue, since most of the expenses MSCI incurs is just headcount.
MSCI Investor Presentation
Of course there is more to MSCI’s business than just creating an index, and they do have to handle huge amounts of data, which they have to clean and enhance, process and enrich, and deliver to the customers as indexes calculated daily. The power of their brand is what really makes those indices relevant.
MSCI Investor Presentation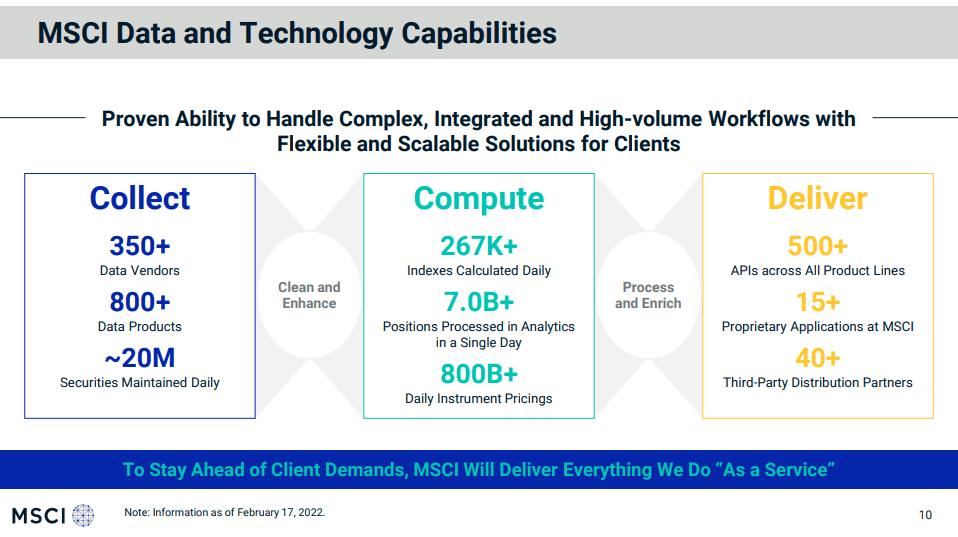
While MSCI also has other businesses, such as tools and analytical models, risk management technology, etc. the crown jewel is without a doubt the indices business. Overall MSCI has a very robust and compelling business model, where ~97% of revenue is recurring, the company has high operating leverage so it can grow earnings faster than revenues, and the business is not highly capital intensive, so it converts a high percentage of its profits into excess cash. This excess cash can be used for things like share repurchases, dividends, or new product lines.
This exceptionally strong business model has delivered excellent results, with revenue growing ~11% CAGR, adjusted EBITDA at ~13% CAGR, and a very impressive ~21% CAGR for free cash flow and adjusted earnings per share.
MSCI Investor Presentation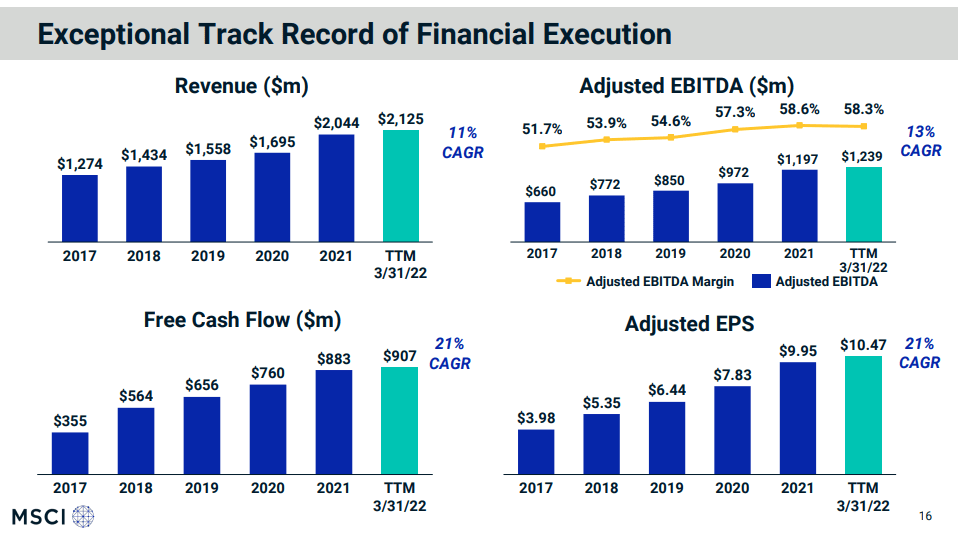
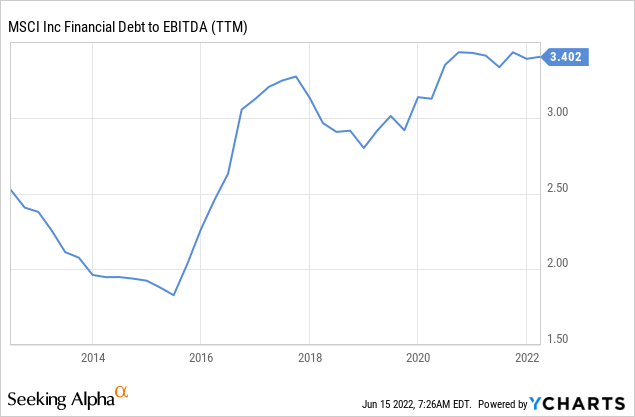
Balance Sheet
Not only is MSCI a fantastic business, but it is also in great financial shape. It has net debt of only ~$3.4 billion, and a debt/EBITDA ratio of only ~3.4x. Its next maturity is not until 2029, and the company has solid investment credit ratings.
Dividends and buybacks
In the first quarter of 2022 MSCI returned $857 million to shareholders through share repurchases of $772 million, and dividends of $84 million. As can be seen, MSCI’s preference is to return cash to investors through buybacks when shares are undervalued, or at least reasonably valued. The dividend is small but has been growing quickly.
MSCI Investor Presentation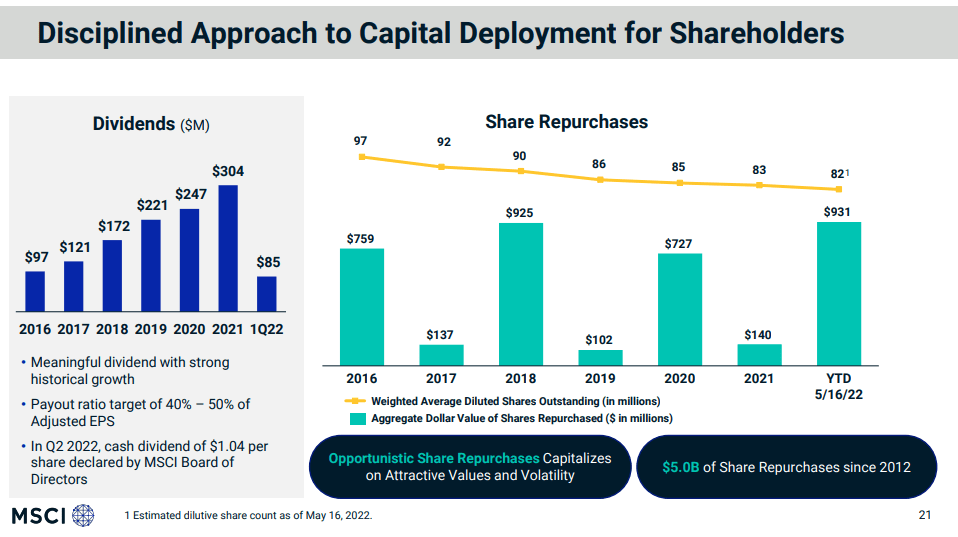
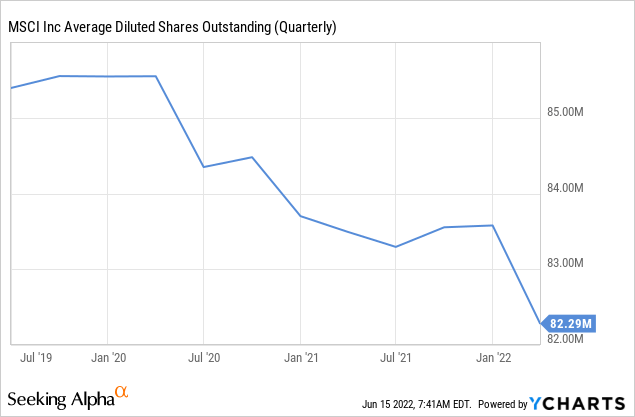
As a result of the consistent share repurchases, shares outstanding have been decreasing, as can be seen in the graph below.
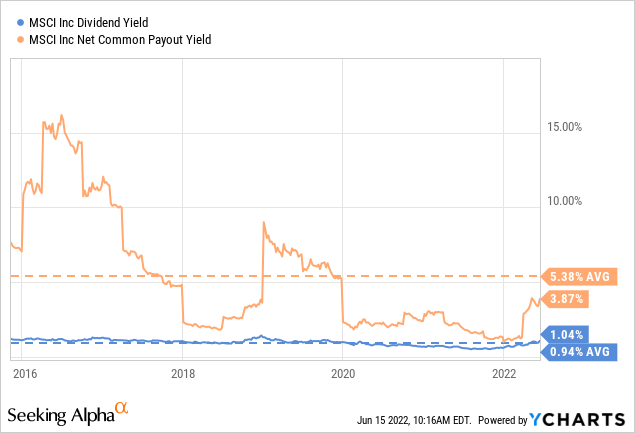
Now, while the dividend might seem low at a ~1% yield, it has been growing quickly and keeping up with the share price appreciation. The company has been a lot more generous than this, when looking at the net common payout yield (which combines net share repurchases and the dividend) we see it has averaged over 5% the last five years.
Peers
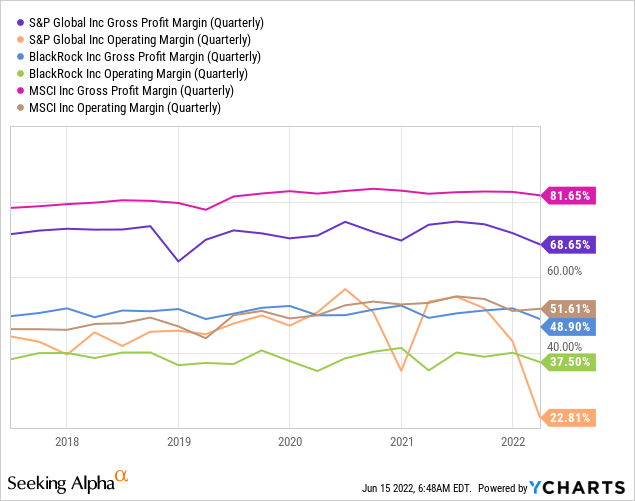
MSCI has some peers with similar models also operating in the financial services industry. Among these the most relevant are S&P Global (SPGI), and BlackRock (BLK). These two companies have incredibly attractive business models just like MSCI, and they also have very attractive profit margins. Currently the highest gross profit margin, and operating profit margin goes to MSCI, but all three have outstanding margins and financial characteristics.
Resiliency over market cycles
A combination of cash inflows and market appreciation (on average) have kept the assets under management of ETFs linked to MSCI Equity Indexes growing at a very nice ~14% CAGR. This has been accomplished despite market downturns, the financial crisis, the European sovereign debt issues, Brexit, etc.
MSCI Investor Presentation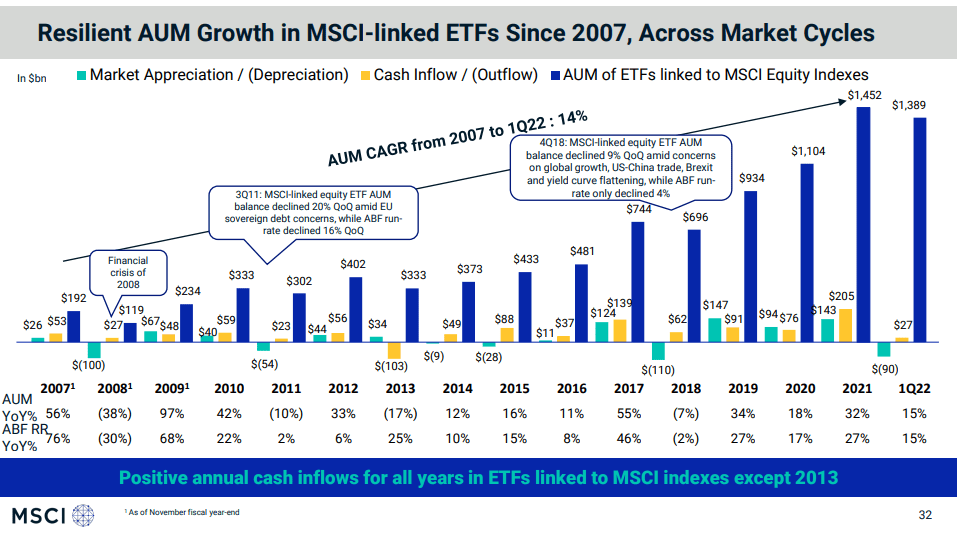
Valuation
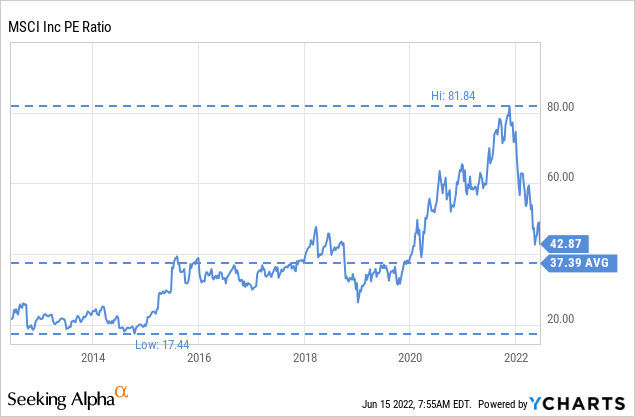
We’ve already covered why MSCI is such a wonderful company, unfortunately many people agree, which has driven the valuation very high. Still, thanks to the recent market pullback the valuation is now approaching its ten year average when measured by the trailing twelve months price/earnings ratio. Shares are not the bargain they were when they traded with a P/E of ~17x, but we believe something like the 37x average can be justified by the quality of the business and the consistent growth.
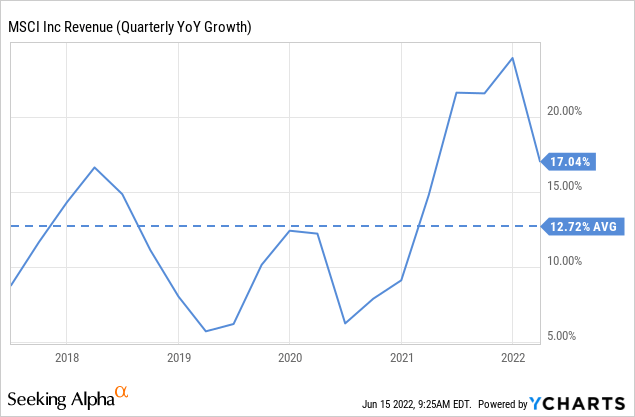
For example, if we look at the last five years we see that revenue growth has averaged ~12%, and it has actually been higher recently. We believe that even if growth were to decelerate a bit, that MSCI can continue posting double digit revenue and earnings growth for several more years at least.
To value MSCI we did a simple discounted cash flow model, assuming earnings growth decelerates a bit to 15% for the next decade, from the 21% the company averaged the last ten years. We then give a terminal growth rate of 5%, and discount everything by our minimum rate of return required of 10%. With these assumptions we get a net present value of $440, which is ~10% higher than where shares currently trade at, and pointing to a slight under valuation in the shares. Still, some investors might want a larger margin of safety before investing.
| EPS | Discounted @ 10% | |
| FY 22E | 11.37 | 10.34 |
| FY 23E | 12.94 | 10.69 |
| FY 24E | 15.19 | 11.41 |
| FY 25E | 17.47 | 11.93 |
| FY 26E | 20.09 | 12.47 |
| FY 27E | 23.10 | 13.04 |
| FY 28E | 26.57 | 13.63 |
| FY 29E | 30.55 | 14.25 |
| FY 30E | 35.14 | 14.90 |
| FY 31E | 40.41 | 15.58 |
| FY 32 E | 46.47 | 16.29 |
| Terminal Value @ 5% terminal growth | 929.33 | 296.11 |
| NPV | $440.65 |
Why MSCI Why Now
The valuation of MSCI has not been as attractive since 2020, and given the high growth rate of the company, the intrinsic value continues growing. We believe current prices are attractive enough that an investor can justify at least starting to build a small position, while waiting for a larger margin of safety before doubling down (if that larger margin of safety arrives, of course).
Risks
Since MSCI gets a fee proportional to the assets under management, if the stock market collapses this can significantly reduce MSCI’s earnings. What is worrisome, especially in the US market, is that total market capitalization to GDP is near a record, which means that there is potential for significant losses for the market, which would depress MSCI’s earnings. Still, it is possible the company might even remain profitable if the market crashes. That is the beauty of its very high profit margins.
The other important risk is customer concentration, with BlackRock representing about 13% of MSCI’s revenues. If this continues to increase it could place BlackRock in a position to demand lower fees from MSCI.
YCharts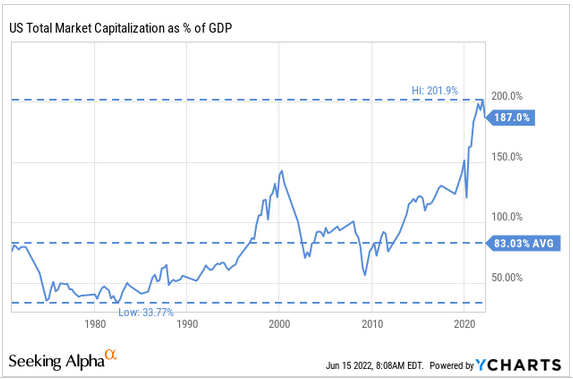
Conclusion
MSCI is one of the highest-quality companies we have ever analyzed. It has an extraordinary business model, outstanding financials, and impressive growth. This is a company investors certainly want in their portfolios. The only question is about valuation, which remains high, but has come down to what we would argue is now a reasonable level. Still, investors wanting a larger margin of safety might do well waiting for a larger discount to intrinsic value.
Be the first to comment