

yorkfoto/iStock via Getty Images
Earnings of Simmons First National Corporation (NASDAQ:SFNC) will likely dip this year because of provision normalization. On the other hand, acquired loan growth along with organic loan growth will support earnings. Moreover, the margin will benefit to a moderate degree from the rising rate environment. Overall, I’m expecting Simmons First to report earnings of $2.21 per share for 2022, down 10% year-over-year. Compared to my last report on the company, I’ve increased my earnings estimate mostly because I’ve raised my loan growth estimate. For 2023, I’m expecting earnings to grow by 18% to $2.61 per share. The year-end target price suggests a small upside from the current market price. Therefore, I’m downgrading Simmons First National to a hold rating.
Robust Loan Pipelines Bode Well for Organic Loan Growth
Simmons First National completed the acquisition of Spirit of Texas Bancshares during the second quarter, which increased the company’s loan balance by 15%, as mentioned in the earnings presentation. Apart from the acquired growth, organic loan growth was also incredibly strong during the quarter. In total, Simmons First National’s loan book grew by 25.7% during the quarter.
The company’s commercial loan pipeline has surged over the last year. Pipeline volume was up 28% quarter-on-quarter and 134% year-over-year, as mentioned in the presentation. Therefore, commercial loan growth will likely remain strong in future quarters.
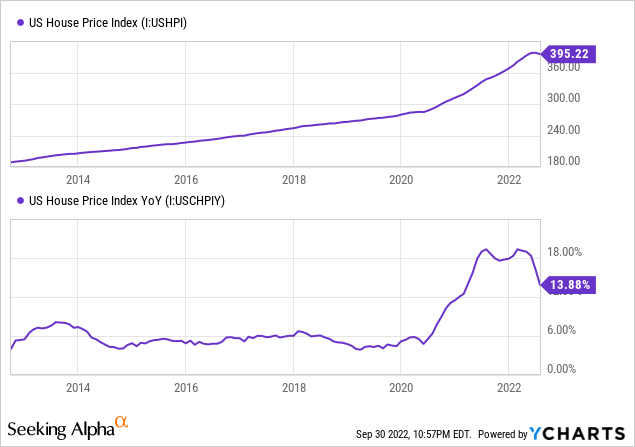
However, the growth of residential mortgage loans, which make up around 16% of total loans, will most probably drop in the remainder of the year. High borrowing costs will play a key role in the loan growth slowdown. Further, despite a recent drop, home prices are still very high from a historical perspective. These will keep demand for mortgages low.
Historically, most of Simmons First National’s growth has come from acquisitions, as opposed to organic means. The company has completed 14 acquisitions in the last ten years, as mentioned on its website. The management hasn’t announced any new transactions; therefore, I’m not assuming any acquired growth for the next year and a half.
Considering these factors, I’m expecting the loan portfolio to grow by 2% every quarter in the second half of 2022 and 1% every quarter in 2023. This will lead to a loan growth of 31% for 2022. In my last report on Simmons First National, I estimated loan growth of 21% for 2022. I’ve increased my loan growth estimate partly because of the second quarter’s surprise performance. Further, I’ve raised my estimate for the second half of the year because the pipelines are more robust than I previously anticipated.
Deposit Mix and Securities Portfolio Limit the Benefit from Rising Rates
Simmons First National’s loan yield is quite rate-sensitive as variable-rate loans made up 45% of total loans at the end of June 2022, as mentioned in the presentation. Unfortunately, the company has a large securities portfolio, which made up 34% of earning assets at the end of June 2022. Out of total securities, 84% were fixed-rate based, as mentioned in the presentation. The fixed securities will hold back the average earning-asset yield as market rates rise.
On the other side of the balance sheet, the deposit cost is quite rate-sensitive as interest-bearing-transaction accounts made up 58.2% of total deposits at the end of June 2022. These deposits will re-price soon after every rate hike.
The results of the management’s interest rate sensitivity analysis given in the presentation show that a 200-basis points hike in interest rates can boost the net interest income by only 4.11% over twelve months.
2Q 2022 Earnings Presentation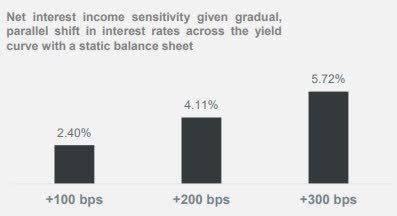
Considering these factors, I’m expecting the margin to increase by 20 basis points in the second half of 2022 and five basis points in 2023.
Provision Normalization to Drag Earnings this Year
The anticipated loan additions and margin expansion will likely drive earnings in the next year and a half. On the other hand, the provisions for expected loan losses will likely drag earnings this year. The provisioning expense will likely remain near a normal level this year following last year’s large provision reversals. Allowances were 334% of non-performing loans at the end of June 2022, up from 278% at the end of March 2022. This increase in allowance coverage was attributable to a significant improvement in asset quality. I’m expecting the asset quality improvement to reverse in the second half because of high inflation. Further, I believe the existing allowance will be enough to cover credit quality worsening for the remainder of the year. Therefore, I’m not expecting much provisioning pressure from heightened inflation. Overall, I’m expecting the net provision expense to make up around 0.24% of total loans (annualized) every quarter till the end of 2023, which is the same as the average for the last five years.
Overall, I’m expecting Simmons First National to report earnings of $2.21 per share for 2022, down 10% year-over-year. For 2023, I’m expecting earnings to grow by 18% to $2.61 per share. The following table shows my income statement estimates.
| FY18 | FY19 | FY20 | FY21 | FY22E | FY23E | |||||
| Income Statement | ||||||||||
| Net interest income | 553 | 602 | 640 | 592 | 749 | 875 | ||||
| Provision for loan losses | 38 | 43 | 75 | (33) | 34 | 40 | ||||
| Non-interest income | 144 | 198 | 240 | 192 | 163 | 155 | ||||
| Non-interest expense | 392 | 454 | 485 | 484 | 537 | 572 | ||||
| Net income – Common Sh. | 216 | 238 | 255 | 271 | 279 | 343 | ||||
| EPS – Diluted ($) | 2.32 | 2.41 | 2.31 | 2.46 | 2.21 | 2.61 | ||||
|
Source: SEC Filings, Earnings Releases, Author’s Estimates (In USD million unless otherwise specified) |
||||||||||
In my last report on Simmons First National, I estimated earnings of $2.02 per share for 2022. I’ve increased my earnings estimate mostly because I’ve increased my loan growth estimate.
Actual earnings may differ materially from estimates because of the risks and uncertainties related to inflation, and consequently, the timing and magnitude of interest rate hikes. Further, a stronger or longer-than-anticipated recession can increase the provisioning for expected loan losses beyond my estimates.
Rising Interest Rates to Pressurize the Book Value
The equity book value has plunged sharply in the first half of the year from $28.4 per share at the end of December 2021 to $25.3 per share at the end of June 2022. The decline was partly attributable to the shares issued to the Spirit of Texas Bancshares’ shareholders. Also, the accumulation of unrealized losses on available-for-sale securities led to a decline in equity book value. As interest rates increased, the market value of available-for-sale securities dropped, resulting in unrealized losses. These losses skipped the income statement and directly eroded the equity book value, as per relevant accounting standards.
Further erosion is likely because the federal funds rate has increased by 150 basis points during the third quarter of 2022. Moreover, the Federal Reserve is projecting another 125 to 150 basis point hike in the fed funds rate by the end of 2023. On the other hand, retained earnings will lift equity book value. The following table shows my balance sheet estimates.
| FY18 | FY19 | FY20 | FY21 | FY22E | FY23E | |
| Financial Position | ||||||
| Net Loans | 11,667 | 14,357 | 12,663 | 11,807 | 15,500 | 16,129 |
| Growth of Net Loans | 8.6% | 23.1% | (11.8)% | (6.8)% | 31.3% | 4.1% |
| Other Earning Assets | 3,136 | 4,537 | 7,200 | 10,123 | 9,055 | 9,237 |
| Deposits | 12,399 | 19,850 | 16,987 | 19,367 | 22,926 | 23,857 |
| Borrowings and Sub-Debt | 1,795 | 1,836 | 2,024 | 1,908 | 1,653 | 1,687 |
| Common equity | 2,246 | 2,988 | 2,976 | 3,249 | 3,297 | 3,535 |
| Book Value Per Share ($) | 24.2 | 30.2 | 27.0 | 28.4 | 25.1 | 26.9 |
| Tangible BVPS ($) | 14.1 | 18.3 | 16.2 | 17.4 | 14.1 | 15.9 |
|
Source: SEC Filings, Author’s Estimates (In USD million unless otherwise specified) |
Downgrading to a Hold Rating
Given the earnings outlook, I’m expecting the company to increase its dividend by $0.01 per share to $0.20 per share in the first quarter of 2023. The earnings and dividend estimates suggest a payout ratio of 31% for 2023, which is close to the last four-year average of 28%. Based on my dividend estimate, Simmons First National is offering a dividend yield of 3.7%.
I’m using the historical price-to-tangible book (“P/TB”) and price-to-earnings (“P/E”) multiples to value Simmons First National. The stock has traded at an average P/TB ratio of 1.57 in the past, as shown below.
| FY18 | FY19 | FY20 | FY21 | Average | ||
| T. Book Value per Share ($) | 14.1 | 18.3 | 16.2 | 17.4 | ||
| Average Market Price ($) | 29.4 | 24.9 | 18.9 | 29.2 | ||
| Historical P/TB | 2.08x | 1.36x | 1.16x | 1.67x | 1.57x | |
| Source: Company Financials, Yahoo Finance, Author’s Estimates | ||||||
Multiplying the average P/TB multiple with the forecast tangible book value per share of $14.1 gives a target price of $22.1 for the end of 2022. This price target implies a 1.5% upside from the September 30 closing price. The following table shows the sensitivity of the target price to the P/TB ratio.
| P/TB Multiple | 1.37x | 1.47x | 1.57x | 1.67x | 1.77x |
| TBVPS – Dec 2022 ($) | 14.1 | 14.1 | 14.1 | 14.1 | 14.1 |
| Target Price ($) | 19.3 | 20.7 | 22.1 | 23.5 | 24.9 |
| Market Price ($) | 21.8 | 21.8 | 21.8 | 21.8 | 21.8 |
| Upside/(Downside) | (11.5)% | (5.0)% | 1.5% | 7.9% | 14.4% |
| Source: Author’s Estimates |
The stock has traded at an average P/E ratio of around 10.8x in the past, as shown below.
| FY18 | FY19 | FY20 | FY21 | Average | ||
| Earnings per Share ($) | 2.32 | 2.41 | 2.31 | 2.46 | ||
| Average Market Price ($) | 29.4 | 24.9 | 18.9 | 29.2 | ||
| Historical P/E | 12.6x | 10.3x | 8.2x | 11.9x | 10.8x | |
| Source: Company Financials, Yahoo Finance, Author’s Estimates | ||||||
Multiplying the average P/E multiple with the forecast earnings per share of $2.21 gives a target price of $23.8 for the end of 2022. This price target implies a 9.2% upside from the September 30 closing price. The following table shows the sensitivity of the target price to the P/E ratio.
| P/E Multiple | 8.8x | 9.8x | 10.8x | 11.8x | 12.8x |
| EPS 2022 ($) | 2.21 | 2.21 | 2.21 | 2.21 | 2.21 |
| Target Price ($) | 19.4 | 21.6 | 23.8 | 26.0 | 28.2 |
| Market Price ($) | 21.8 | 21.8 | 21.8 | 21.8 | 21.8 |
| Upside/(Downside) | (11.1)% | (1.0)% | 9.2% | 19.3% | 29.5% |
| Source: Author’s Estimates |
Equally weighting the target prices from the two valuation methods gives a combined target price of $22.9, which implies a 5.3% upside from the current market price. Adding the forward dividend yield gives a total expected return of 9.0%.
In my last report, I adopted a higher target price of $25.1 per share. I have now reduced my target price mostly because of the impact of the up-rate cycle on the tangible book value per share. As I’m no longer expecting a high enough total return, I’m downgrading Simmons First National to a hold rating.
Be the first to comment