

designer491
Earnings of Simmons First National Corporation (NASDAQ:SFNC) will most probably recover next year thanks to mid-single-digit loan growth. Further, slight margin expansion will help the bottom line. Overall, I’m expecting Simmons First National to report earnings of $2.00 per share for 2022, down 19%, and $2.34 per share for 2023, up 17% year-over-year. Compared to my last report on the company, I’ve revised downwards my earnings estimates mostly because I’ve decreased my margin estimates. Next year’s target price suggests a high upside from the current market price. Therefore, I’m upgrading Simmons First National Corporation to a buy rating.
Improvement in Deposit Mix to Help the Margin
Simmons First National Corporation’s net interest margin grew by only 10 basis points in the third quarter to 3.34%, which missed my expectations. Fortunately, the company improved its deposit mix during the third quarter. Interest-bearing-transaction and savings accounts were down to 54.6% of total deposits by the end of September from 58.2% at the end of June 2022. These deposits reprice soon after every rate hike, so it’s good that the management has successfully reduced their proportion in the total deposit book. Additionally, the management has increased its non-interest-bearing deposits to 28.1% by the end of September from 27.5% at the end of June 2022.
Despite the improvement, the deposit mix is still not enviably placed for rate hikes. Moreover, the asset mix is not very favorable in the current rate environment. Around 56% of loans carry fixed rates while the remaining 44% carry variable rates, as mentioned in the earnings presentation. Moreover, the securities portfolio will hold back the margin. Simmons First National Corporation has a large securities portfolio, which makes up around 33% of total earning assets. Around 85% of these securities carry fixed rates, as mentioned in the presentation.
The results of the management’s interest-rate sensitivity analysis given in the presentation showed that a 200-basis points hike in interest rates could increase the net interest income by only 1.9% over twelve months.
3Q 2022 10-Q Filing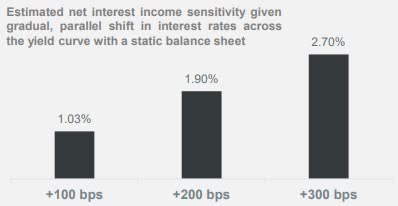
I’m expecting a 50-basis points rate hike in the first half of 2023, after which I’m expecting the fed funds rate to plateau at 5.0%. Considering these factors, I’m expecting the net interest margin to increase by five basis points in the last quarter of 2022 and another five basis points in 2023. Compared to my last report on the company, I’ve reduced my margin estimate because the third quarter’s performance missed my expectations.
Loan Outlook is Mixed Due to Conflicting Economic Factors
Simmons First National Corporation’s loan portfolio grew by an impressive 3.4% during the third quarter of 2022. Loan growth will most probably slow down in future quarters because of interest rate hikes. The residential mortgage portfolio will be affected the most as home purchases depend heavily on financing costs. Fortunately, this segment is not a big component of the loan portfolio. Residential mortgages made up 16% of total loans at the end of September 2022.
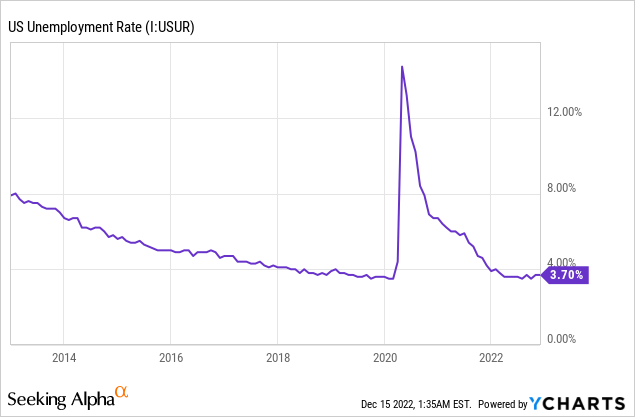
On the other hand, strong job markets indicate good economic activity, which bodes well for commercial loan growth. Simmons First National is based in the mid-South with branches in Arkansas, Kansas, Missouri, Oklahoma, Tennessee, and Texas. The economies of these states are quite different from each other; therefore, the national average is appropriate to gauge the demand in Simmons’ markets. As shown below, the country’s unemployment rate has remained persistently low throughout this year.
Considering these factors, I’m expecting the loan portfolio to grow by 2% in the last quarter of 2022, taking full-year loan growth to 33%. For 2023, I’m expecting the loan portfolio to grow by 4%. Meanwhile, I’m expecting deposits to grow mostly in line with loans. However, the growth of securities and equity book value will trail loan growth because of the rising rate environment. As interest rates rise, the market value of securities falls, leading to unrealized mark-to-market losses that skip the income statement and directly erode the equity book value. The following table shows my balance sheet estimates.
| Financial Position | FY18 | FY19 | FY20 | FY21 | FY22E | FY23E |
| Net Loans | 11,667 | 14,357 | 12,663 | 11,807 | 15,718 | 16,356 |
| Growth of Net Loans | 8.6% | 23.1% | (11.8)% | (6.8)% | 33.1% | 4.1% |
| Other Earning Assets | 3,136 | 4,537 | 7,200 | 10,123 | 8,286 | 8,453 |
| Deposits | 12,399 | 19,850 | 16,987 | 19,367 | 22,592 | 23,509 |
| Borrowings and Sub-Debt | 1,795 | 1,836 | 2,024 | 1,908 | 1,507 | 1,537 |
| Common equity | 2,246 | 2,988 | 2,976 | 3,249 | 3,057 | 3,105 |
| Book Value Per Share ($) | 24.2 | 30.2 | 27.0 | 28.4 | 23.8 | 24.2 |
| Tangible BVPS ($) | 14.1 | 18.3 | 16.2 | 17.4 | 12.6 | 13.0 |
| Source: SEC Filings, Earnings Releases, Author’s Estimates (In USD million unless otherwise specified) | ||||||
Expecting Earnings to Dip this Year and Partially Recover Next Year
The anticipated loan additions and slight margin expansion will drive earnings next year. Meanwhile, provisioning will likely remain at a normal level. Allowances made up 1.27% of total loans, while nonperforming loans were just 0.37% of total loans at the end of September 2022, as mentioned in the presentation. As a result, the allowance coverage appears satisfactory ahead of a possible recession. I’m expecting the net provision expense to make up 0.24% of total loans in 2023, which is the same as the average for the last five years.
Overall, I’m expecting Simmons First National to report earnings of $2.34 per share for 2023. For 2022, I’m expecting the company to report earnings of $2.00 per share, down 19% year-over-year. The following table shows my income statement estimates.
| Income Statement | FY18 | FY19 | FY20 | FY21 | FY22E | FY23E |
| Net interest income | 553 | 602 | 640 | 592 | 721 | 818 |
| Provision for loan losses | 38 | 43 | 75 | (33) | 24 | 40 |
| Non-interest income | 144 | 198 | 240 | 192 | 169 | 175 |
| Non-interest expense | 392 | 454 | 485 | 484 | 564 | 587 |
| Net income – Common Sh. | 216 | 238 | 255 | 271 | 247 | 300 |
| EPS – Diluted ($) | 2.32 | 2.41 | 2.31 | 2.46 | 2.00 | 2.34 |
| Source: SEC Filings, Earnings Releases, Author’s Estimates (In USD million unless otherwise specified) | ||||||
In my last report on Simmons First National Corporation, I estimated earnings of $2.21 per share for 2022 and $2.61 per share for 2023. I’ve reduced my earnings estimates mostly because I’ve revised downwards my margin estimate following the third quarter’s results.
My estimates are based on certain macroeconomic assumptions that may not come to pass. Therefore, actual earnings can differ materially from my estimates.
Upgrading to a Buy Rating
Given the earnings outlook, I’m expecting the company to increase its dividend by $0.01 per share to $0.20 per share in the first quarter of 2023. The earnings and dividend estimates suggest a payout ratio of 34% for 2023, which is above the last four-year average of 28% but easily sustainable. Based on my dividend estimate, Simmons First National is offering a dividend yield of 4.0%.
I’m using the historical price-to-tangible book (“P/TB”) and price-to-earnings (“P/E”) multiples to value Simmons First National. The stock has traded at an average P/TB ratio of 1.57 in the past, as shown below.
| FY18 | FY19 | FY20 | FY21 | Average | ||
| T. Book Value per Share ($) | 14.1 | 18.3 | 16.2 | 17.4 | ||
| Average Market Price ($) | 29.4 | 24.9 | 18.9 | 29.2 | ||
| Historical P/TB | 2.08x | 1.36x | 1.16x | 1.67x | 1.57x | |
| Source: Company Financials, Yahoo Finance, Author’s Estimates | ||||||
Multiplying the average P/TB multiple with the forecast tangible book value per share of $13.0 gives a target price of $20.3 for the end of 2023. This price target implies a 0.5% upside from the December 14 closing price. The following table shows the sensitivity of the target price to the P/TB ratio.
| P/TB Multiple | 1.37x | 1.47x | 1.57x | 1.67x | 1.77x |
| TBVPS – Dec 2023 ($) | 13.0 | 13.0 | 13.0 | 13.0 | 13.0 |
| Target Price ($) | 17.8 | 19.0 | 20.3 | 21.6 | 22.9 |
| Market Price ($) | 20.3 | 20.3 | 20.3 | 20.3 | 20.3 |
| Upside/(Downside) | (12.3)% | (5.9)% | 0.5% | 6.9% | 13.3% |
| Source: Author’s Estimates |
The stock has traded at an average P/E ratio of around 10.8x in the past, as shown below.
| FY18 | FY19 | FY20 | FY21 | Average | ||
| Earnings per Share ($) | 2.32 | 2.41 | 2.31 | 2.46 | ||
| Average Market Price ($) | 29.4 | 24.9 | 18.9 | 29.2 | ||
| Historical P/E | 12.6x | 10.3x | 8.2x | 11.9x | 10.8x | |
| Source: Company Financials, Yahoo Finance, Author’s Estimates | ||||||
Multiplying the average P/E multiple with the forecast earnings per share of $2.34 gives a target price of $25.2 for the end of 2023. This price target implies a 24.2% upside from the December 14 closing price. The following table shows the sensitivity of the target price to the P/E ratio.
| P/E Multiple | 8.8x | 9.8x | 10.8x | 11.8x | 12.8x |
| EPS 2023 ($) | 2.34 | 2.34 | 2.34 | 2.34 | 2.34 |
| Target Price ($) | 20.5 | 22.8 | 25.2 | 27.5 | 29.8 |
| Market Price ($) | 20.3 | 20.3 | 20.3 | 20.3 | 20.3 |
| Upside/(Downside) | 1.1% | 12.7% | 24.2% | 35.8% | 47.4% |
| Source: Author’s Estimates |
Equally weighting the target prices from the two valuation methods gives a combined target price of $22.8, which implies a 12.4% upside from the current market price. Adding the forward dividend yield gives a total expected return of 16.3%.
In my last report on the company, I adopted a hold rating with a target price of $22.9 per share for December 2022. Since then, the stock price has dipped, leaving a large price upside. In my opinion, the market has overreacted to the outlook of an earnings decline for 2022. Based on the updated total expected return, I’m upgrading Simmons First National Corporation to a buy rating.
Be the first to comment