

Christoph Burgstedt/iStock via Getty Images
Investment Summary
Within our last publication about Silk Road Medical, Inc. (NASDAQ:NASDAQ:SILK) in June, we noted the presence of several macro-pressures that we opined would compress its share price. Alas, both the market and the company have proven us wrong. Since the last SILK note, the stock has rallied 35%. Following the company’s latest set of numbers, we’re back here today to discuss our latest findings, and revise our rating on SILK to a buy.
As a reminder, in our previous note, we surmised that macroeconomic headwinds [rates, inflation, systematic risks] would keep SILK at bay, clamping both corporate and equity value for the company. Whilst we’ve seen that thesis hold true in many other names in our coverage universe, SILK has proven us wrong with its latest revenue clip, demonstrating strong uptake in the company’s novel transcarotid artery revascularization procedure (“TCAR”).
To summarize what’s changed in our investment thesis, we note the following:
- Silk Road Medical’s flagship procedure saw 55% YoY growth in procedural volume [vs. 27% in Q1] generating a 51% YoY gain in revenue.
- Management raised guidance and note the company is on track to grow its trained physician base to 2,400 by FY22.
- Consequently we raised our FY22 revenue estimates with the company and expect more than 19,200 TCAR procedures by the end of this year.
- Outstanding technicals that corroborate upside support to a target range of $61–$68.
Subsequent to the above, we’ve revised our call on SILK to buy and suggest a target range of $61–$68.
Q3 financials: TCAR the standout, driving 51% YoY revenue upside
Zooming in on the numbers, SILK printed revenue and EPS upsides that outpaced consensus estimates. Revenue growth of 51% YoY to $37.4mm was driven by a corresponding 55% YoY gain in TCAR procedural volume.
In total, there were 5,250 TCAR procedures completed in Q3, up from 4,025 procedures in our last report. You might recall the procedure involves 3 products, the ENROUTE transcarotid neuroprotection system, the ENHANCE transcarotid peripheral access kit and the ENROUTE 0.014 guidewire.
SILK is aiming to have 2,400 trained physicians in total able to utilize the procedure by the end of FY22. This means ~300 physicians must be added in FY22, SILK’s current goal. At the run-rate for Q3, this implies each procedure generated an average of $7,123.80.
Management project FY22 revenue of $134–$137mm. Hence, based on these assumptions, our rudimentary calculations estimate each physician must perform 8 procedures to meet this number, at 2,400 trained physicians, totaling 19,231 total procedures [procedure per rep = 8].
Exhibit 1. Estimated procedure per physician from SILK’s FY22 trained physician estimates.
Note: Top of revenue guidance shown. Trained Physician and FY22 Revenue estimates are SILK guidance. All other calculations are HBI internal estimates. (Data: HBI Estimates, SILK SEC Filings)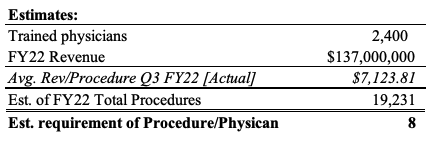
As another footnote to the TCAR narrative, we’d also note the recent FDA label and Medicare coverage expansions to indicate the procedure’s use in standard surgical risk patients. Management estimate this market to be 430,000 patients in the U.S., with 170,000 procedures performed annually – a $3.2Bn market opportunity, it says.
Switching back to the numbers, we saw that gross margin was flat at 75% and it realized OpEx of $37.3mm, up 17% YoY. Of this, $8.5mm was attributed to R&D as the company grows its headcount and invests into its ongoing clinical trial programs.
It’s also worth noting that SILK completed its seasoned equity offering in October at $43/share, adding net $109mm in cash to the balance sheet. Aside from beefing up liquidity, the additional offering of 2.33mm shares adds additional trading liquidity to the stock, seeing as now 98.1% of outstanding shares are owned by institutional investors.
As seen in Exhibit 2, SILK continues along its growth route, booking sequential gains in revenue in just about every quarter since FY19. We’d noted this in our last report, but market positioning had shied away from rewarding top-line growth at the time. With greater certainty about the path of rates, less emphasis on inflation going forward and a clearer macro-landscape, this trend looks to have reversed in SILK’s case.
Exhibit 2. SILK’s sequential revenue growth, FY19–date
Data: HBI, Refinitiv Eikon, Koyfin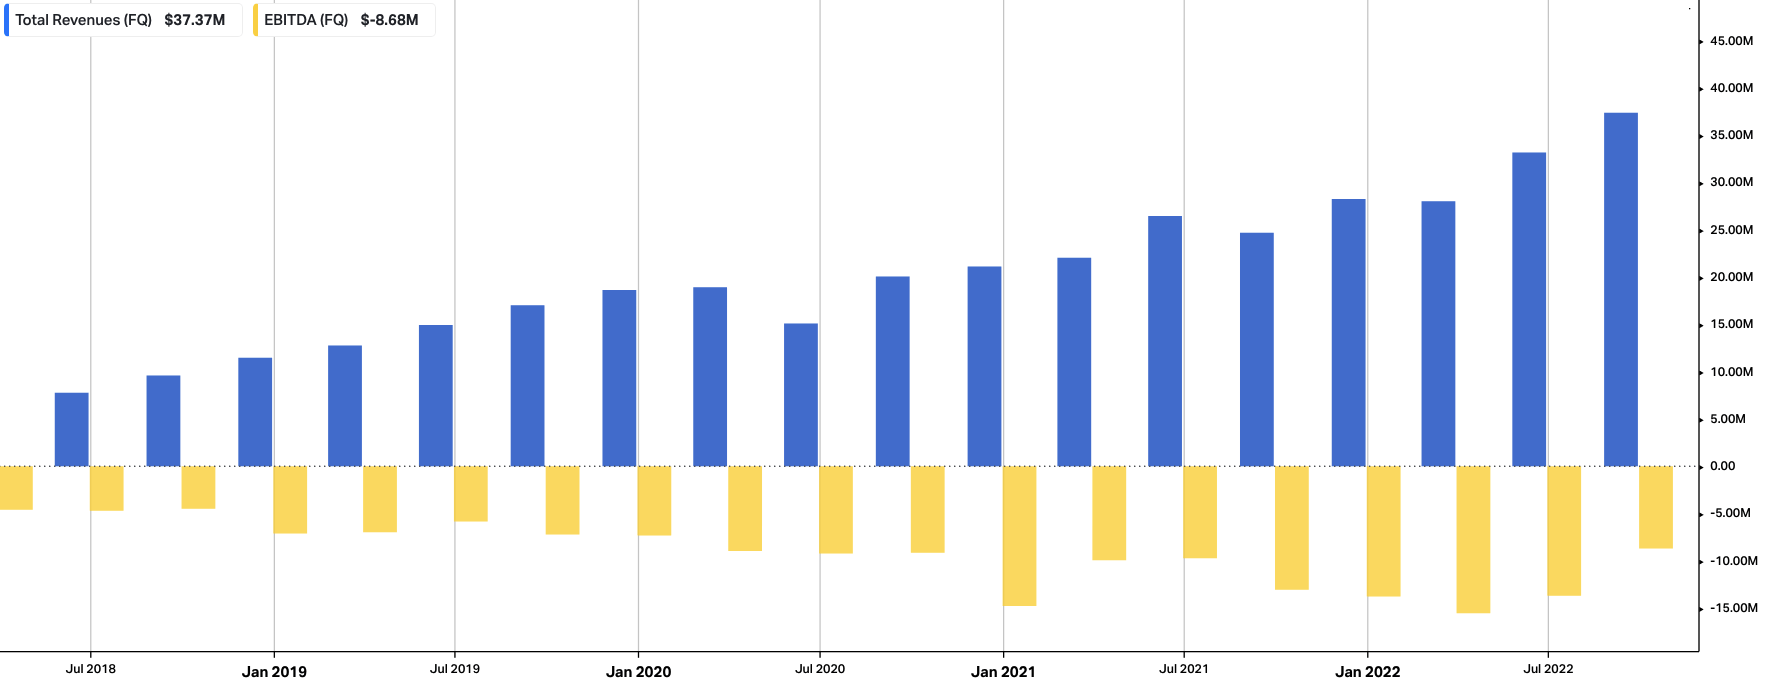
Aside from the above, as mentioned, management raised FY22 revenue guidance to $137mm at the top of range. This calls for 35% growth at the top line for the upper end of guidance, with procedure volumes at over 19,000, in line with our estimates above.
It’s worth highlighting that at >19,000 annual procedures, management says this signifies >11% penetration of the core market. As such, this adds a heavy bullish weight to the risk/reward asymmetry, adding to our buy thesis.
SILK technicals reverting to upside also
Along with the fundamental data above, we also observed that SILK’s technical studies are screaming a buy to us right now. You can see below the stock has broken out above two longer-term, inner and outer resistance lines that’ve been in situ since FY20′ and FY21′, respectively.
After bouncing twice from its 52-week lows, the stock rallied in mid FY22, before forming a base for 10 weeks. On week 11, the stock broke above the resistance line and above its 50DMA. It now trades well above the 250DMA as well.
As it was forming a base and trading sideways, weekly volume was showing tremendous growth, signaling accumulation from institutional investors [recall from above, the stock is c.98% owned by funds’ and institutions].
The sideways price action with ascending volume is evidence of strong support in our opinion. We entered 3 weeks ago, when the stock closed at the breakout above the 50DMA.
Exhibit 3. SILK 24-month price action [weekly bars, log scale] now heavily bullish, trading back above 50DMA and breakout above previous high
Data: Updata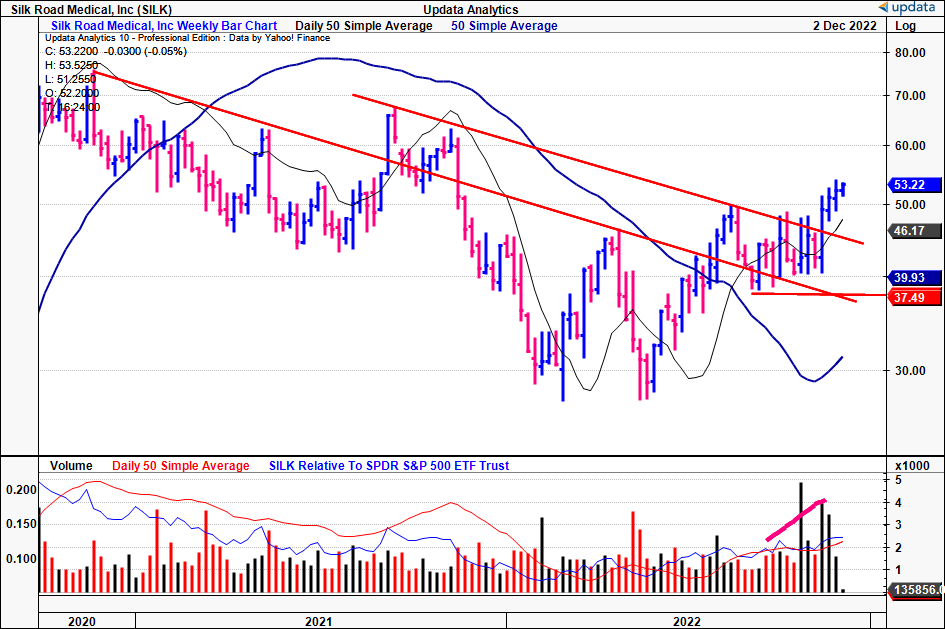
Moreover, on the 6-month daily cloud chart, shares are trading well above the cloud, along with the lag line. The cloud itself is bullish and widening in area. Meanwhile, on balance volume (“OBV”) has curled up substantially since October, along with momentum studies, adding validity to the strength and direction of the move.
With shares trading above the cloud, and OBV and momentum in pursuit, this is a bullish setup in our estimation.
Exhibit 4. Trading above cloud support, with underlying momentum from OBV
Data: Updata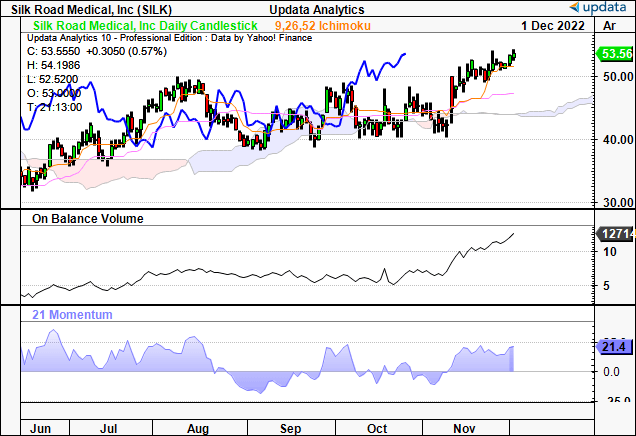
As a result, we now see upside targets pushing to $61.5 [point and figure chart below], and in the absence of earnings at this stage we’re basing our price objective off of these objective measures. On the weekly [long-term] chart, we have targets to $68. You can see the below targets have served us well to date and helped guide our decision making on the stock.
Hence, we have price objectives of $61 then $68 in this name, before re-evaluating the position, whether to add or cover at that time.
Exhibit 5. Upside targets to $61.5, and $68 [not shown].
Data: Updata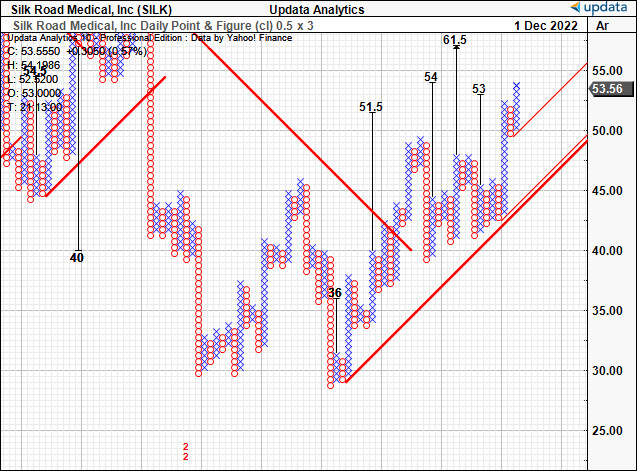
Conclusion
We’ve revised our position on Silk Road Medical, Inc to a buy. Given the reasons outlined in this analysis, we believe there is upside support to a target range of $61–$68. For reference, our last target on SILK was $40. To understand what’s changed with the thesis, we suggest you read the “Investment Summary” section located at the start of the report.
Be the first to comment