


MaFelipe/iStock via Getty Images
Bottom fishing provides big rewards with little downside risk, provided you know your fundamentals and know how to pick the winners like Netflix (NASDAQ:NFLX) which is close to doubling after hitting bottom. Some stocks that dive to the bottom, will never come back up or will take years to do so. There is nothing wrong with the NFLX business other than more competition and slower growth. In fact, during recessions, people are still willing to spend on cheap entertainment. We saw that with movies during the Great Depression. They will cut many other expenses during a recession, but not cheap entertainment.
There is no question that Netflix is “best of breed” and the stock you want to own if you want to be in the home entertainment business. It is also true that the boom days of growth are over and competition is eating away at Netflix. These are reasons for its fall from $701 to the $163 bottom, but was the selling over done? Let’s look at the fundamentals.
Seeking Alpha, SA, provides you with all the articles and fundamentals that will help you to do your bottom fishing. The first thing I do is to search the NFLX symbol on SA and I start reading articles chock full of fundamental data. My own SID computer system has already analyzed the fundamentals and technicals, suggesting to me that I should bottom fish NFLX. Now I am using all the articles and fundamental data on SA to do my due diligence. I will use technicals to do the timing of my buy.
The SA quant system gives NFLX an “A” rating in growth, profitability, momentum. However, it has a “D” rating in valuation and that is one of the big reasons NFLX took a $535 dive in price. After a drop like that, you would think NFLX would finally be a bargain. Let’s use the SA Valuation tab to check out the valuation challenges for NFLX.
The non-GAAP, forward P/E is ~29 compared to ~15 for the sector median, so you can see how overvalued NFLX is. Interestingly if you use the sector median to value NFLX, you approach the low price that NFLX reached down to when it dropped to its bottom. Price has recovered and almost doubled from the bottom price it hit going down. So at this rich P/E of 29, it is overvalued once again.
Maybe we have to wait for retest of the bottom to catch the bargain again. Typically, with a bounce like this, the bottom fishers stop buying until it becomes a bargain again. That’s what helps to create the classical double bottom in a stock like NFLX. If the market (SPY) drops from $400 to $300 in 2023 as some expect, it will take NFLX down with it. Forward Price to Sales at 4.31 is also overvalued compared to the Sector Median of only 1.25.
Let’s turn to SA’s revenues and earnings data to do some more of our due diligence on NFLX being a bottom fishing bargain. Revenues are projected to grow 3% this year and 7.2% next year and 11.4% the year after. That’s very little growth for a very high P/E stock. That tells us to value NFLX at 20 times next year’s earnings of $10.67 giving us a $213 valuation. It is currently trading at $317, so you can see how overvalued we think it is. Using a forward P/E of 20 is really generous for a stock that is only growing 11%.
Earnings per share are projected this year at $10.36 and next year at $10.67. However, in 2024, projected earnings jump to $13.57. Apparently the market is looking over the valley of next year’s earnings and valuing NFLX based on 2024 earnings which gives us a forward P/E of 22, which is still too high relative to growth. If 2024 earnings are already priced in, why buy at these prices? Waiting for a retest of the bottom makes a lot more sense, especially in a bear market.
Here is our weekly chart showing the bottom fishing bounce for NFLX. We think that the bottom fishers are done until it revisits the bottom again. We will keep it on our bottom fishing list and buy on a retest of the bottom at $213 or below. We think this move up in price from $163 to $313 is simply the middle point of the “W” bottom formation. Overvalued fundamentals seem to confirm our technical thesis for waiting to bottom fish NFLX.
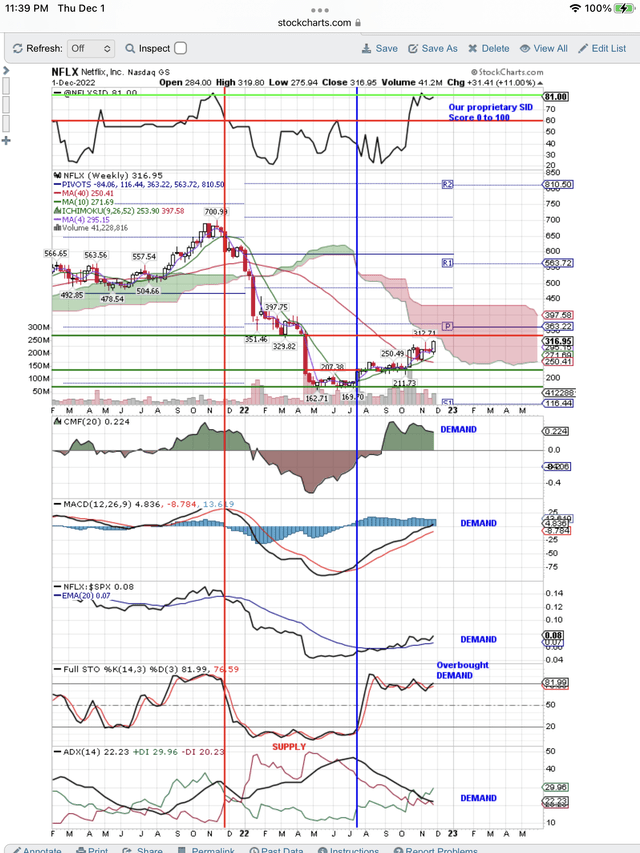
Demand Drives NFLX Bottom Bounce (StockCharts.com)
On the above chart you can see all the Demand indicators taking price higher. You can see our red, vertical line, Sell signal and our blue line Buy signal. You can see price approaching a pink cloud of resistance. You can also see the horizontal, price resistance line at $330. We expect this resistance to stop the price move up and trigger our red, vertical line, Sell signal. Then we look for a retest of the bottom.
Be the first to comment