

IvelinRadkov
Introduction
At the outset of every year and usually after mid-year, I lay out both short- and long-term forecasts. Because of the distortions introduced by the spike in the price of gas during spring, I held off updating this summer.
But, having gone on “Recession Watch” this past spring due to the downturn in the long leading indicators, with gas prices now less volatile, and with some important deterioration in the short leading indicators, it is time to update this short term forecast to a “Recession Warning,” as per my “Weekly Indicators” update this past weekend.
This post deals with the forecast into next May.
My method of short-term forecasting is pretty simple – in fact, so simple, I call it the K.I.S.S. method. Even though the Index of Leading Indicators is the statistic most denigrated by Wall Street forecasters, it has the inconvenient habit of being right more often than the highly-paid punditocracy, especially at turning points. Since I’m not a highly-paid Wall Street pundit, I simply rely upon the LEI for the short term and several methods of looking at long leading indicators for the longer term.
The K.I.S.S. approach to short-term forecasting
The K.I.S.S. approach is in contrast to most of what you will read. Unfortunately, the direct link to Caroline Baum’s article is now dead, but Professor Mark Thoma’s discussion of it remains. To wit, research has shown that what most forecasters do is simply extrapolate current trends into the future. Thus, they completely miss turning points. This is why you can be months into a recession – or recovery – with most commentators still unaware of the turn.
A quick look back at my last short term forecast
When I last looked at the short leading indicators back in January, I concluded that:
“[A]lthough [long leading indicators last summer showed that] softening seem[s] likely[, t]he short leading indicators now confirm the positive trend through the first half of this year, with very little evidence of softening at this point.”
As we all already know, real GDP growth measured quarter-over-quarter (blue below) was actually slightly negative both in Q1 and Q2, although its mirror image, GDI (red), remained positive:
Real GDP vs. Real GDI (FRED)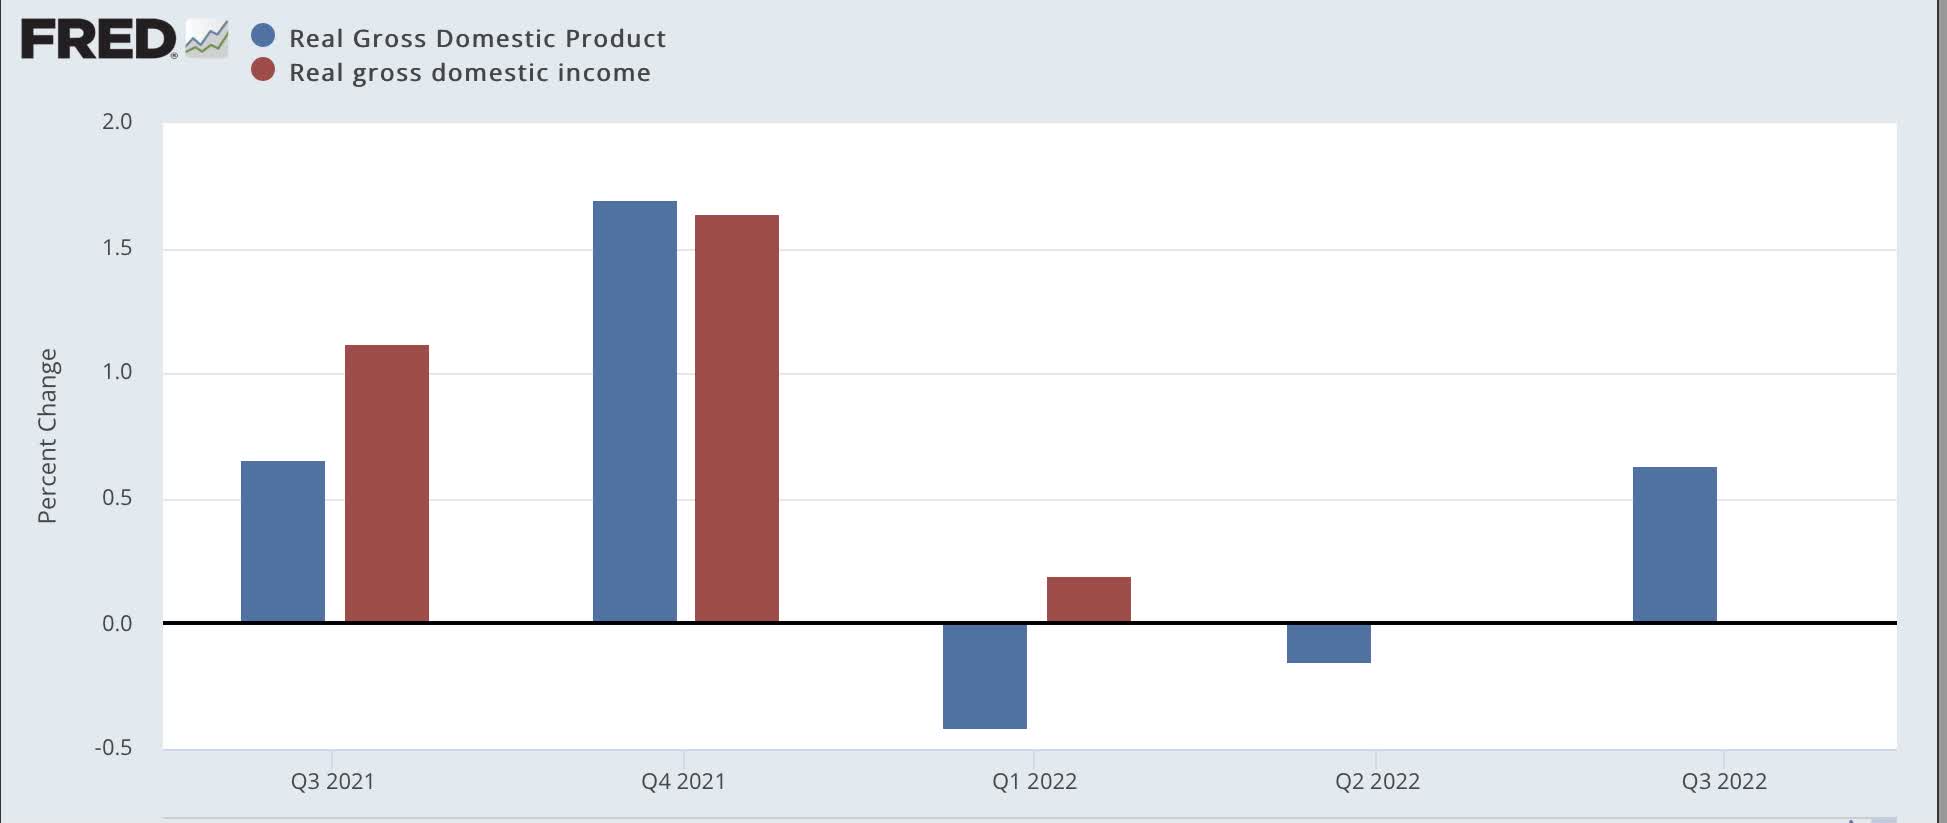
But the 2 most important of the 4 main coincident indicators relied upon by the NBER in determining if a recession has begun did remain positive (production and payrolls), while real income less transfer receipts had a brief, small downturn, and real sales a bigger one with a bigger rebound:
Coincident indicators (FRED)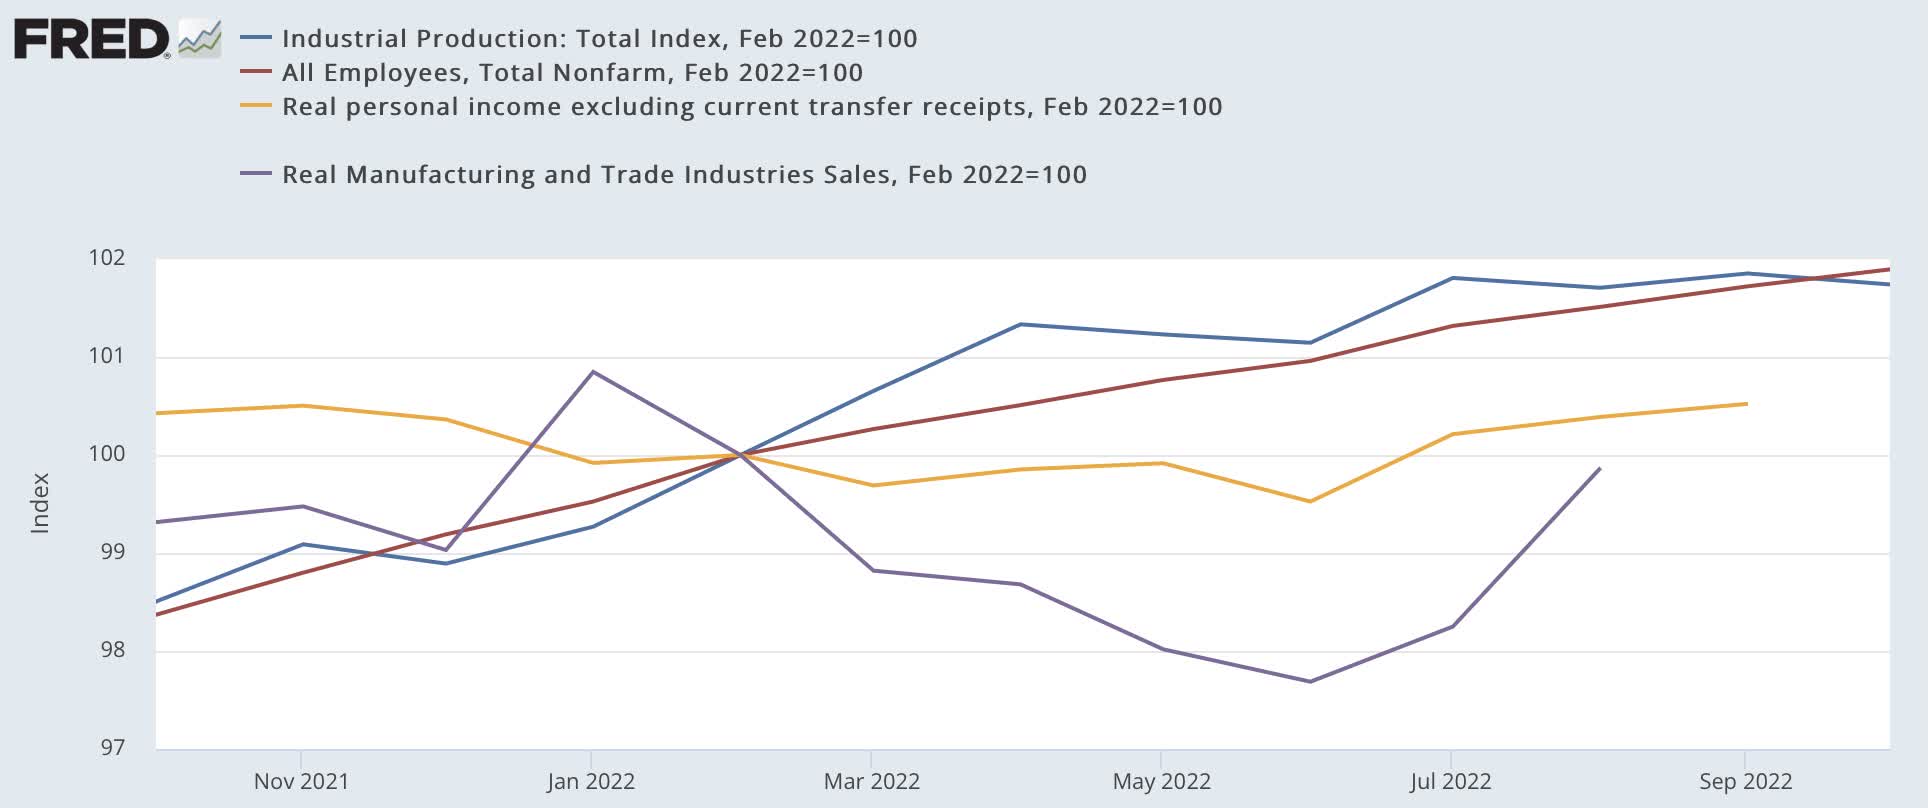
In other words, the softening that showed up in the long range forecast last summer finally showed up, but only after the start of the year – and not severe enough to constitute an actual recession – while the short term forecast for H2 2021, using the very same tools as I will here, was a little optimistic.
The short-term forecast into spring 2023
What was the long term when I went on “Recession Watch” last spring, is now the short term.
Eight of the 10 components of the Index of Leading Economic Indicator are negative
To cut to the chase, here’s what the Conference Board’s Index of Leading Indicators looks like through October, via Advisor Perspectives, measured as % decline from peaks:
Index of Leading Indicators from peak (Advisor Perspectives)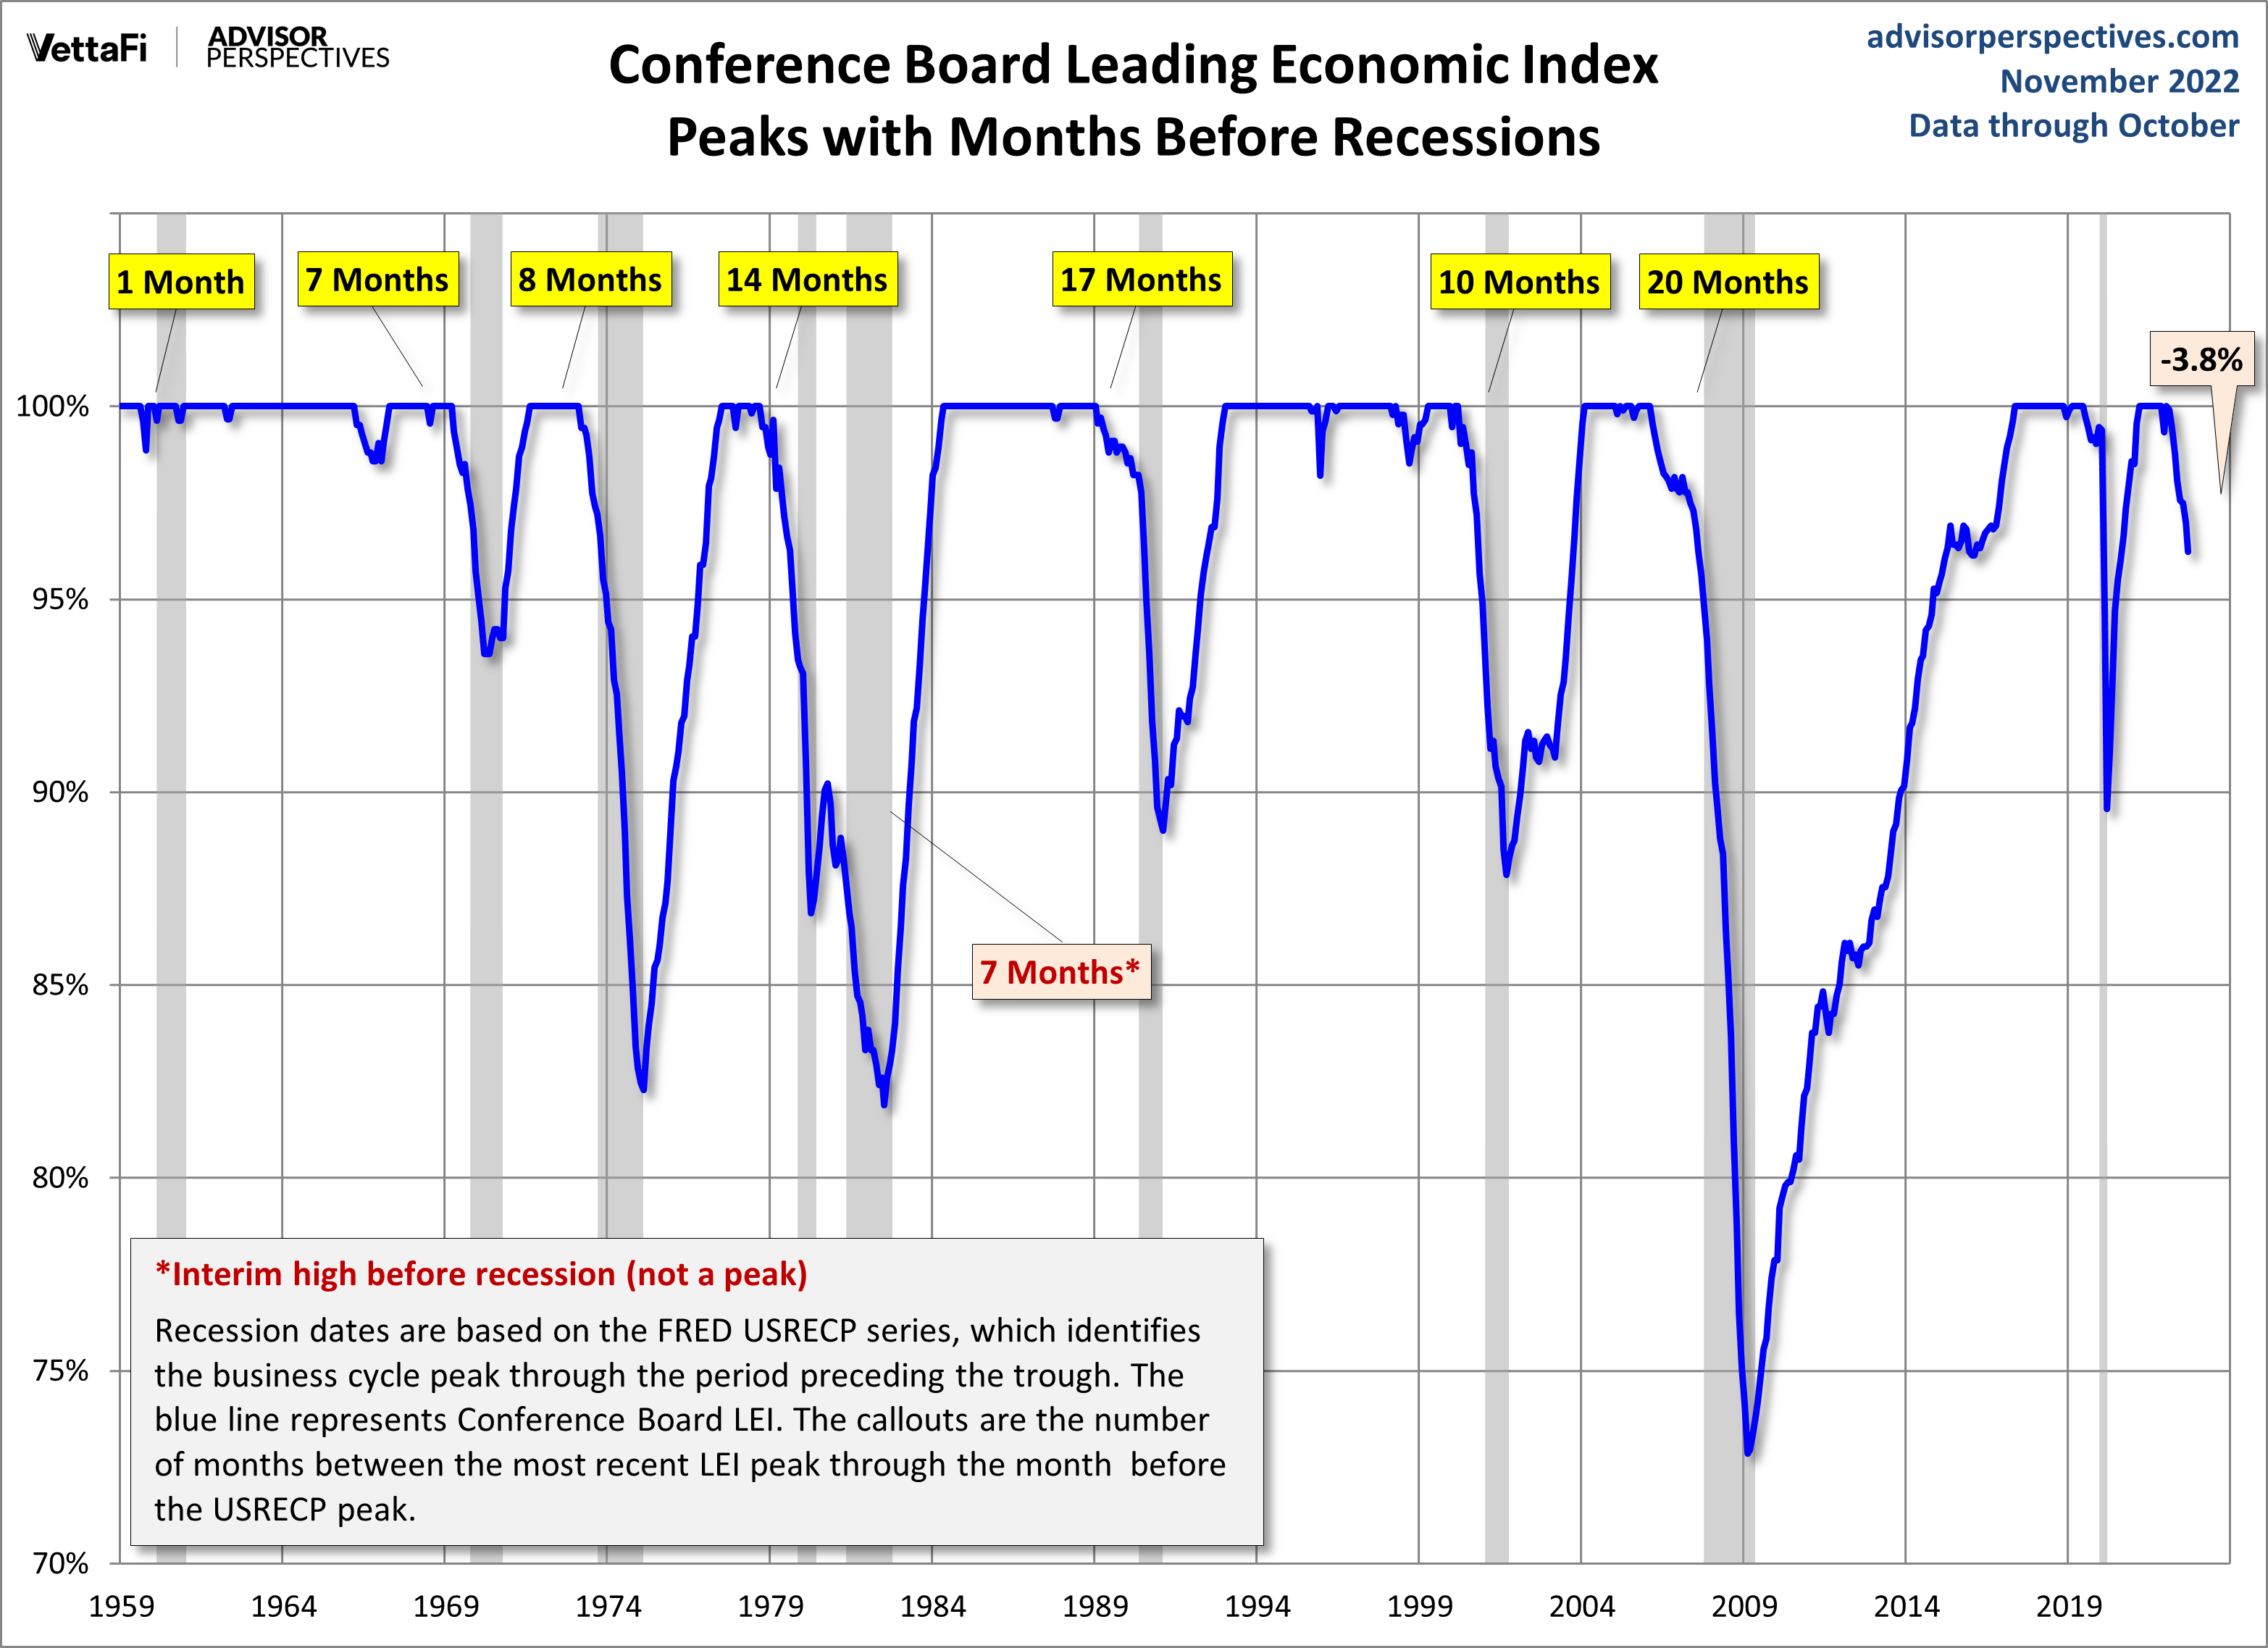
As the Conference Board itself pointed out, the Index has declined for 8 straight months. Almost all recessions have begun by the time the Index is -5% below peak, not much more than its current -3.6% decline.
Importantly, typically in the past, no recession has started unless 8 or more out of the 10 indicators had declined over the past 6 months. As of the past week, 8 of the 10 now meet that criteria: manufacturing hours, jobless claims (which, while near all-time lows, are still higher than last April and May), the ISM new orders index, housing permits, the S&P 500, the leading credit index, consumer expectations, and the 10 year Treasury minus Fed funds spread.
Here are manufacturing hours, jobless claims, and the S&P 500, all normed to 100 as of April:
Short leading indicators (FRED)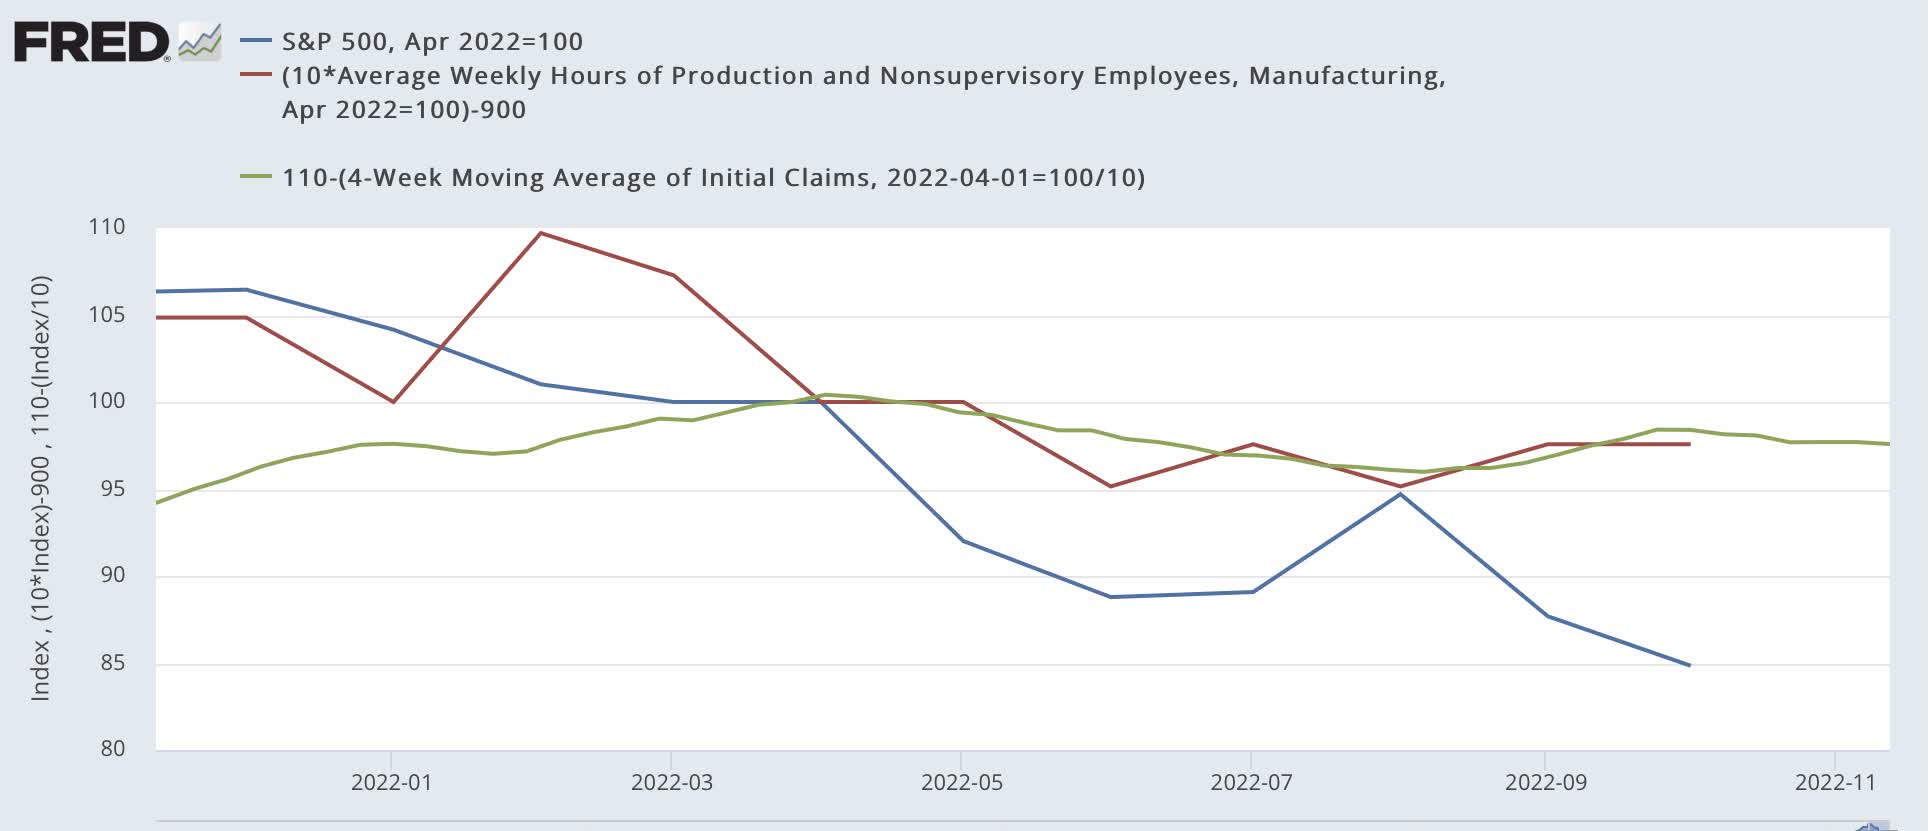
Here is the ISM manufacturing new orders index:
ISM manufacturing new orders (ISM via Briefing.com)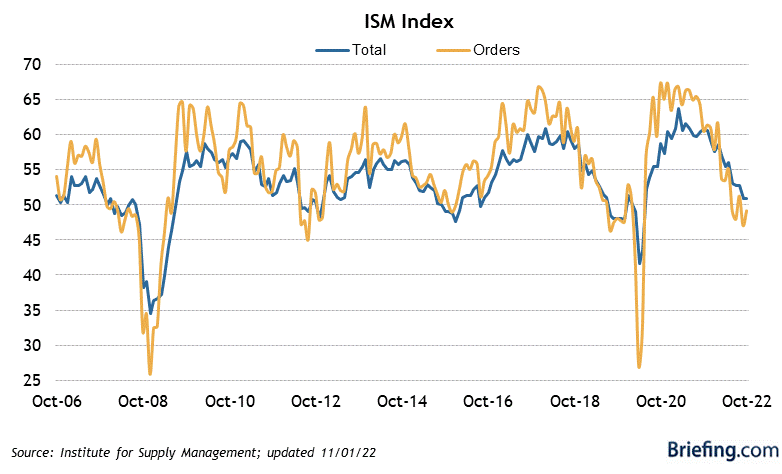
Here are consumer expectations from the University of Michigan:
U Michigan consumer sentiment (Briefing.com)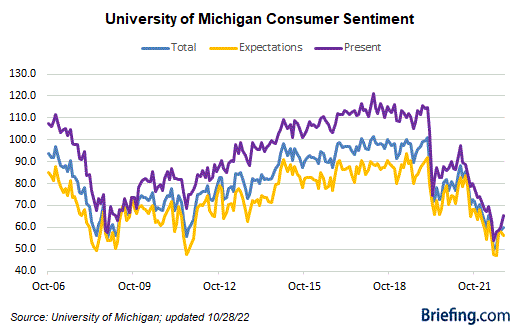
Here is the Conference Board’s Lending Index:
Lending Credit Index (Conference Board via Investing.com)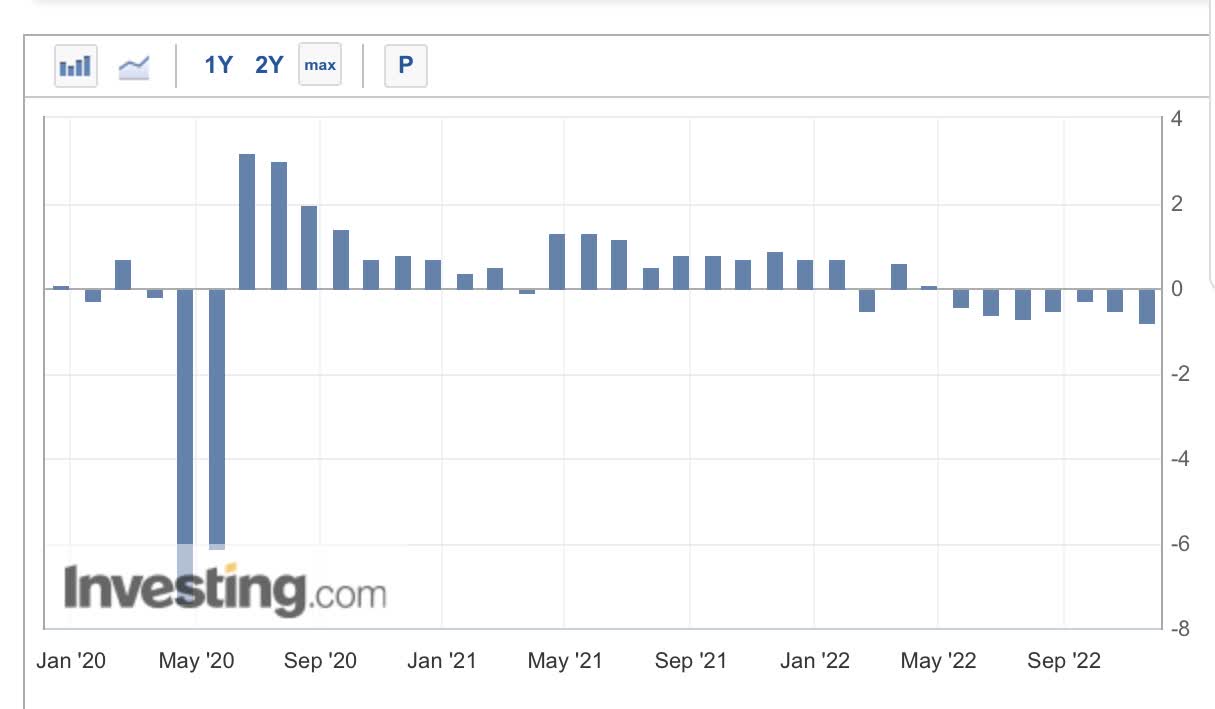
Two of the 10 items in the Index are actually long leading indicators. Housing permits turned down long ago, but the 1o year Treasury vs. Fed Funds rate just turned negative earlier this month, although it has been deteriorating for months:
Housing permits and 10 year minus Fed Funds spread (FRED)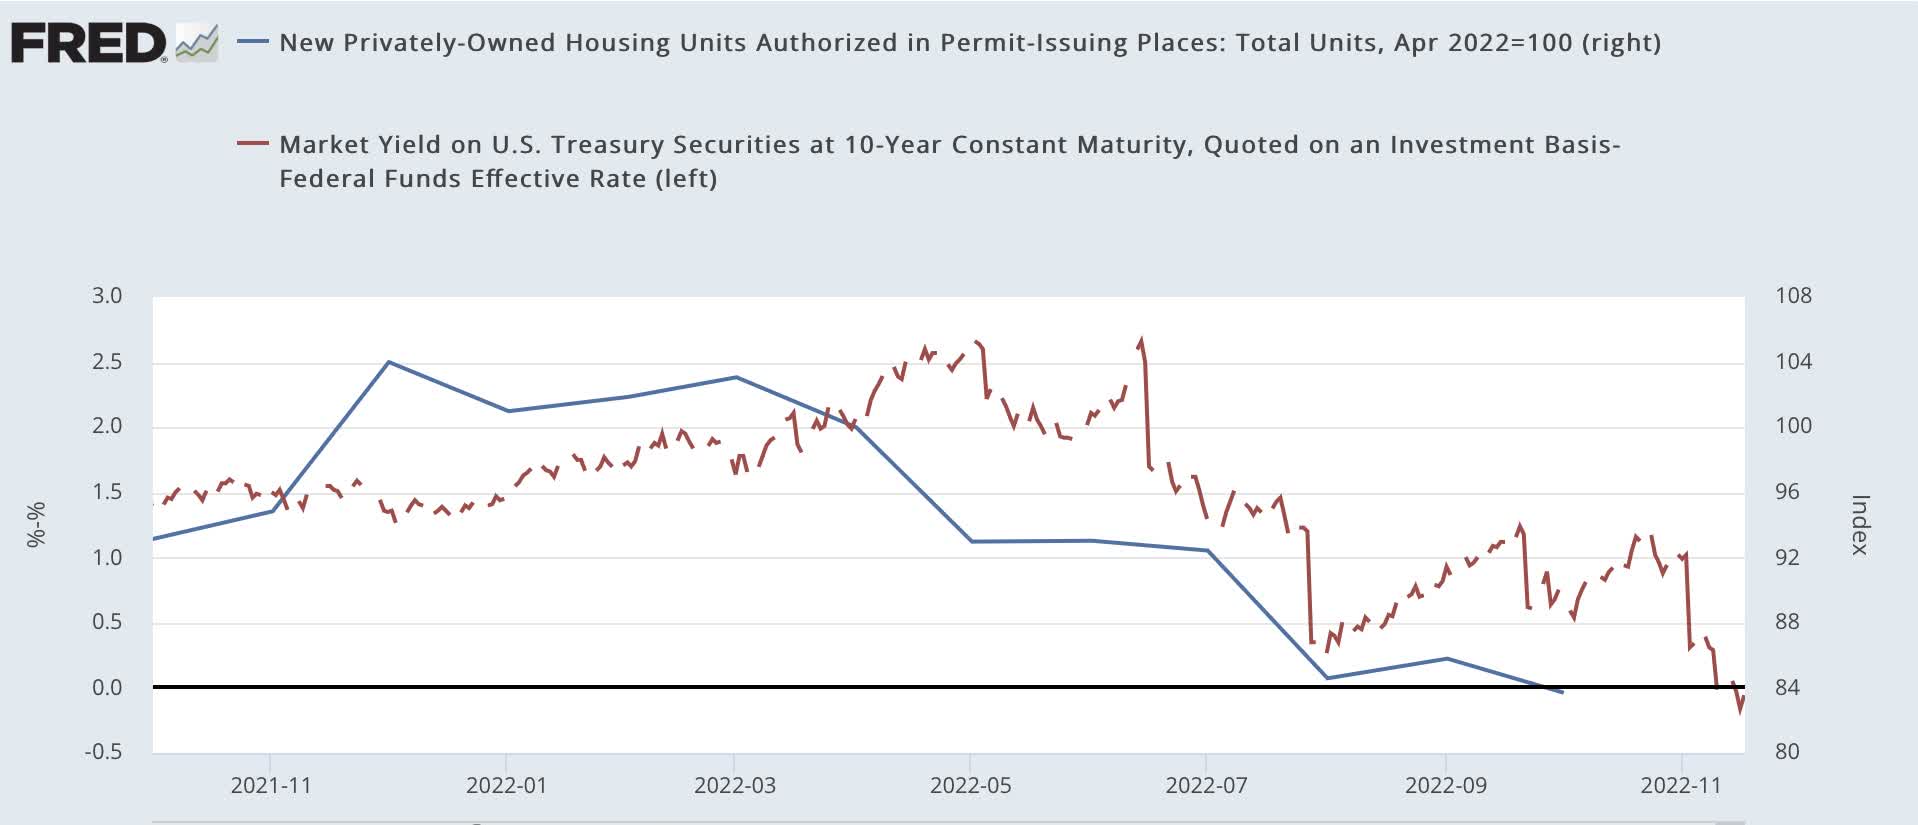
Only the remaining 2 items on the Index are positive: new orders for consumer goods and new factory orders (“core” capital goods orders also shown):
Factory and durable goods orders (FRED)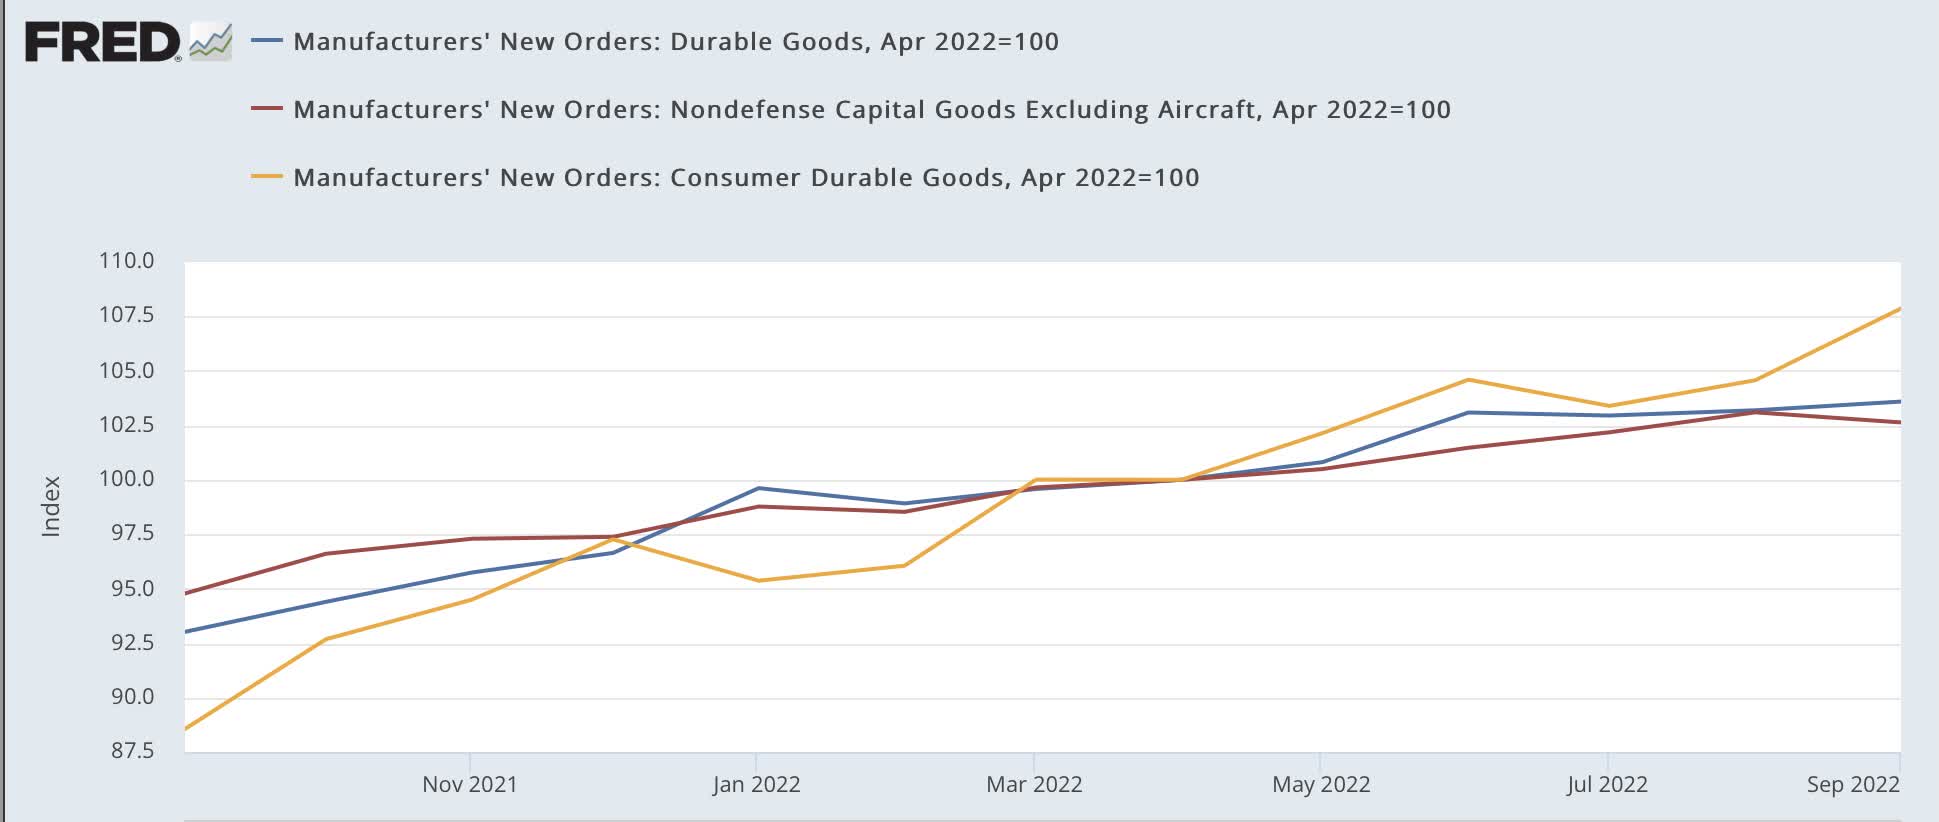
In summary, the threshold criteria for the onset of a typical recession: that 8 of the 10 items on the Index of Leading Indicators having deteriorated for the past 6 months, has now been met.
Prof. Geoffrey Moore’s historic short leading indicators
In addition a to the above similarly in his 1993 tome, Prof. Geoffrey Moore listed a series of 11 short leading indicators, namely: The S&P 500 stock price index, Average workweek in manufacturing, Layoff rate under five weeks, initial claims for unemployment insurance, ISM manufacturing vendor performance, ISM manufacturing inventory change, Journal of Commerce change in commodity prices, change in deflated nonfinancial debt, new orders for consumer goods and materials, Dun & Bradstreet change in business population, Contracts and orders for plant and equipment.
Many of the above have survived to remain part of the Leading Economic Index as it is now constituted and are discussed above. Aside from the Dun & Bradstreet data, all of the rest of the series are publicly available. Here is a graph of unemployment under 5 weeks, commodity prices as reflected in the PPI, and the change in nonfinancial business debt:
Short leading indicators (Prof. G. Moore) (FRED)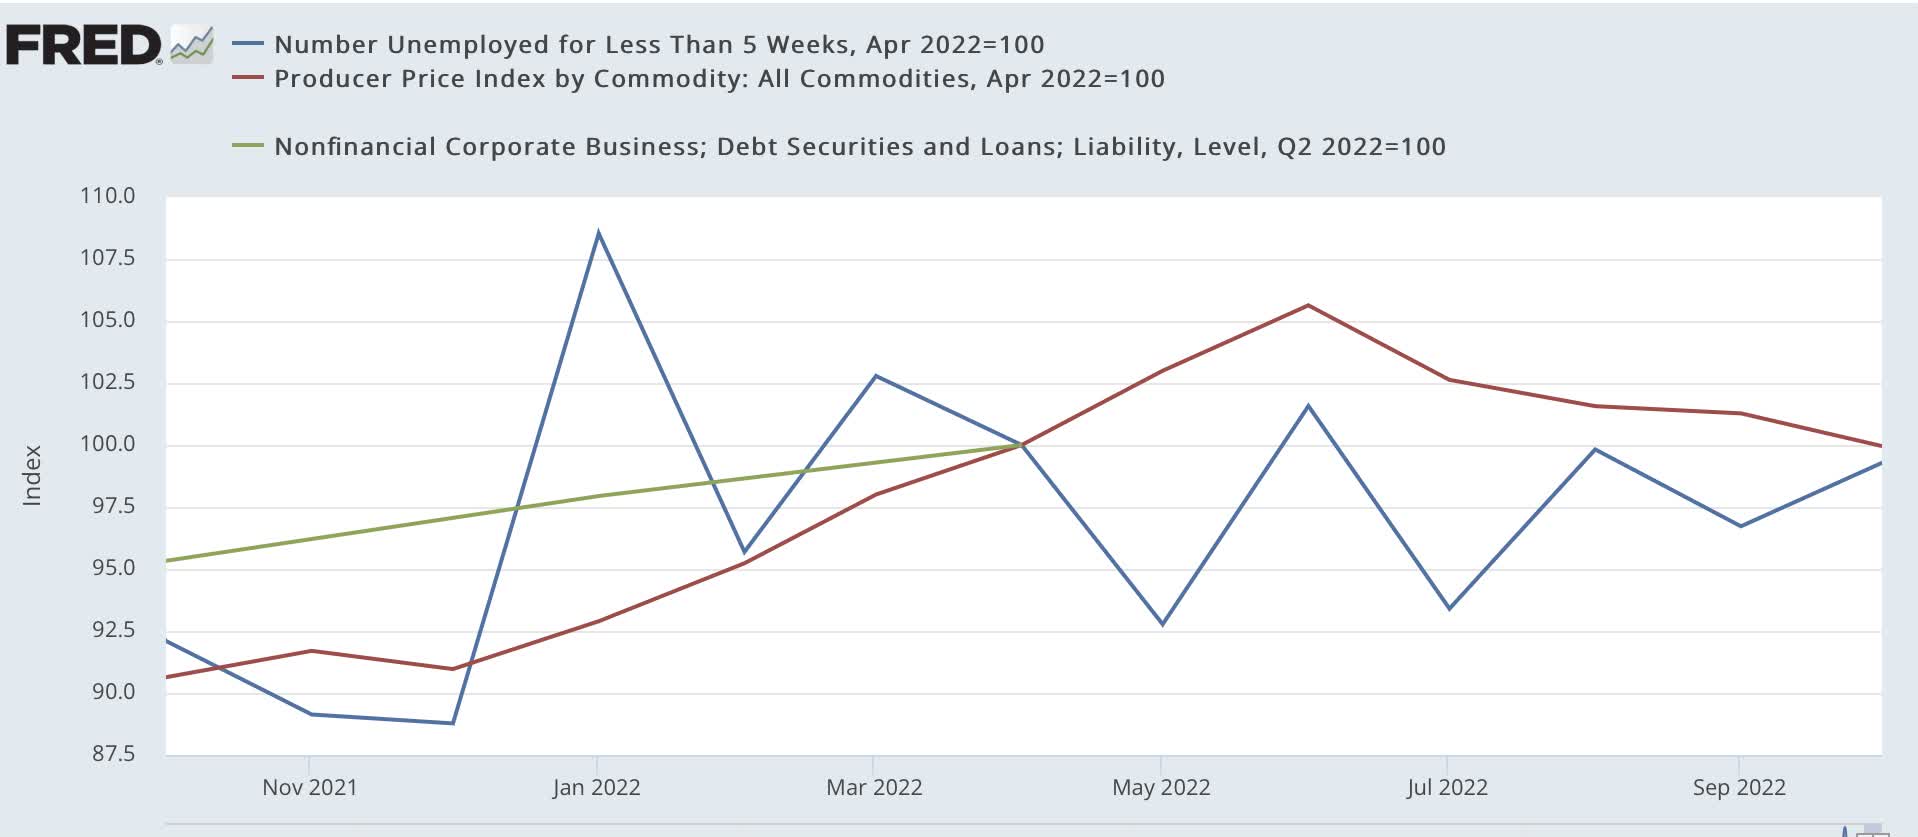
Here is the ISM vendor performance index, which has declined to a contraction are reading:
ISM vendor performance (Briefing.com)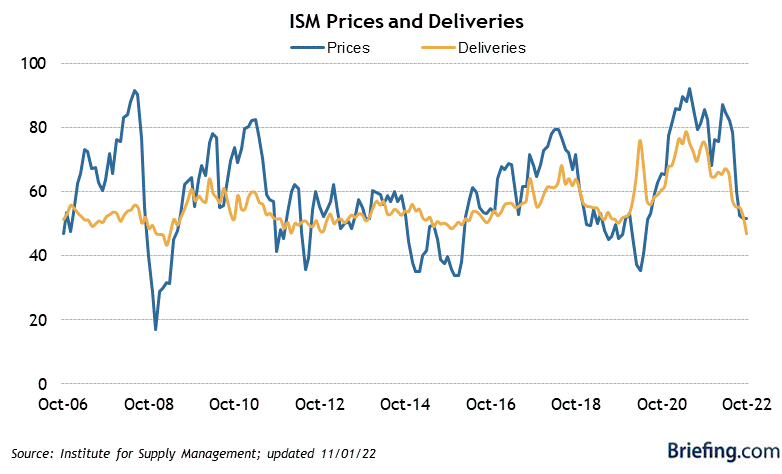
And here is the ISM inventory index, which although still positive, is the weakest for all but one month in the past year:
ISM manufacturing inventories (ISM via YCharts)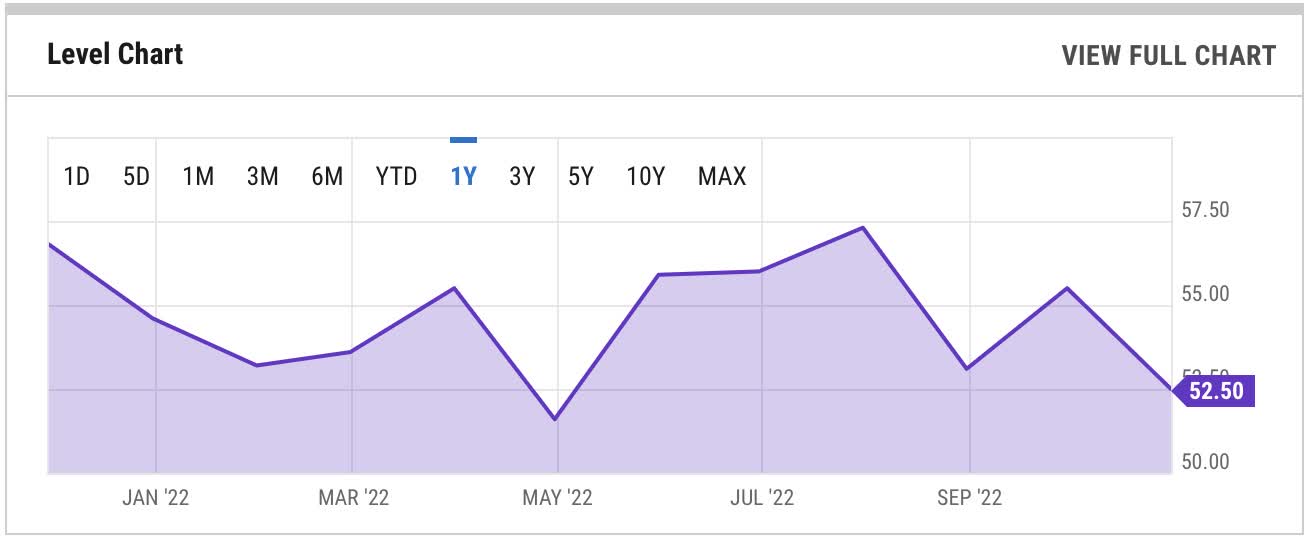
Both ISM indexes as well as short term unemployment have weakened. Commodity prices surged in the spring, but have weakened again since June. And nonfinancial debt has yet to be reported for Q3.
In short, the overwhelming weight of the evidence of the short leading indicators is deterioration and decline.
Finally, let me note that the outstandingly positive coincident indicator has been employment. But consumption leads employment, and several measures of consumption are flat (real retail sales) or nearly flat (Redbook consumer spending adjusted by inflation). Further, tax withholding has weakened significantly since mid-year, to a point consistent with employment reports that were less than +100,000, or even negative in the past 20+ years. And the trend in employment reports themselves has been deceleration.
Conclusion
Last January the long leading indicators suggested that the expansion would all but stall out, but not quite fall into recession by the end of this year. By springtime, they were consistent with an oncoming recession by or in 2023. Now the short leading indicators are amplifying that downtrend, strongly suggesting that a recession is likely and will begin sometime in the next 6 months.
Be the first to comment