

Justin Sullivan/Getty Images News
Home Depot (NYSE:HD) is an American home improvement retailer selling hardware, construction products, and various services. It is also the largest home improvement retailer based out of the US. This retailer performs relatively well during downtimes like recessions or pandemics. Based on this article, this stock should perform relatively well, as shown in the forward-looking guidance.
Fundamental Subtle Strength
Growth
Revenue growth has been relatively steady and has nearly doubled since 2018. Moreover, net income growth has drastically improved between 2021 and 2022. This appears to be due to the worst of the pandemic near an end as economies open with more commercial and residential renovations underway.
|
Metric |
2018 |
2019 |
2020 |
2021 |
2022 |
|
Period |
FY |
FY |
FY |
FY |
FY |
|
Revenue growth |
0.067 |
0.072 |
0.019 |
0.199 |
0.144 |
|
Gross profit growth |
0.063 |
0.082 |
0.011 |
0.194 |
0.133 |
|
Ebit growth |
0.093 |
0.058 |
0.020 |
0.154 |
0.261 |
|
Operating income growth |
0.093 |
0.058 |
0.020 |
0.154 |
0.261 |
|
Net income growth |
0.085 |
0.289 |
0.011 |
0.144 |
0.277 |
Source: Financial Modelling Prep
Data
According to its simple moving average, Home Depot’s stock price has remained positive over the last 200 working days. However, over the previous 20 working days, there has been new momentum in the stock price of Home Depot.
Home Depot is rated relatively strong for the retail sector and the general top 500 stocks in the USA compared to other industry sectors. As many companies have shown declines, Home Depot should be considered part of your portfolio based on this year’s simple moving average.
|
Metric |
Values |
|
SMA20 |
7.96% |
|
SMA50 |
10.28% |
|
SMA200 |
4.28% |
Source: FinViz
Source: Market Watch
Enterprise
The stock price for Home Depot appears to have accelerated since 2020, when the pandemic started. This may be due to people renovating their homes over that time. Market capitalization has also accelerated and seems to continue this year. One exciting fundamental metric is how Home Depot could build new stock price momentum as the economy might improve next year. One major factor that could help boost Home Depot’s stock price for 2023 is expected falling inflation.
|
Metric |
2018 |
2019 |
2020 |
2021 |
2022 |
|
Symbol |
HD |
HD |
HD |
HD |
HD |
|
Stock price |
184.980 |
184 |
227.940 |
260.290 |
320.250 |
|
Number of shares |
1.178 B |
1.137 B |
1.093 B |
1.074 B |
1.074 B |
|
Market capitalization |
217.906 B |
209.208 B |
249.138 B |
279.551 B |
343.949 B |
|
Enterprise value |
241.339 B |
236.632 B |
279.316 B |
309.722 B |
387.875 B |
Source: Financial Modelling Prep
Estimate
There is an apparent conservative growth estimate in terms of revenue for Home Depot, while profit will likely stay consistent. As a result, earnings per share could grow 50%, hopefully boosting Home Depot’s stock price significantly over the next six years. Another fundamental metric that could help drive the stock price is the company’s future EBITDA estimates.
|
YEARLY ESTIMATES |
2022 |
2023 |
2024 |
2025 |
2026 |
2027 |
|
Revenue |
150,031 |
156,847 |
159,220 |
163,504 |
171,260 |
174,193 |
|
Dividend |
6.20 |
– |
7.39 |
8.52 |
9.41 |
9.60 |
|
Dividend Yield (in %) |
1.99 % |
2.20 % |
2.37 % |
2.73 % |
3.02 % |
3.08 % |
|
EPS |
15.49 |
16.60 |
17.09 |
18.09 |
19.94 |
22.57 |
|
P/E Ratio |
20.14 |
18.78 |
18.25 |
17.24 |
15.64 |
13.82 |
|
EBIT |
22,955 |
24,087 |
24,260 |
25,019 |
26,625 |
28,728 |
|
EBITDA |
25,665 |
26,793 |
26,949 |
27,931 |
29,953 |
30,136 |
|
Net Profit |
– |
17,007 |
17,079 |
17,646 |
18,776 |
21,052 |
|
Net Profit Adjusted |
16,446 |
17,018 |
16,834 |
17,158 |
19,223 |
19,436 |
Source: BusinessInsider
Technical Analysis Shows Optimal Time for Entries
Fibonacci
A similar pattern can be said for Home Depot, with its past trend line with the historical peak in the fall of 2020 followed by a steep decline in stock price. The key to long-term longevity will be how long Home Depot’s stock price can recover. Market Estimate expectations would be that stock price momentum will need to be shown for this to happen.
fibanacci home depot (custom platform)
Bollinger Bonds
Home Depot stock price momentum may be underway, as shown in the simple moving average of the last 20 working days. Also, one can confirm this with the Bollinger upper band being crossed by the current stock price.
bollinger home depot (customer platform`)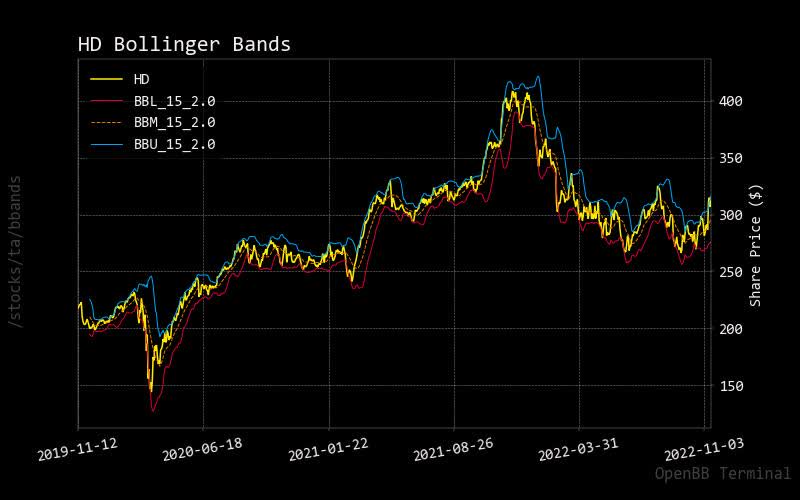
MACD
Based on the MACD signal line crossing through the zero line in the lower panel of this chart, one can take away that it might be an optimal time to initiate market order entries of Home Depot. If price momentum continues to accelerate, I think one can make quick returns in a short period.
macd home depot (custom platform)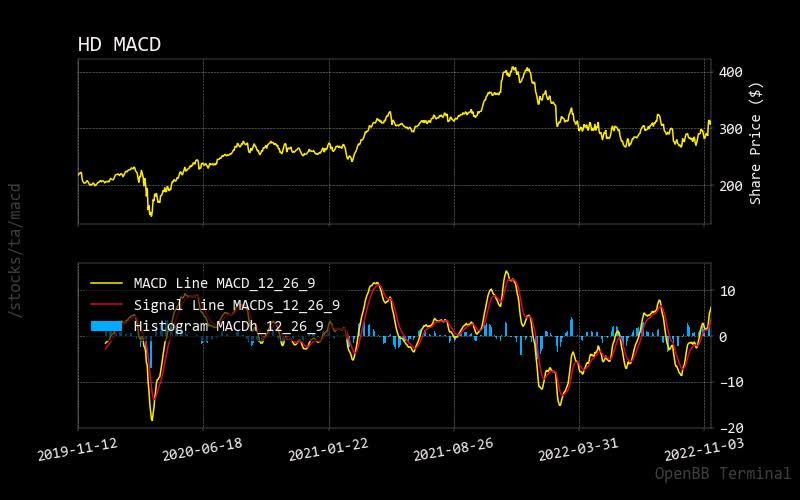
RSI
As the current RSI continues to build towards the overbought market condition, one can see that this will be short-lived, as with the same events in the prior two years. For price momentum to build, it will need to be correlated with the performance of the overall major market indices.
rsi home depot (custom platform)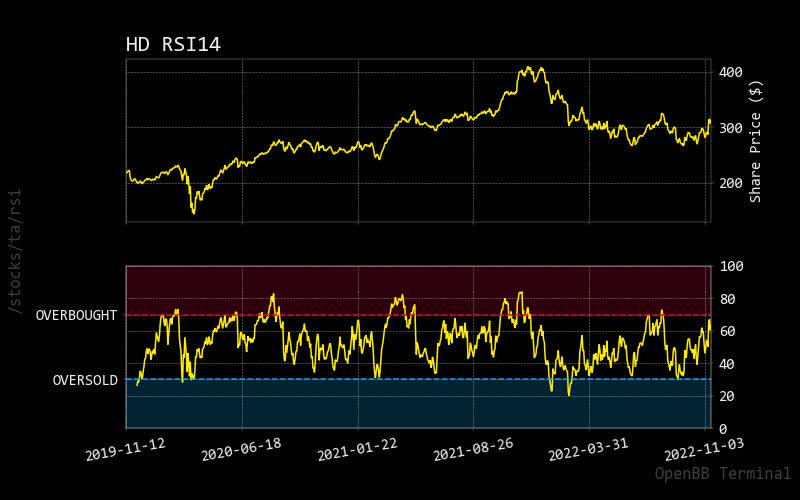
Prediction via AI
Monte Carlo
Using artificial intelligence, one can see that in this Monte Carlo simulation with near even split between the predicted paths of upward and downward potential, the current Home Depot stock price could be short-lived.
On the other hand, the accompanying normalized distribution chart appears to be evenly split, which could confirm this theory of the current stock price accumulation.
monte carlo home depot (custom platform)
Regression
The 30-day forecasted red regression line is moderated, meaning the Home Depot stock price may increase slower than one might think.
regression home depot (custom platform)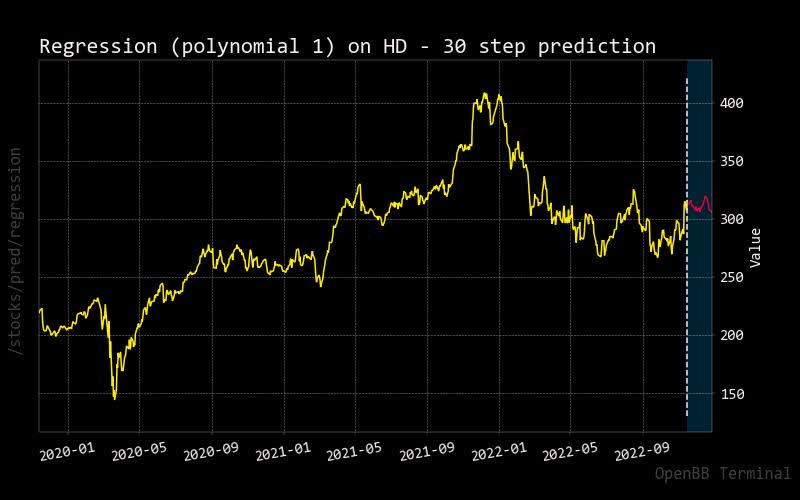
Price vs. Short Volume
As Home Depot’s stock price grows, the short trading volume drops against all total trading volume. This could be considered an encouraging sign as fewer people appear to be worried about stock performance.
short home depot (custom platform)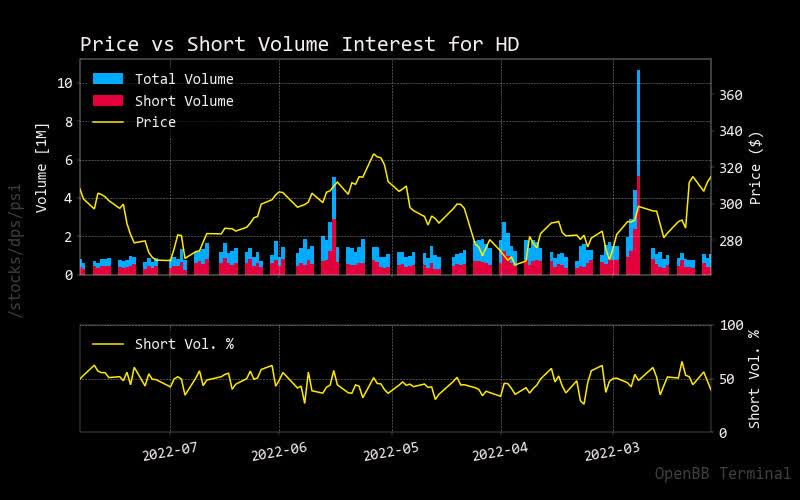
Source: StockGrid
Sell or Buy Risk?
Recommendation
Considering market analysts are calling out a sell rating with the recent daily neutral rating, this quickly turned to buy rating recommendations as the stock price of Home Depot accelerated.
|
Interval |
RECOMMENDATION |
BUY |
SELL |
NEUTRAL |
|
One month |
SELL |
2 |
14 |
10 |
|
One week |
SELL |
5 |
11 |
10 |
|
One day |
NEUTRAL |
9 |
7 |
10 |
Source: Trading View
Sustainability
Home Depot’s sustainability has been underperforming, which could potentially threaten those pension fund activists in the coming years.
|
Metric |
Value |
|
Social score |
5.51 |
|
Peer count |
54 |
|
Governance score |
3.63 |
|
Total esg |
12.54 |
|
Highest controversy |
2 |
|
ESG performance |
UNDER_PERF |
|
Percentile |
5.49 |
|
Peer group |
Retailing |
|
Small arms |
False |
|
Environment score |
3.4 |
Source: Yahoo Finance
Conclusion
Home Depot could be an exciting stock to own over the next few years. It is possible to see steady price upswings. As the stock price accelerates, it hints at a moderated incline with outperforming returns. As a looming recession will be upon us, Home Depot may be a big retailer as folks travel less and spend more on their homes based on what they can afford. As a result, it might be wise to buy the stock of Home Depot for moderate successful profit long term.
Be the first to comment