

U.S. DOLLAR ANALYSIS
- 568K ADP print favors further dollar gains.
- Higher yields giving impetus to further dollar upside.
- Focus shifts to Friday’s NFP data.
DOLLAR FUNDAMENTAL BACKDROP
ADP SURPASSES EXPECTATIONS
The ADP employment change data for September hit 568K, significantly exceeding forecasts. Leading up to the ADP announcement, the U.S. dollar index lessened slightly as markets awaited the data print but quickly regained its upside momentum. Although the historical correlation between ADP and NFP figures are uninspiring at best, the positive nature of the reading may hint at better than expected NFP data later this week.
Source: DailyFX economic calendar
DOLLAR BOLSTERED BY RISING U.S. TREASURY YIELDS
U.S. 10 and 30-year government bond yields continue their rally heading up to the ADP employment data which has kept a supportive environment for the greenback.
LONG-END U.S. TREASURIES VS DXY
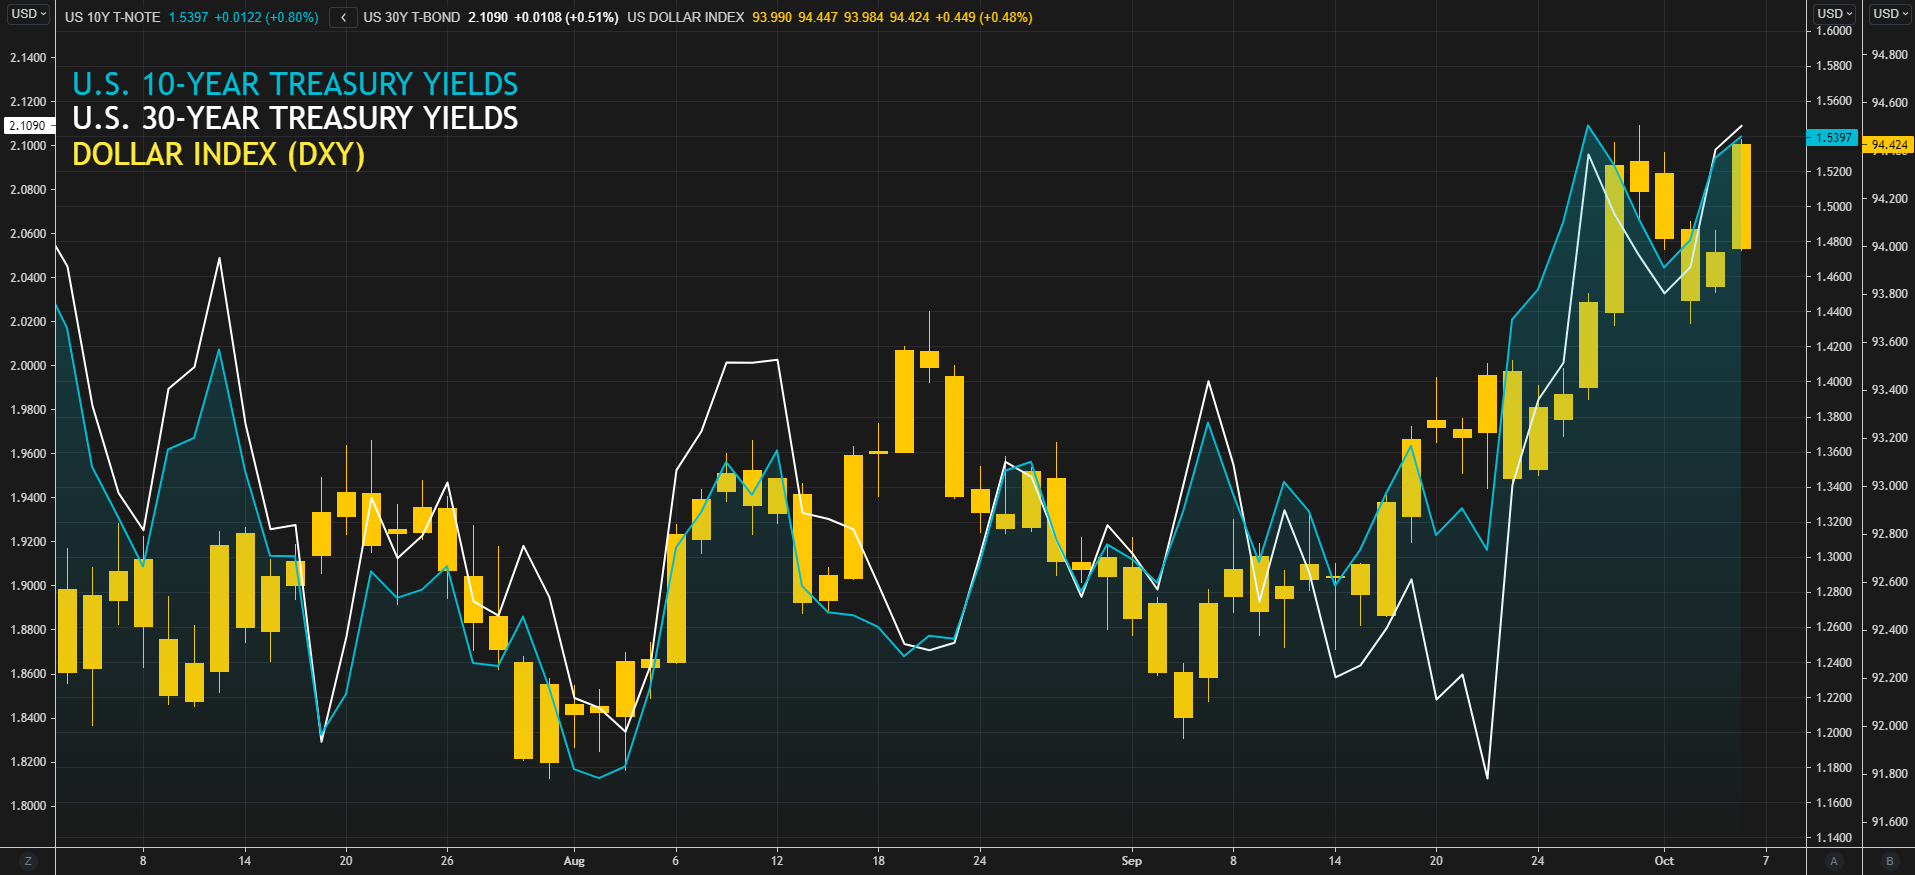
Source: Refinitiv
Upcoming jobless claims and Non-Farm Payroll (NFP) data (see calendar below) will give further guidance to markets moving forward. That being said, I believe only a significant underperformance could halt Fed tapering.
Inflationary pressure is lingering and is only being exacerbated by the current energy crisis and supply disruptions. QE tapering is required to help stem these headwinds despite disappointing recent labour prints.

Source: DailyFX economic calendar
SAFE-HAVEN PLAY
The dollar is being given additional support as a safe-haven particularly regarding Emerging Market (EM) currencies which has roots in increasing U.S./China tensions as well as the ongoing potential Evergrande debt default.
Contrary to the above, there is growing concern over a default by the U.S. government should the Democrats proposal to raise the current debt ceiling be rejected by Republicans once more. This will put negative pressure on the dollar should a credit downgrade ensue. According to Treasury Secretary Janet Yellen, October 18 2021 has been reserved as the deadline date.
TECHNICAL ANALYSIS
U.S. DOLLAR INDEX DAILY CHART
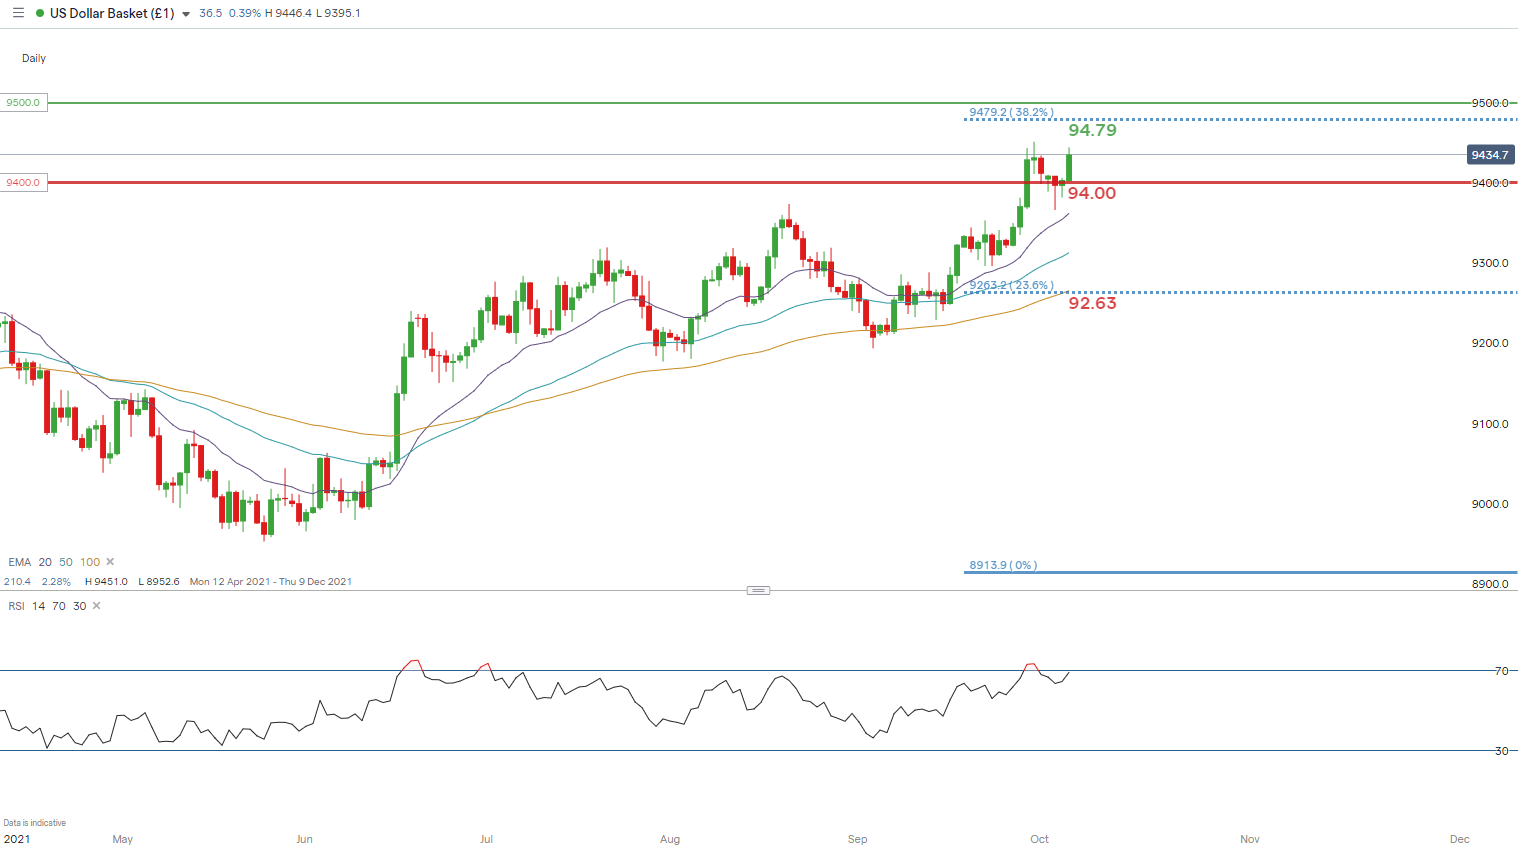
Chart prepared by Warren Venketas, IG
The daily DXY chart above represents a strong up-trending market despite being in overbought territory. Dollar bulls now eye the 38.2% Fibonacci level at 94.79 (Fibonacci taken from March 2020 high to January 2021 low) last seen in September 2020. There is still room to the upside despite the overbought Relative Strength Index (RSI) reading. With a hawkish Fed, this is likely to buoy dollar prices towards 94.79 short-term.
Resistance levels:
Support levels:
— Written by Warren Venketas for DailyFX.com
Contact and follow Warren on Twitter: @WVenketas
Be the first to comment