

Sundry Photography/iStock Editorial via Getty Images
The story of Walmart (NYSE:WMT) is simple, the law of large numbers is in effect. This has been case for a while, WMT has been the number one Fortune 500 company for the past decade. Store count has peaked and is now in decline, not growing.
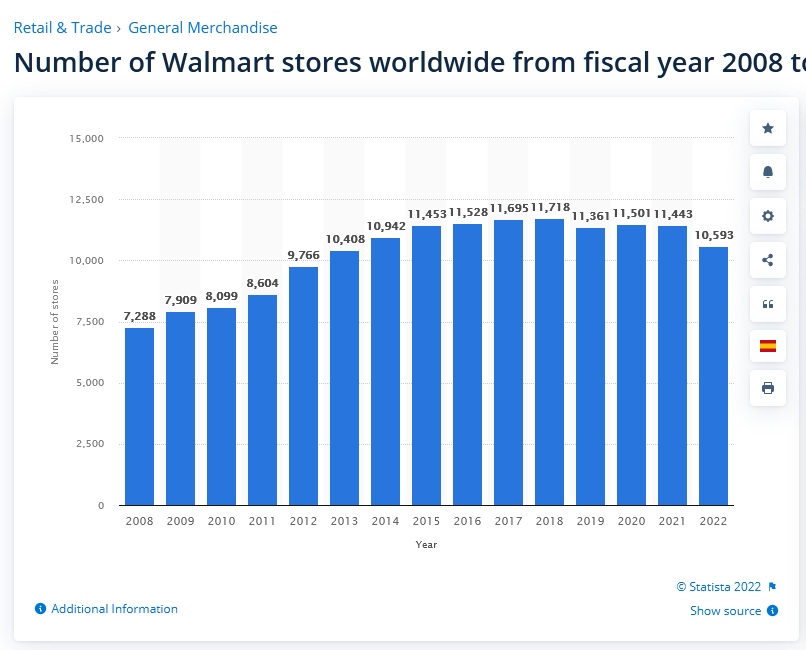
statista
There are two questions to ask: can superior capital allocation help boost returns for a company this size, and at what price can the law of large numbers be negated?
For many years the rise of AMZN put fear into the retailing sector which seemed justified at the time, but it’s now obvious that AMZN is not going to simply kill every major retailer. They will always play an important role alongside e-commerce, though some will inevitably go under.
No one can tell what the retail industry will look like 30 years from now, but of all blue chip companies, I consider WMT to be the best example of being “built to last.” AMZN won’t be competing head to head in the retail game with Whole Foods being the one exception, and most of the damage has already been done. We already live in a world where millions upon millions of people order online instead of in brick and mortar. Obviously WMT would like to maximize their online sales, but the core business is itself a staple.
Below is the share price over the past 20 years:
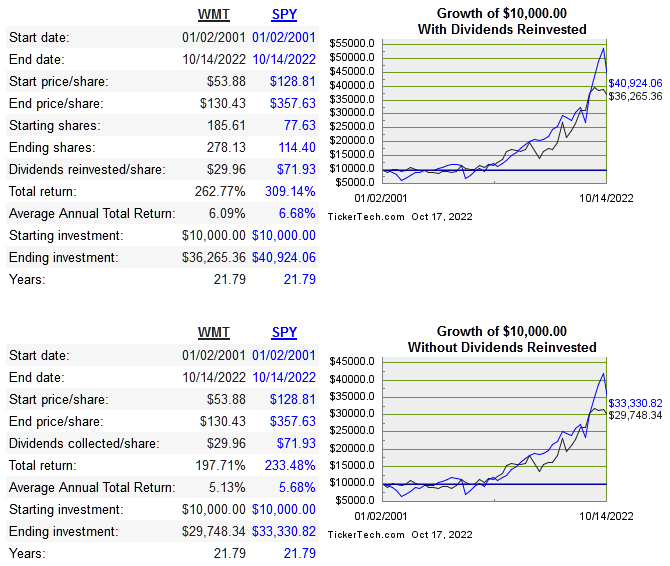
dividend channel
The return on capital metrics and more are below:
|
Company |
Revenue 10-Year CAGR |
10-Year Median ROE |
10-Year Median ROIC |
EPS 10-Year CAGR |
FCF 10-Year CAGR |
|
WMT |
2.5 |
17. |
10.1% |
0.7% |
0.1% |
|
8.6% |
23.1% |
15.2% |
12.9% |
8.2% |
|
|
4.3% |
25.3% |
11.9% |
12.7% |
16.6% |
|
|
-7.3% |
-7.3% |
7.1% |
63.2% |
54.2% |
Source: QuickFS
Capital Allocation
At this point the business growth is virtually guaranteed to continually get slower. The only way to ensure that shareholders get returns beyond what the business can generate is to have effective capital allocation.
Effective capital allocation is the key to the story here, and it will determine precisely the kind of returns shareholders get starting from now.
Below is a table of free cash flow and how it is used:
(In USD billions)
|
Year |
2012 |
2013 |
2014 |
2015 |
2016 |
2017 |
2018 |
2019 |
2020 |
2021 |
|
FCF |
10.74 |
12.69 |
10.14 |
16.39 |
15.91 |
20.91 |
18.28 |
17.4 |
14.55 |
25.8 |
|
Dividends Paid |
5.04 |
5.36 |
6.13 |
6.18 |
6.29 |
6.21 |
6.12 |
6.1 |
6.04 |
6.11 |
|
Repurchases |
6.29 |
7.6 |
6.68 |
1.01 |
4.11 |
8.29 |
8.29 |
7.41 |
5.71 |
2.62 |
|
Net Acquisitions |
3.54 |
0.31 |
n/a |
n/a |
n/a |
1.8 |
n/a |
13.78 |
n/a |
124 |
|
Debt Repayment |
4.93 |
1.47 |
4.96 |
3.9 |
4.43 |
2.05 |
16.1 |
3.78 |
1.9 |
5.7 |
Next year the company will become a dividend king by raising its dividend consecutively 50 years in a row. An increasing dividend is basically a lock at this point, but so is fundamental growth.
Share count has been reduced by 33.5% since 2007. This is a modest amount, but lowering share count will become maybe the most important driver of EPS growth in the future. They aren’t the kind of company that does huge acquisitions of disruptive companies as a main part of the strategy. The Flipkart acquisition is the notable exception.
There is no escaping the fact that reinvestment opportunities are scarce and declining. Most excess free cash flow is returned to shareholders and used to pay down debt. Over time WMT will look more like a trust than a growing business. Most of the return will be coming from the growing dividend, not capital appreciation. Potential investors need to be aware of exactly what they are getting into. A no growth, low beta, dividend grower with a 1.7% dividend yield currently.
Valuation
|
Company |
EV/Sales |
EV/EBITDA |
EV/FCF |
P/B |
Div Yield |
|
WMT |
0.6 |
10.7 |
64.8 |
4.1 |
1.7% |
|
COST |
0.9 |
20.3 |
56.2 |
9.7 |
0.7% |
|
TGT |
0/8 |
9.9 |
188 |
6.7 |
2.8% |
|
BJ |
0.6 |
11.7 |
28.9 |
11.2 |
n/a |
I prefer the EV/FCF ratio out of all the multiples, because it gives us an approximation of the return that a theoretical purchaser of the entire business would receive as free cash flow. The median 10-year free cash flow margin is only 3.5% and the growth of free cash flow has stalled and likely won’t grow continuously again minus another black swan that favors the company. Does this sound like a company worth paying 64x free cash flow?
The qualitative aspects of WMT from the past are baked into today’s price multiples. It may have an all-time great legacy, but from this point forward there’s no reason to pay a premium for a company that has virtually no growth attached to it. Below is the DCF model:
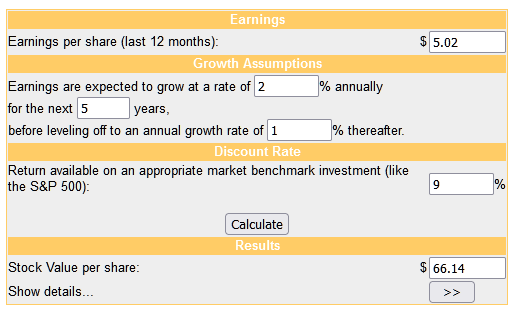
money chimp
Shares are clearly overvalued according to my valuation. Fundamental growth is stalled and the current dividend yield is not enticing enough to ignore the growth aspect.
Conclusion
Despite a great legacy, WMT has become a prime example of the law of large numbers. Just because it has peaked doesn’t mean it is a bad company at all. The quality is not the problem, it’s simply the lack of fundamental growth, and the premium being attached to the price right now. Most of the returns will come from dividend yield enough, and even though share count is regularly reduced, it isn’t at a rate that will cause an increase in the growth rate of EPS.
Be the first to comment