

Nordroden
It’s been a brutal 3-month stretch for the Gold Juniors Index (GDXJ), and many names have plunged 50% from their highs. The decline has been entirely justified in cases where we’ve seen massive share dilution, like Argonaut Gold (ARNGF). However, when it comes to companies firing on all cylinders like K92 Mining (OTCQX:KNTNF), this looks to be a case of the baby being thrown out with the bathwater. Given the company’s continued operational excellence combined with an industry-leading growth profile, I believe this is a name to keep a close eye on if we see further weakness.
Kainantu Mine Mineralization (Company Website)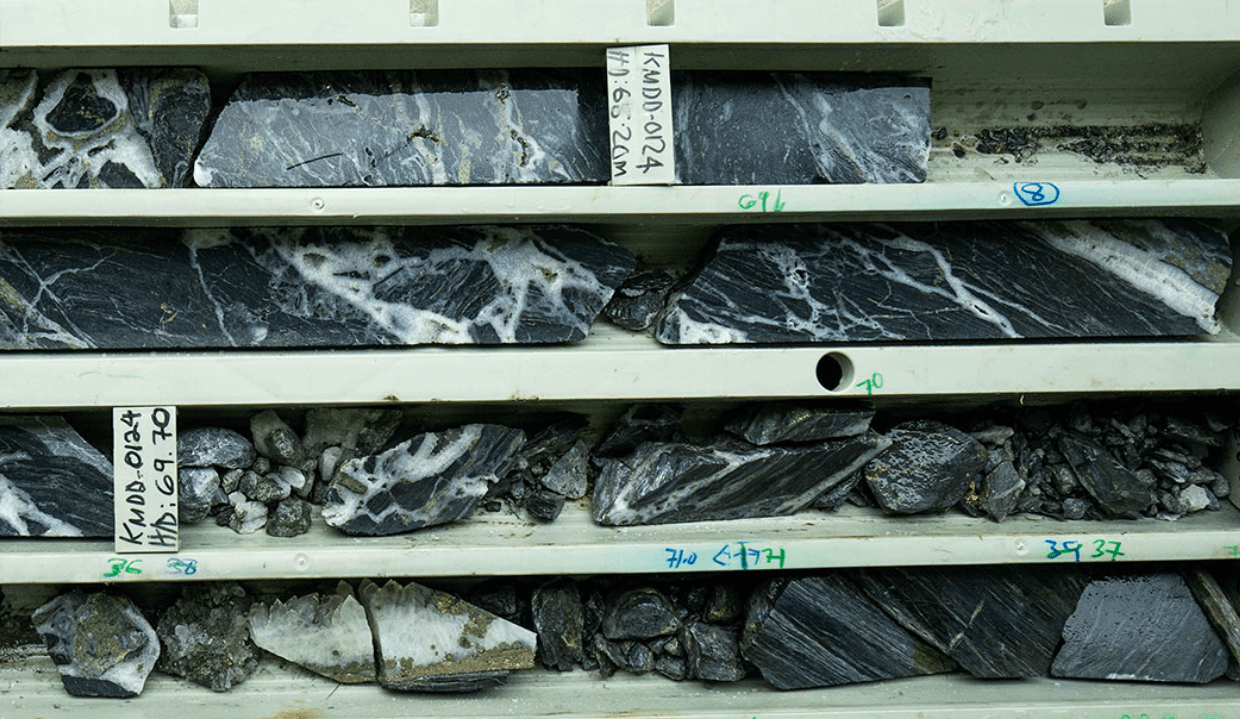
Q2 Production
K92 Mining released its preliminary Q2 results last week, reporting quarterly production of ~26,100 gold-equivalent ounces [GEOs], a 4% increase from the year-ago period. The solid performance has pushed year-to-date production to ~54,300 GEOs, which at first glance, might appear miles behind the company’s guidance mid-point of 127,500 GEOs (42.5%). However, it’s important to note that under the surface, operating metrics continue to trend in the right direction and ahead of planned levels. This was evidenced by a record plant throughput of ~108,900 tonnes processed in Q2, and a record mine throughput of ~115,000 tonnes, setting K92 up for a massive second half of the year.
K92 Mining – Quarterly GEO Production (Company Filings, Author’s Chart)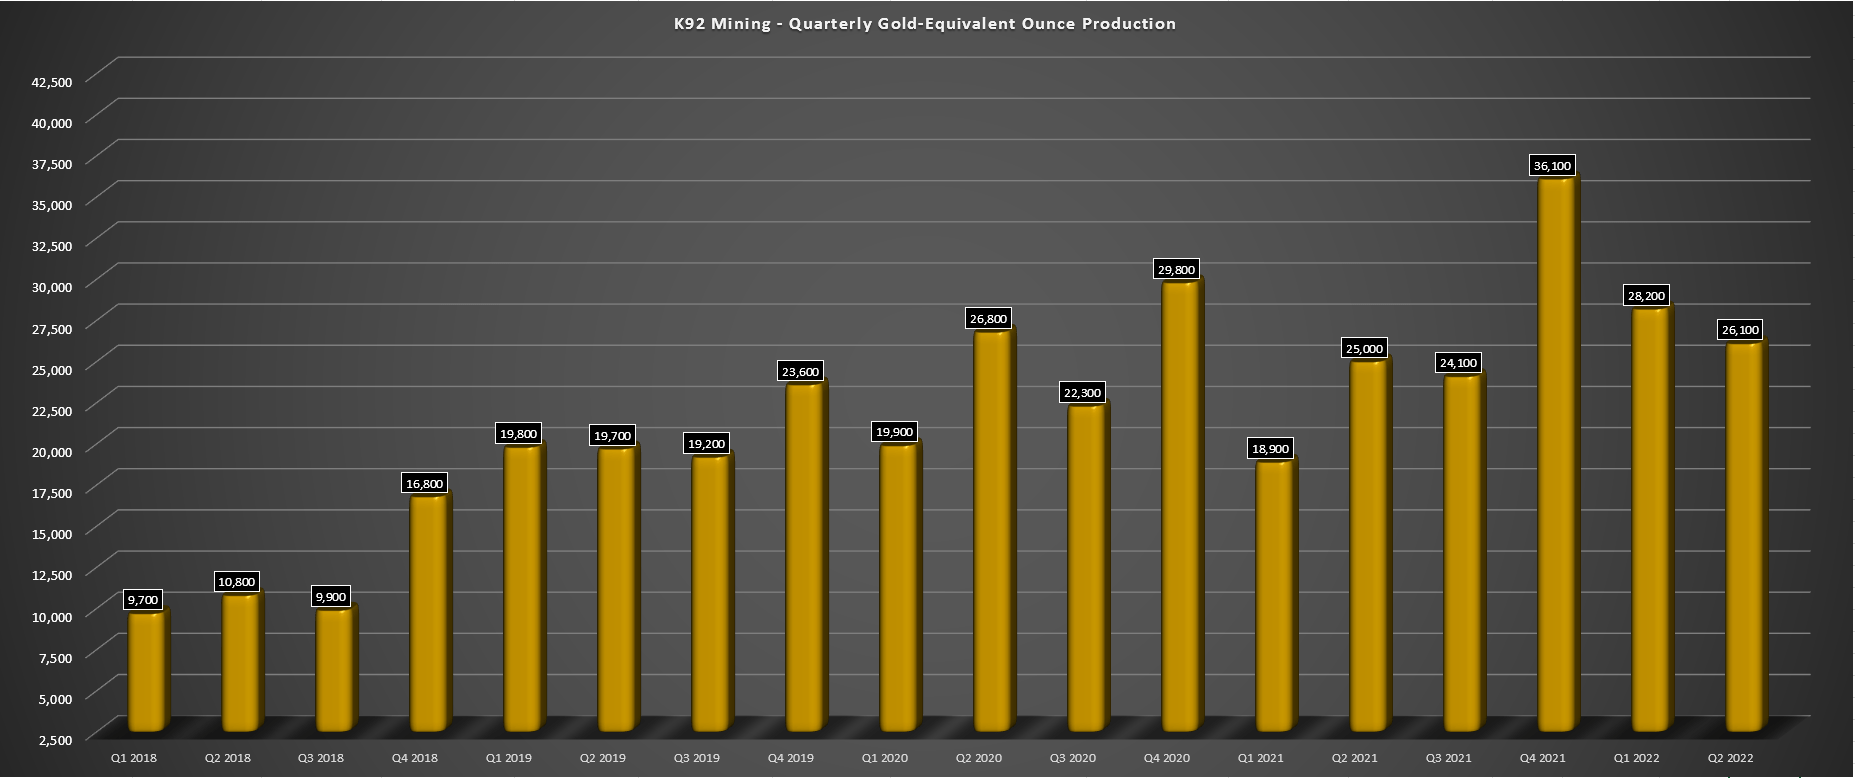
Looking at the chart below, we can see that quarterly throughput continues to trend higher at a torrid pace, increasing 44% year-over-year to a rate of 1,196 tonnes per day. Notably, this is well ahead of the Stage 2 Expansion rate of 1,100 tonnes per day (400,000 tonnes per annum), and as of May/June, throughput is tracking just below Stage 2A Expansion rates as well (1,370 tonnes per day). This is based on K92 reporting that 48% of days in May/June exceeded 1,300 tonnes per day, and daily records were set at 1,559 tonnes per day (June 29th, 2022) and 1,638 tonnes per day (July 6th) shortly after quarter-end.
This impressive performance relative to design capacity is quite encouraging, suggesting that once the Stage 2A Expansion is complete, the actual throughput rate could be above 1,450 tonnes per day, given the ability to exceed nameplate capacity. At a grade assumption of ~10 grams per tonne on a gold-equivalent basis, this would translate to ~150,000 GEOs per annum from this plant alone, which completely excludes the Phase 3 Expansion that will involve adding a new plant capable of processing over 1.0 million tonnes per annum.
K92 Mining – Quarterly Throughput & Grades (Company Filings, Author’s Chart)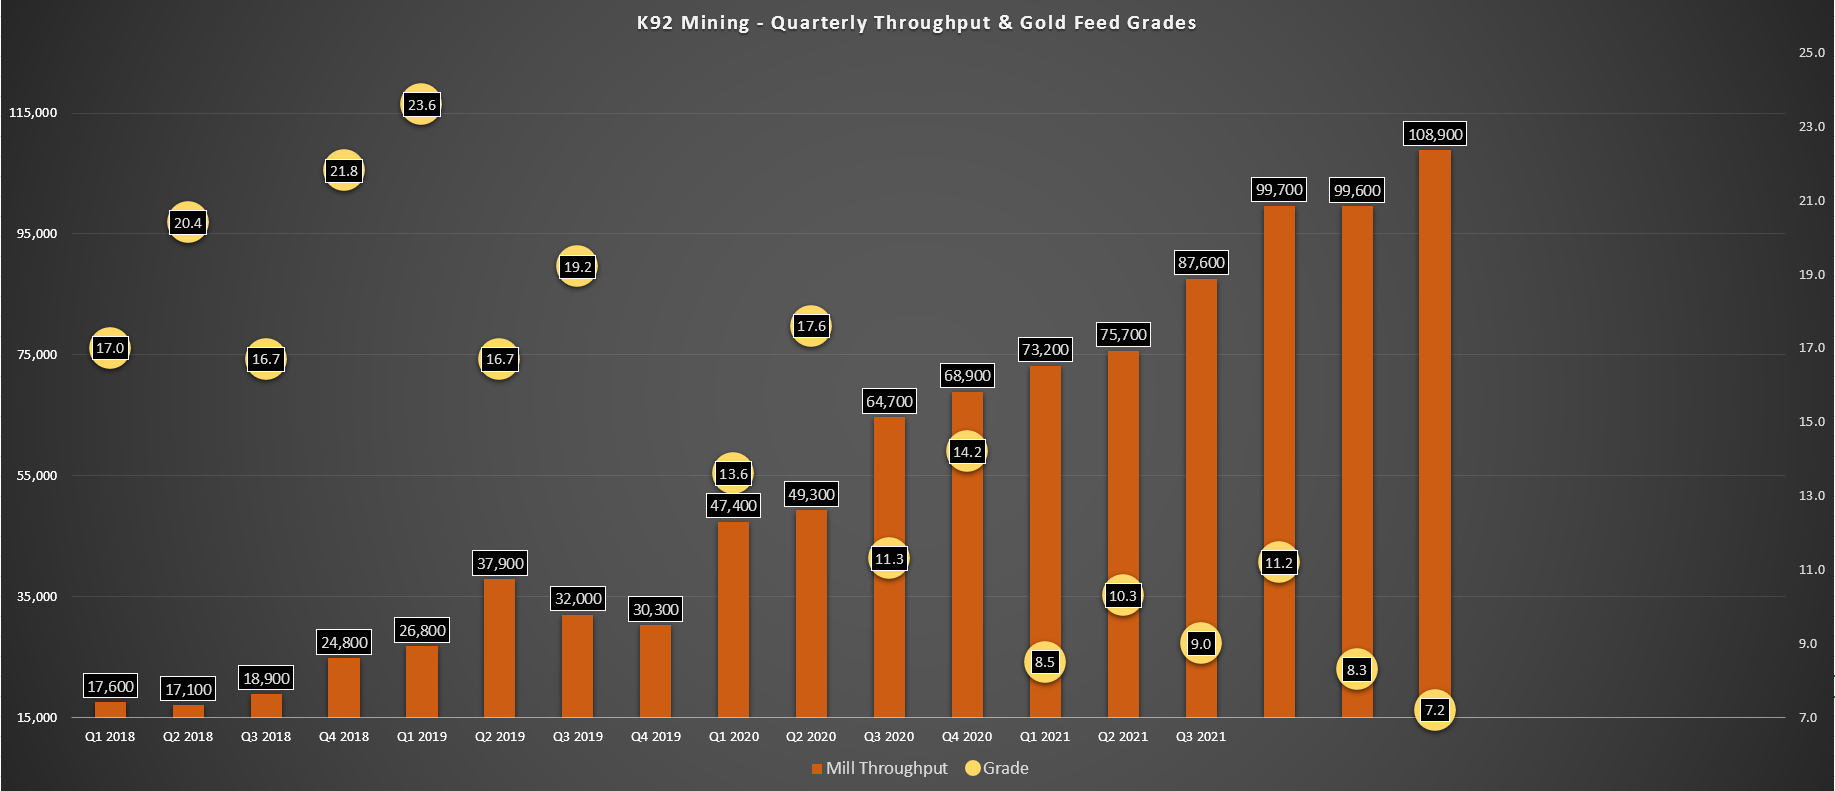
Just as importantly, the company is not mine-constrained currently, and its mining rates are now above plant throughput levels despite the significant increase in processing capacity over the past year from its expansions. This was evidenced by mining rates coming in at 114,500 tonnes per day, up 59% year-over-year, and averaging more than 1,270 tonnes per day. From a development standpoint, the performance has been quite encouraging, with the company’s twin incline (6×6 meters) advancing to 1,276 meters, with incline #3 (5×5 meters) advanced to 1,317 meters at quarter-end. These figures are ahead of budget by 38% year-to-date, which is very impressive given the Omicron spike, which slowed down development for some companies.
Kainantu Mine (Company Presentation)
So, why was production only up 4% in the quarter?
While throughput continues to climb at an impressive rate, the company processed much lower grades in the quarter (7.2 grams per tonne gold) due to stope sequencing. These lower grades being fed to the plant mostly offset the high double-digit increase in throughput, leading to only a mid-single-digit increase in GEO production in Q2. However, with throughput set to climb above the 1,350-tonne per day level and higher grades scheduled for later this year, K92 Mining is set up for 33,000+ GEOs in Q3 and 35,000+ GEOs in Q4, placing it well on track to deliver into its guidance of 115,000 to 140,000 GEOs for FY2022. Even at a lower gold price assumption ($1,800/oz), this would translate to record annual revenue of more than $210 million (FY2021: ~$154 million).
Long-Term Growth
While the recent results are very encouraging, it’s K92’s future that should get investors the most excited. This is because the company hopes to increase production to ~350,000 GEOs per annum by 2026 with the construction of a new plant capable of processing 1.2 million tonnes per annum. Even assuming K92 Mining produces 130,000 GEOs per annum, this would translate to a compound annual production growth rate of 28%. This figure is more than double the total production growth rate in the same period for most companies in the industry that expect to increase production and is miles ahead of the industry as a whole, which will be lucky to grow production on balance among publicly listed companies.
K92 Mining expects to release its new Phase 3A study this summer. Even with cost creep due to inflationary pressures, the company should have no problem funding this growth internally, especially after its wise capital raise at higher levels (~$40 million). However, it’s important to note that this growth to ~350,000 GEOs per annum by 2026 is based solely on the new plant and does not factor in an idle capacity of 500,000+ tonnes per annum at its current plant. Hence, the company’s actual plant throughput rate will be closer to 1.7 million tonnes per annum, moving its production potential to north of 425,000 ounces per annum, depending on if it can fill both its plants down the road. So, while the ~$1.3 billion market cap might be a head-scratcher, a growth profile like this deserves a premium valuation.
Kainantu Mine (Company Presentation)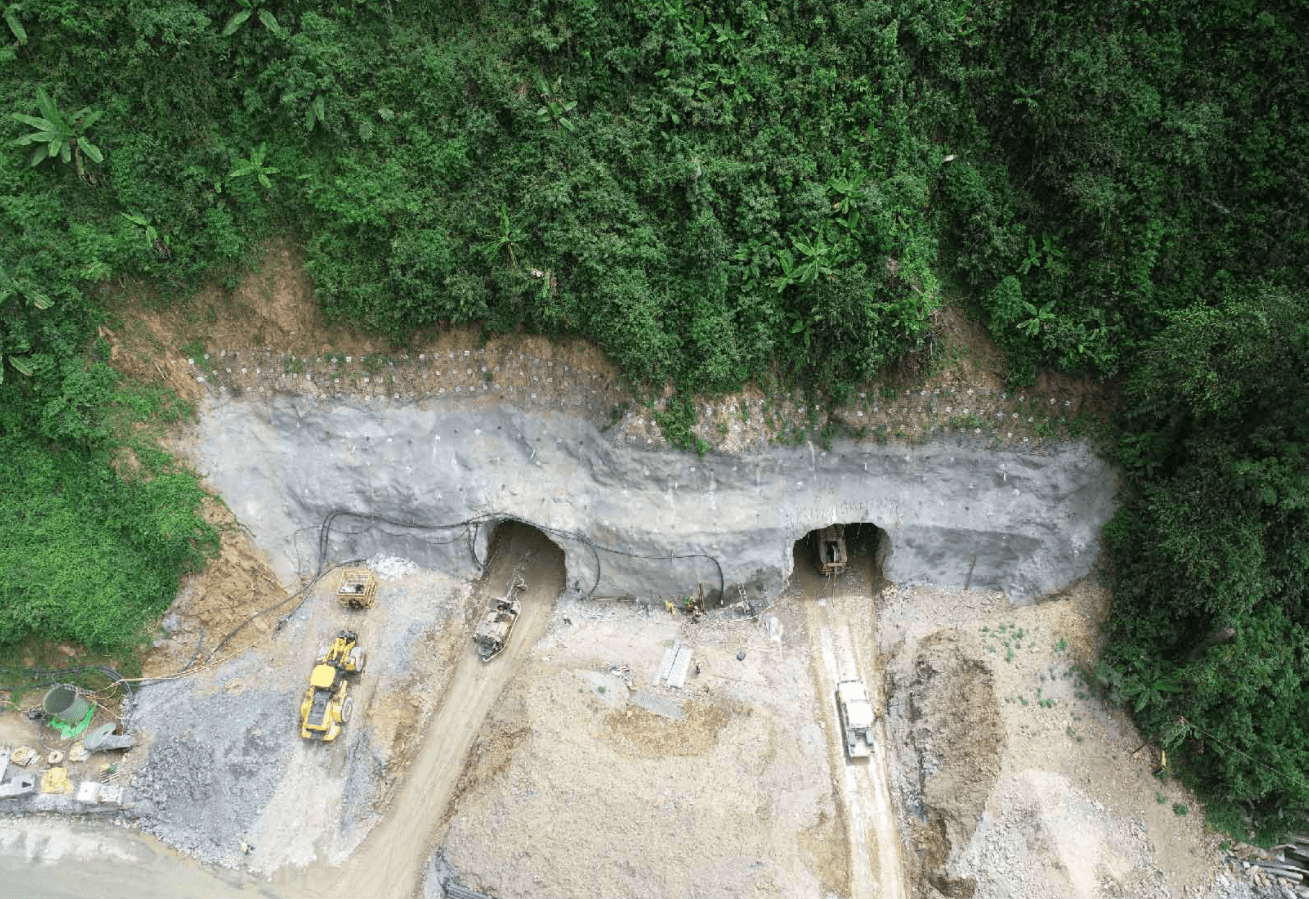
Finally, it’s worth noting that the average all-in sustaining costs [AISC] for producers will creep up towards $1,200/oz in FY2022 and $1,270/oz by 2025, but K92 Mining will massively buck this trend. The reason is that its Phase 3A Expansion should be able to drive costs below $650/oz, translating to a 25% decline from FY2021 all-in sustaining costs of $856/oz. At the same time (2021-2026), I would expect the industry average AISC to rise to $1,280/oz or higher, translating to a slight decline in margins for the industry average. So, as the chart below shows, K92 Mining will thrive in a rising or falling gold price environment, which is not the case for most of its peers.
Gold Producers – Costs, Gold Price, Margins vs. K92 Mining Projected Margin Profile (Company Filings, Author’s Chart & Estimates)
Valuation
Based on an estimated ~243 million fully diluted shares at year-end and a share price of US$5.60, K92 Mining trades at a market cap of ~$1.36 billion. If we compare this to other junior to mid-tier producers like Karora (OTCQX:KRRGF) and Wesdome (OTCQX:WDOFF), this would appear to be a very lofty valuation, especially given its less attractive jurisdictional profile (PNG vs. Canada/Australia). However, K92 Mining has an industry-leading growth profile and is one of the only junior producers with a path to production of 350,000 GEOs per annum by 2026. In my view, this justifies a premium multiple, especially given that this growth will be coupled with significant margin expansion.
That said, while I see a fair value for the stock of US$8.00 based on an estimated net asset value of $1.96 billion and a P/NAV multiple of 1.0, the stock has held up much better than its peers over the past couple of months. This has led to its peers becoming much more undervalued relative to K92 Mining, with some sporting more than 100% upside to fair value. So, strictly from a relative value and risk-adjusted standpoint (jurisdictional risk), there are more attractive bets elsewhere in the sector from an investment standpoint.
Technical Picture
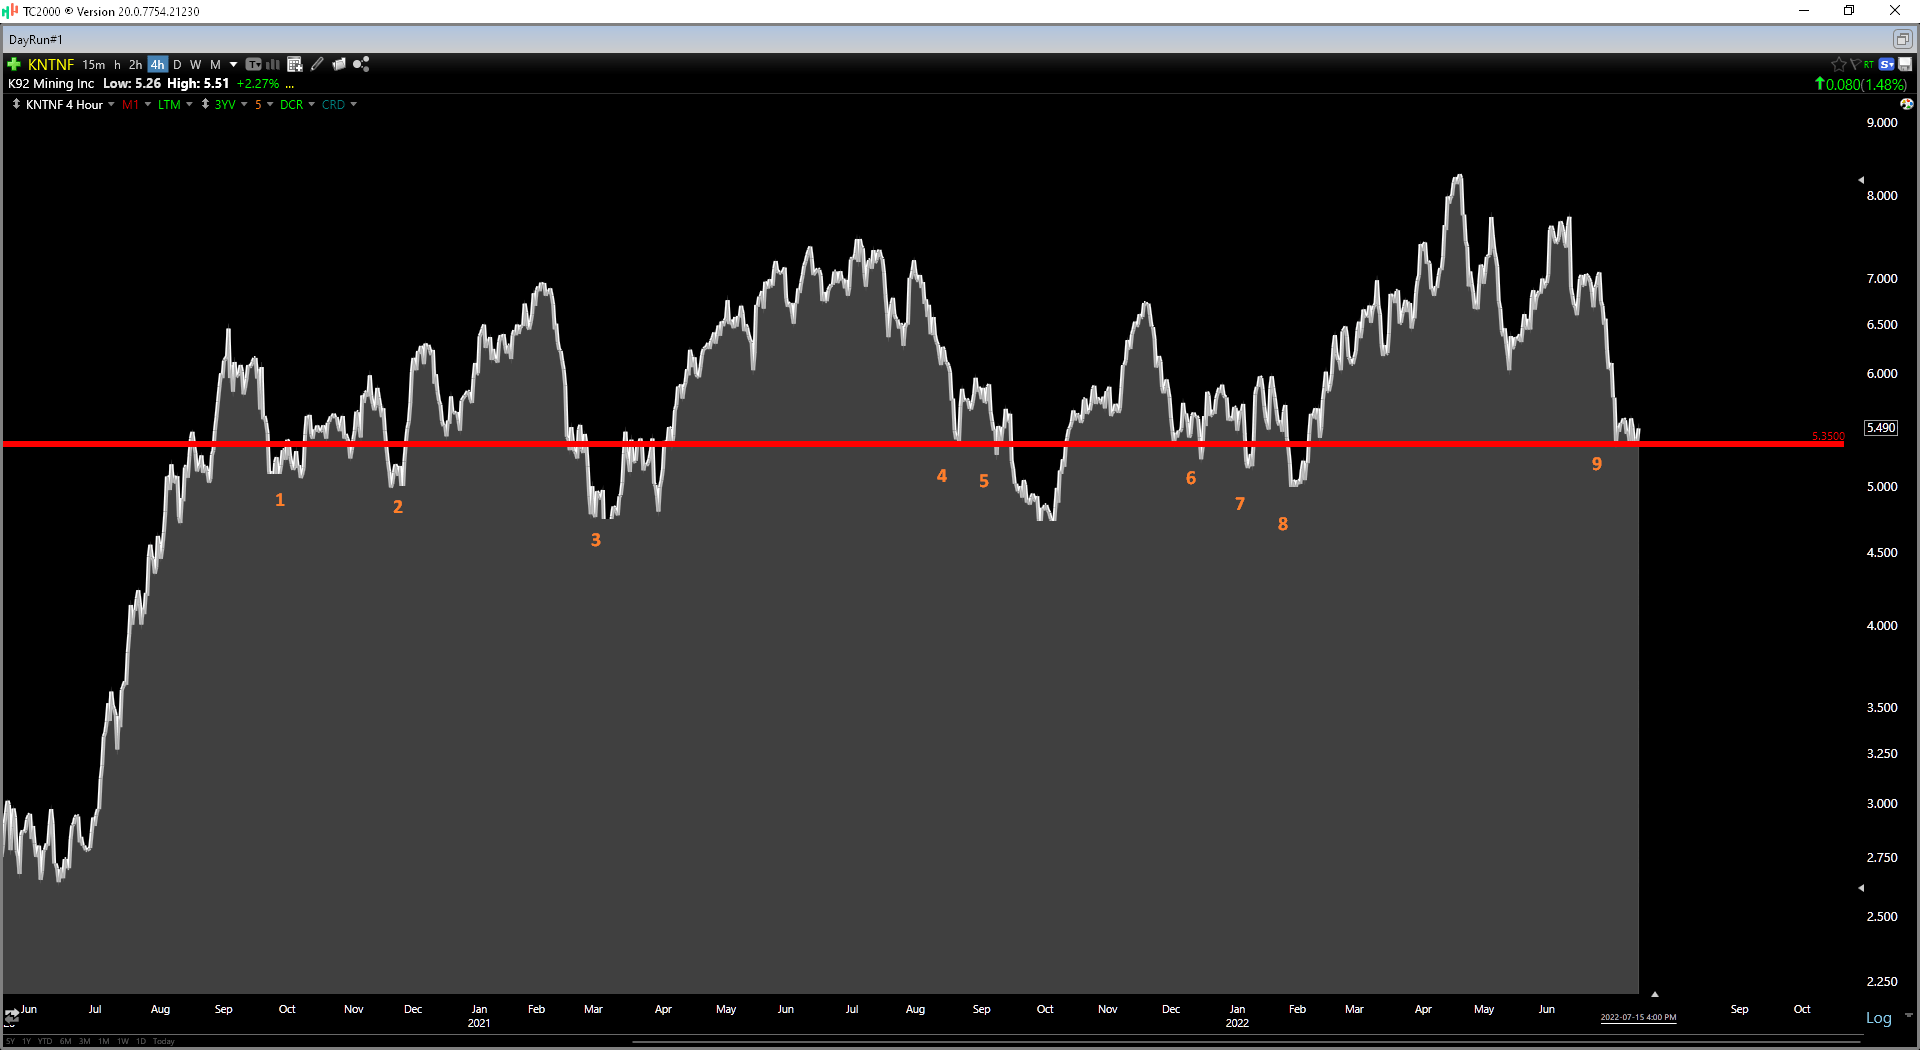
Looking at the technical picture below, we can see that K92 Mining is trading in the lower portion of its range, with strong support at US$4.50 and no strong resistance until the US$7.55 – US$8.20 area. This leaves the stock in the lower portion of its trading range at US$5.60, suggesting the stock could enjoy a strong bounce. However, the one issue I see is that the upper support level of US$5.35 has been tested nine times over the past two years, and areas of support/resistance tend to be weakened the more they are tested. An analogy would be a battering ram hammering away at the front gates of a castle and the defense being weakened on each subsequent test.
KNTNF Daily Chart (TC2000.com) KNTNF Hourly Char (TC2000.com)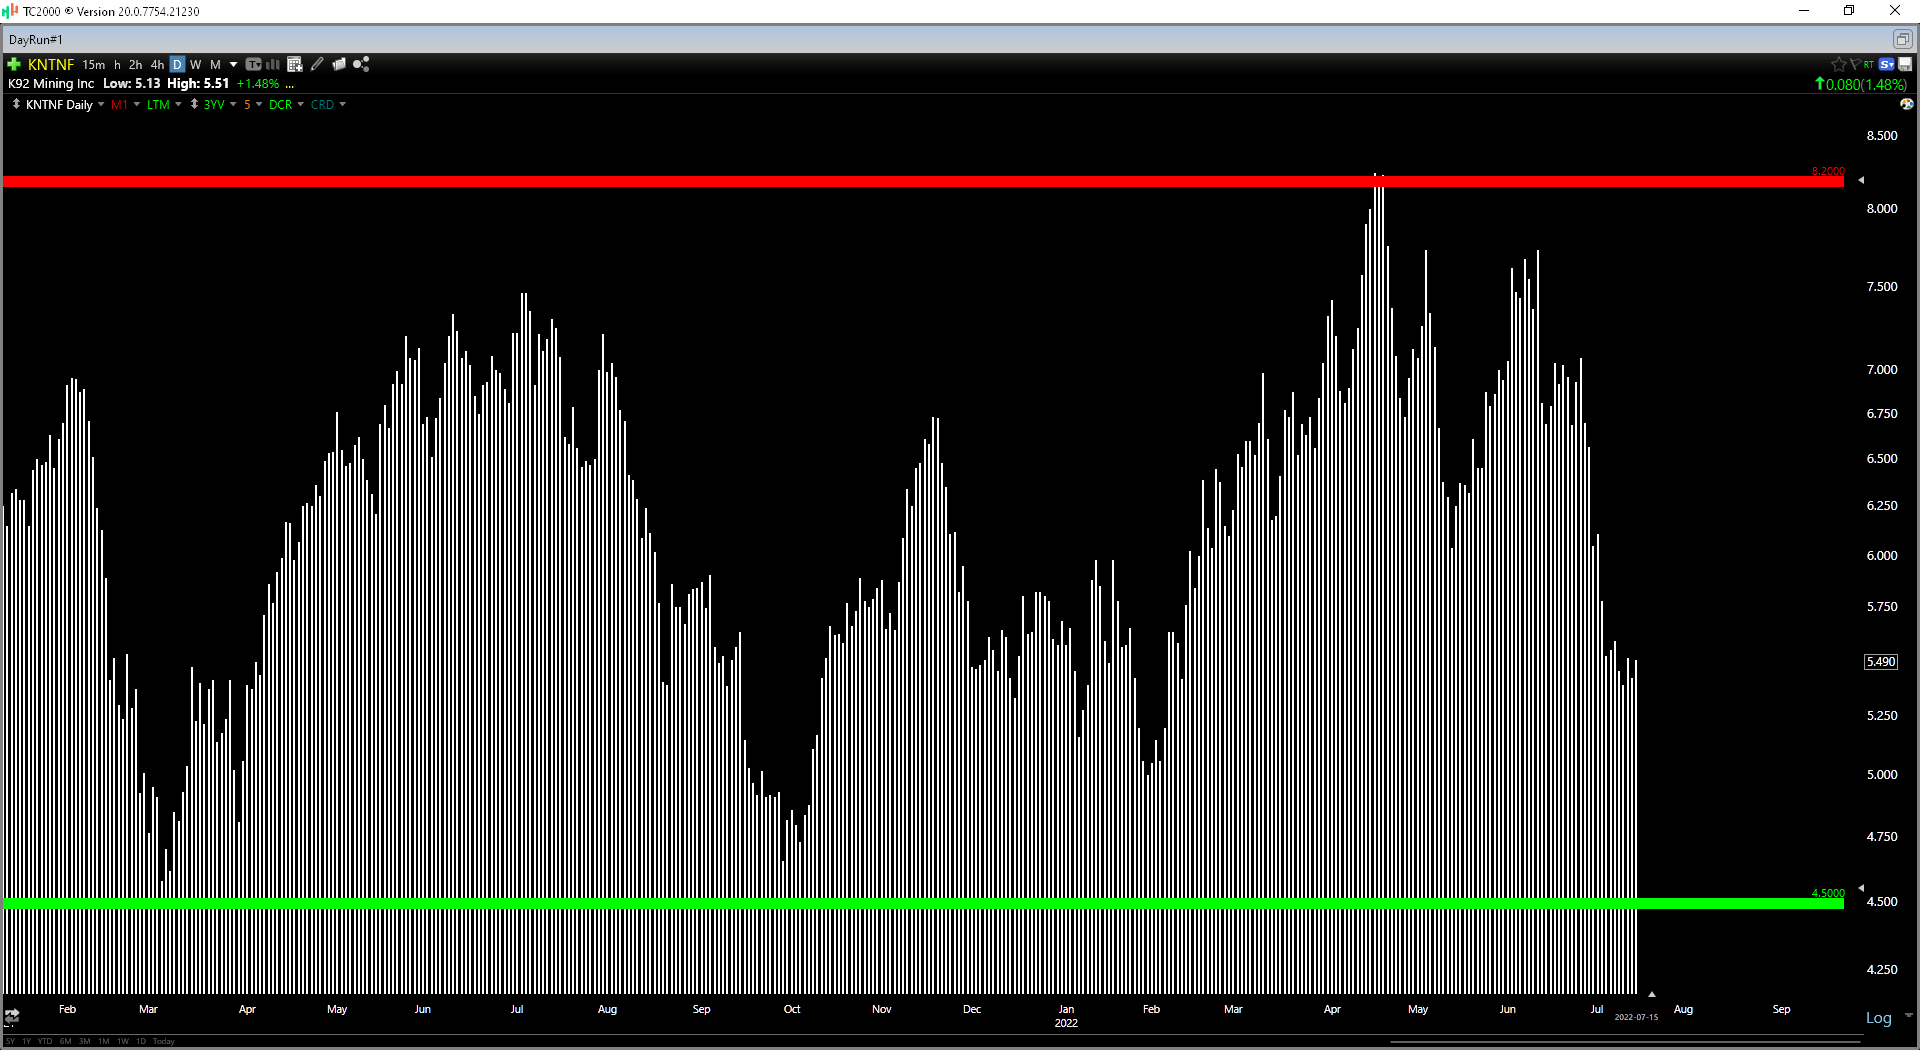
While the stock does not have to falter here, and the bulls may manage to fight off the bears another time at this key area, this support area is looking much less reliable, and I have less confidence in this area holding. This is similar to what we saw from Skeena Resources (SKE) and was why I sold my position at US$9.00 in May. So, while I could be wrong, I think the more attractive buy-point for K92 Mining would be closer to US$4.50. The $4.50 level represents a major support level and would allow for a shake-out to potentially run stop-loss orders below the upper and obvious support zone at $5.35.
Summary
K92 Mining continues to fire on all cylinders operationally and is arguably a top-3 growth story in the precious metals space. This is based on the fact that it could increase production by more than 150% by 2026 while also enjoying higher margins (sub $600/oz costs). However, with its upper support level potentially weakening and there being more attractive bets from a relative value standpoint elsewhere, I am Neutral on the stock for now, even if I do see long-term upside. This doesn’t mean the stock can’t go higher. Still, given the recent gold price weakness, I am more interested in names with a larger margin of safety that have already seen shake-outs below major support areas to clean out weak-handed investors.
Be the first to comment