

ronniechua/iStock via Getty Images
A guest post by D Coyne
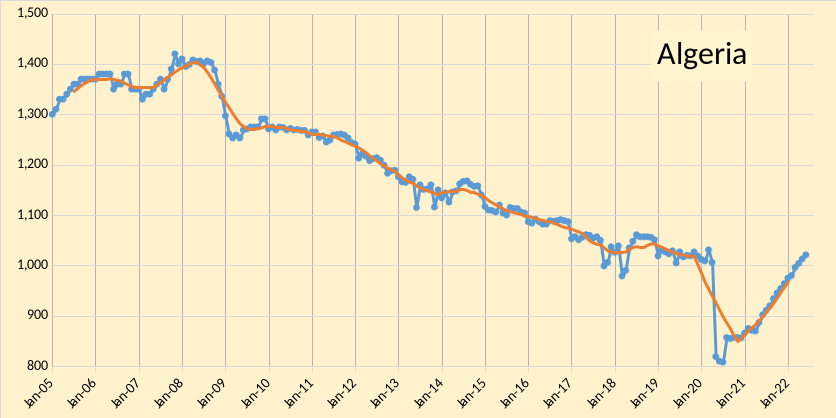
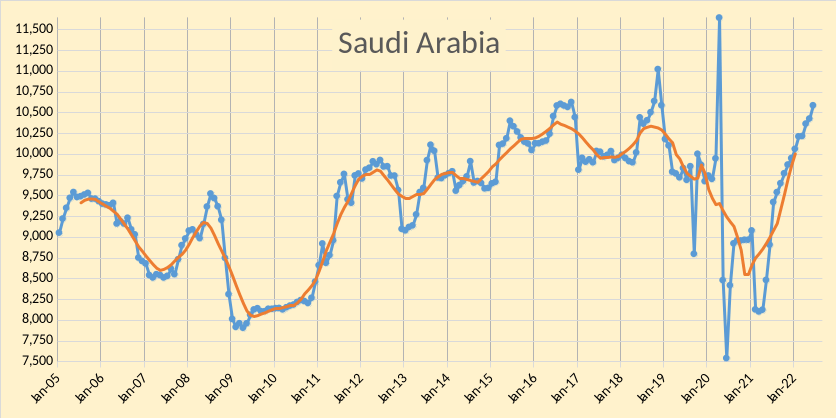
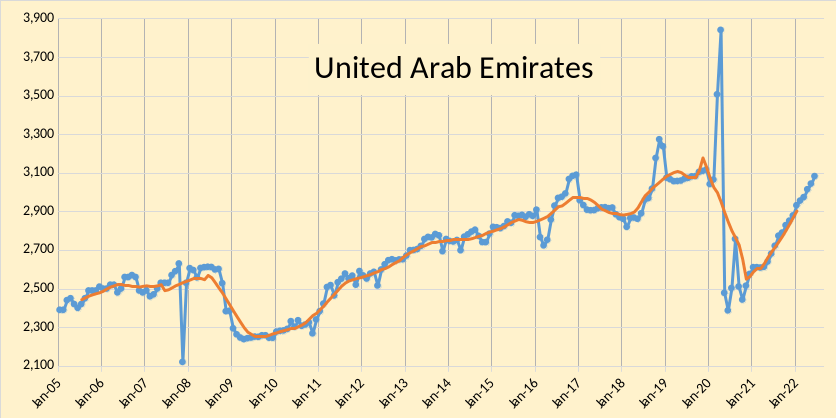
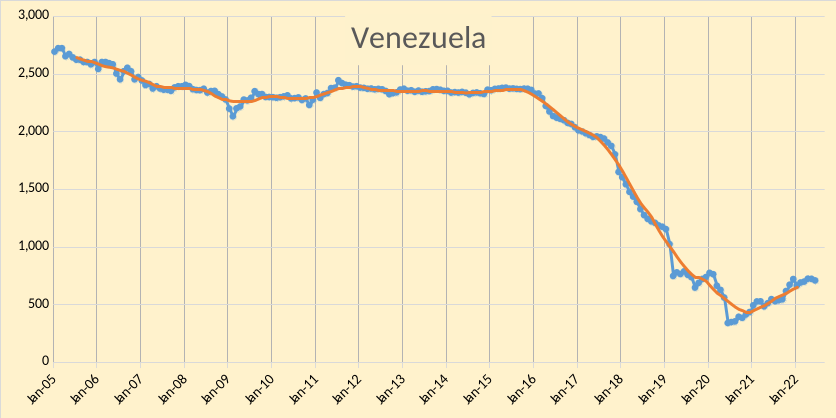
The OPEC Monthly Oil Market Report (MOMR) for July 2022 was published recently. The last month reported in most of the OPEC charts that follow is June 2022 and output reported for OPEC nations is crude oil output in thousands of barrels per day (kb/d). In most of the OPEC charts that follow the blue line is monthly output and the red line is the centered twelve-month average (CTMA) output.
Figure 1 Figure 2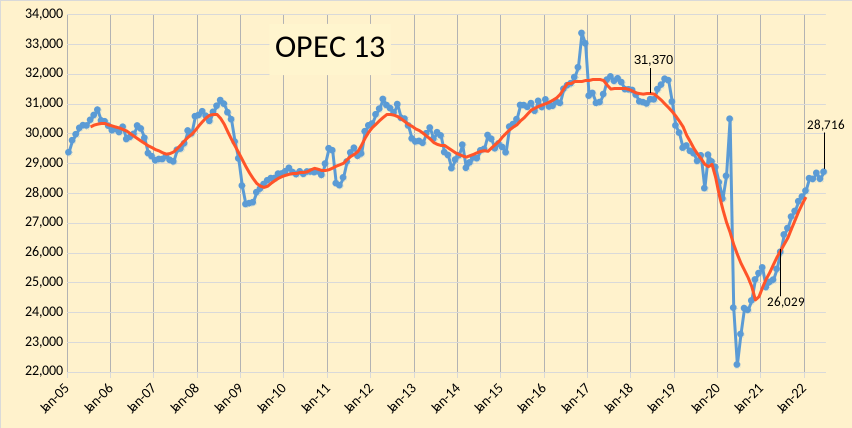
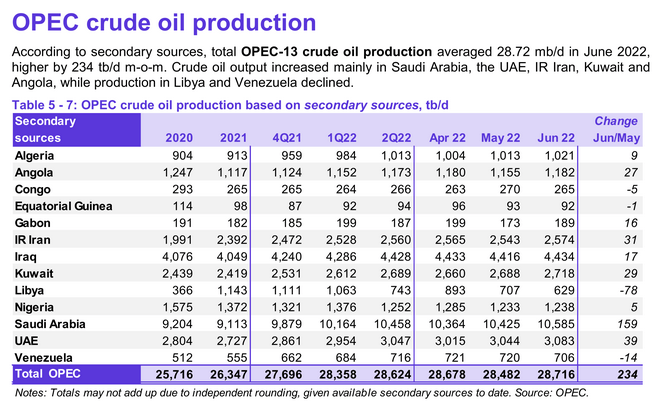
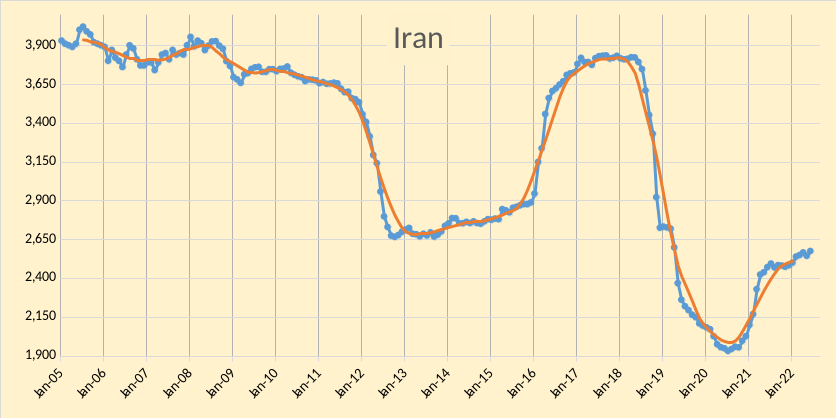
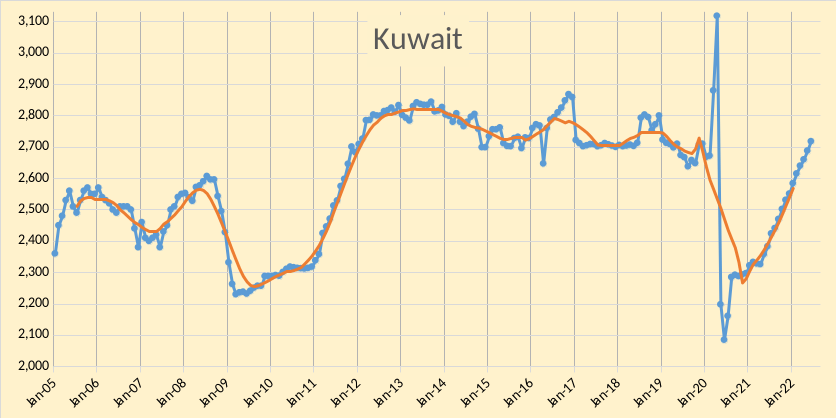
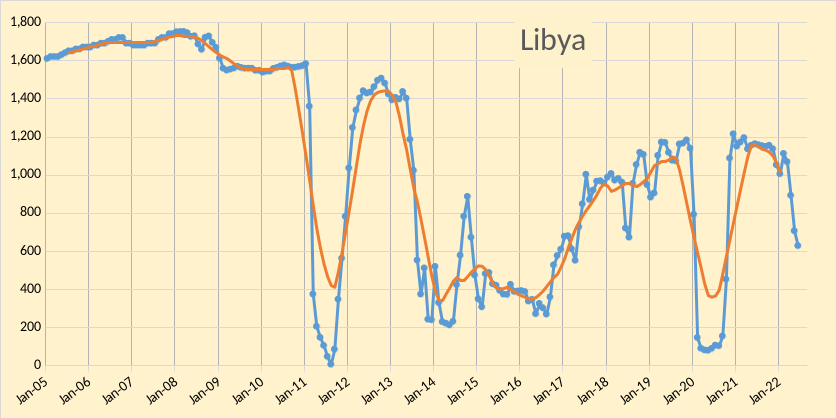
OPEC output was revised lower in April 2022 by 6 kb/d and May 2022 output was revised down by 26 kb/d compared to last month’s MOMR. The bulk of the June increase in output (68%) was from Saudi Arabia, with smaller increases from UAE(39), Iran(31), Kuwait(29), and Angola (27). Libya had a fairly significant decrease of 78 kb/d and Venezuela was down by 14 kb/d.
Figure 3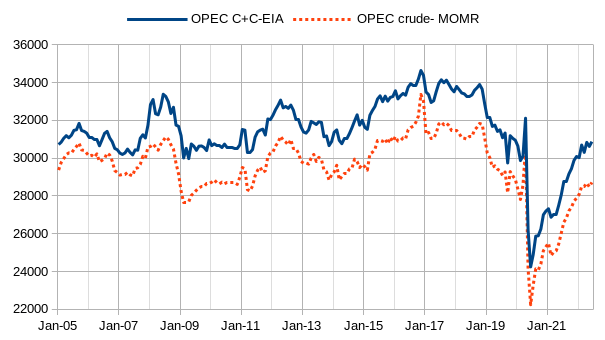
The chart above compares OPEC crude data from MOMR with OPEC data from the EIA through March 2022, the last few months is an estimate that assumes the average ratio of crude to C+C from April 2021 to March 2022 continues from April to June (this may be incorrect).
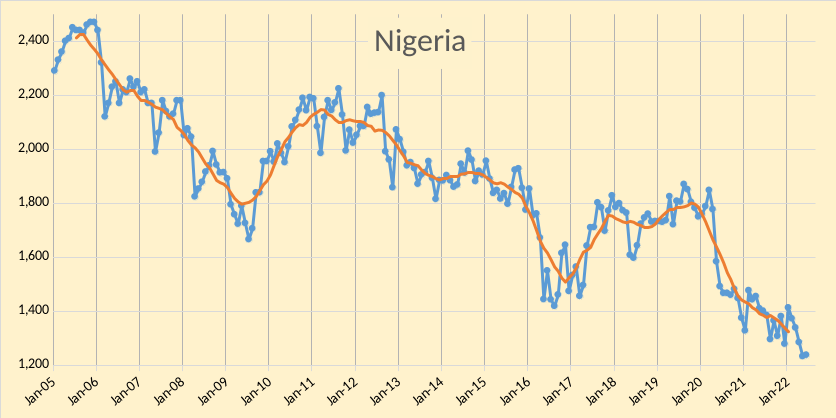
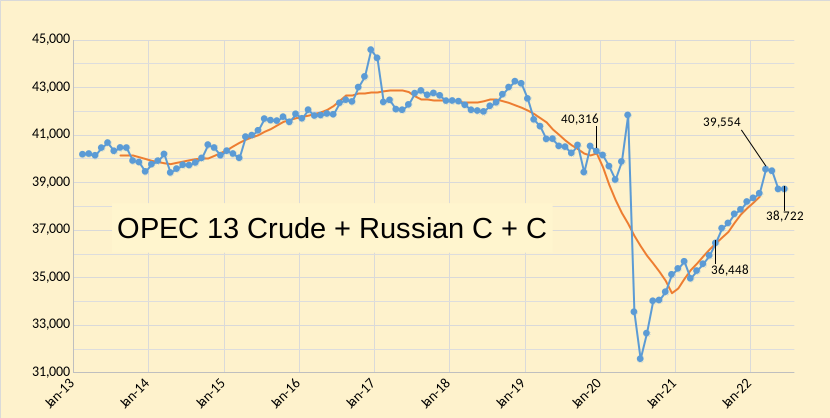
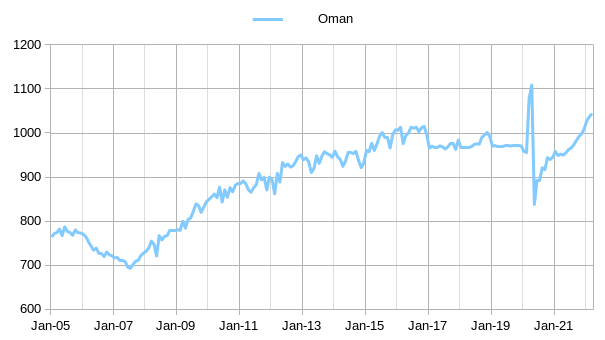
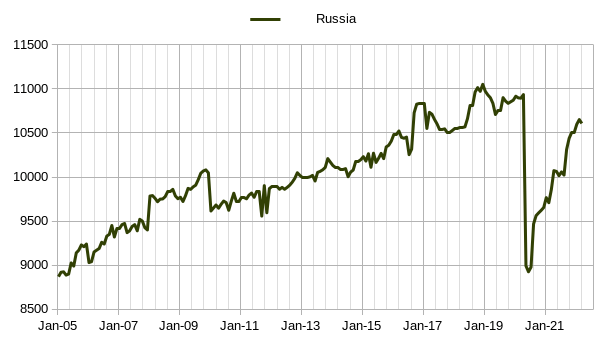
In the chart below we have Russian C + C and OPEC crude oil output. Output is almost 4 million barrels per day below the 12-month average peak in 2018 (when world output was at its peak) and it seems likely that further increases in output will be difficult due to problems in Libya and Nigeria along with sanctions on Russia, Iran, and Venezuela.
World liquids supply increased to 99.8 Mb/d in June 2022, 9.6 Mb/d higher than June 2020.
Figure 5 Figure 6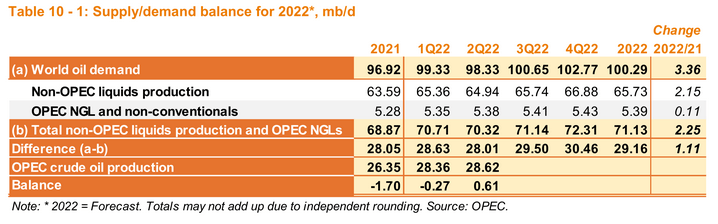
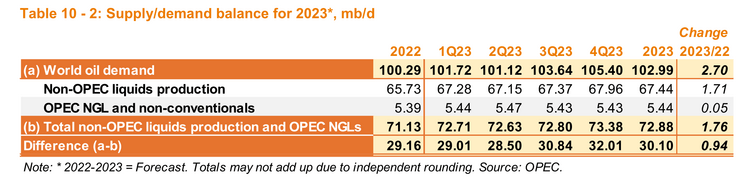
It is highly unlikely that OPEC will be able to meet the call on OPEC of over 30 Mb/d in 2022Q4. 2023Q3, and especially the 32.01 Mb/d of 2023Q4.
Figure 7
OECD stocks from a days of forward supply view in chart above. Currently, they are at 90 days (includes government and commercial petroleum stocks) similar to the low points during the high oil price period from 2011 to 2014 and about 7 days below the 5-year average. Looking at the chart it seems stocks at days of forward supply between 90 and 94 days result in high oil prices, I expect high oil prices (which I define as $80/bo or more in 2021 US$) will continue unless we see a severe recession (which I define as World annual real GDP growth of negative 1% or lower.)
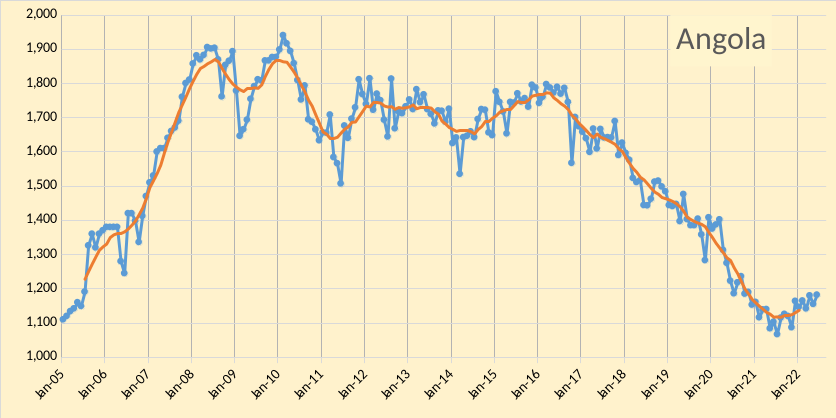
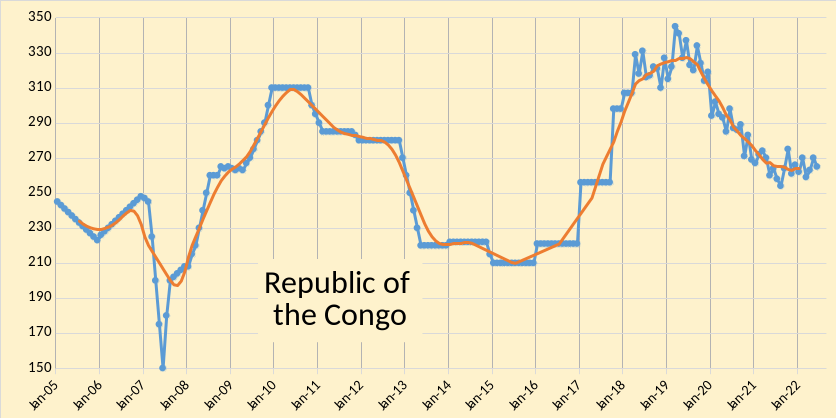
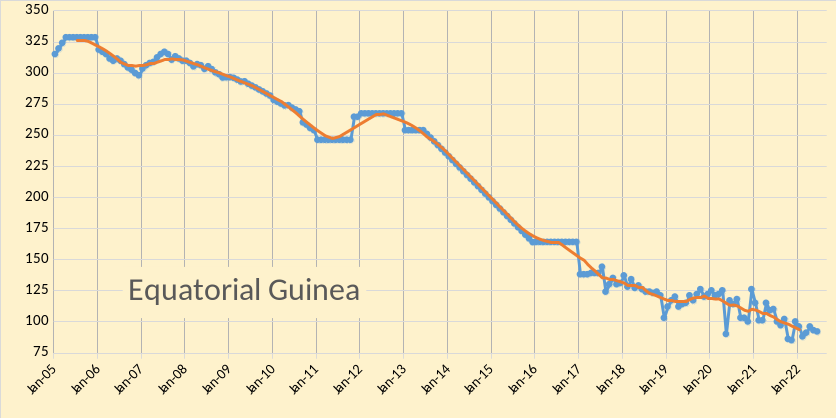
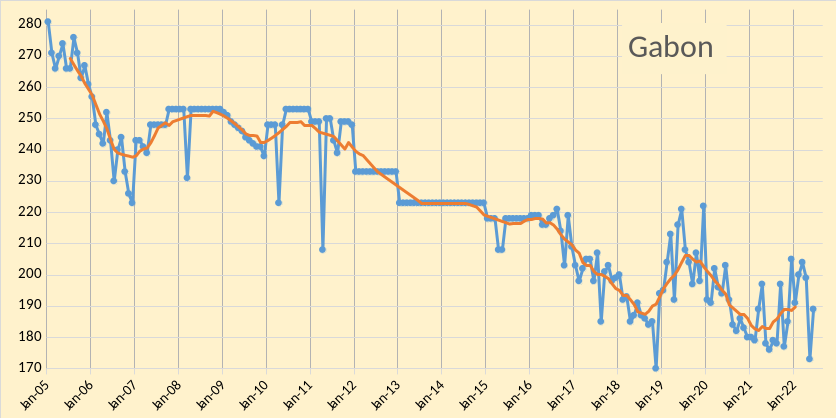
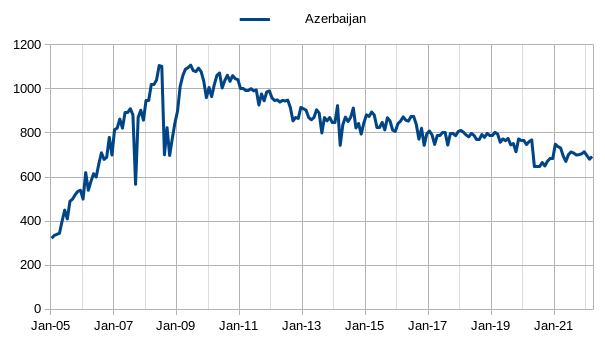
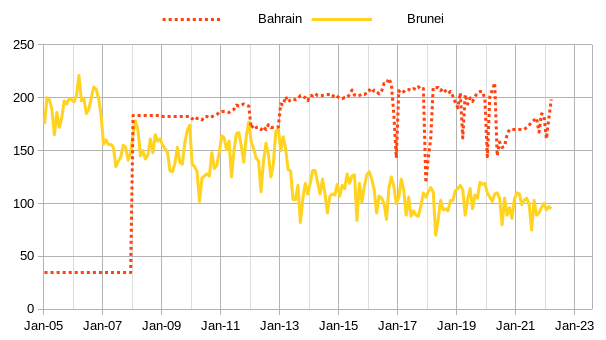
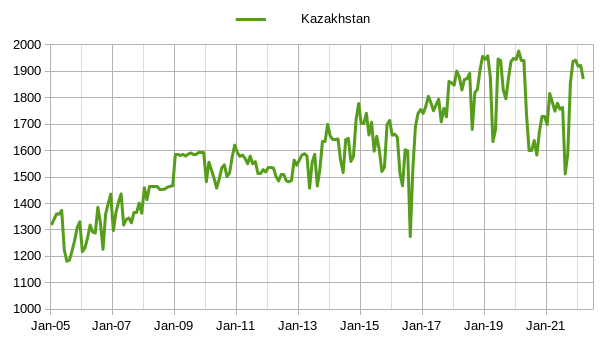
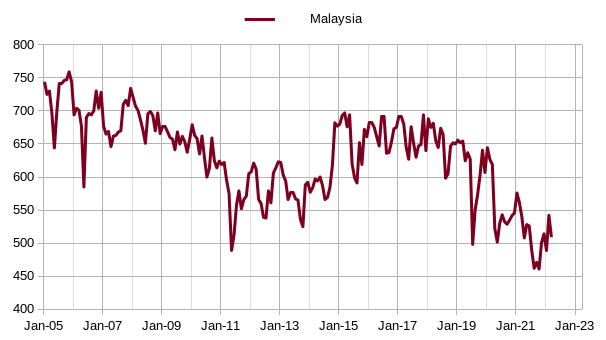
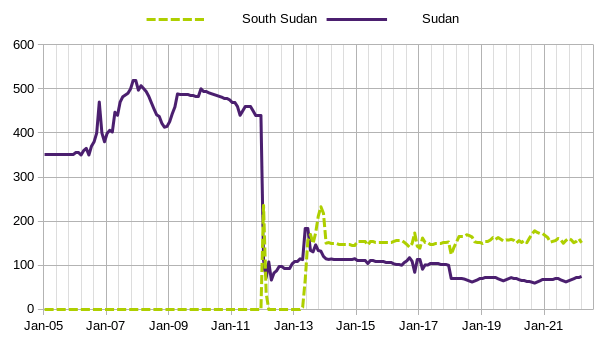
Charts below explore the Nine Nations cooperating with OPEC under the Declaration of Cooperation (DOC) which I call the DOC9. All charts that follow have data ending with March 2022.
Figure 8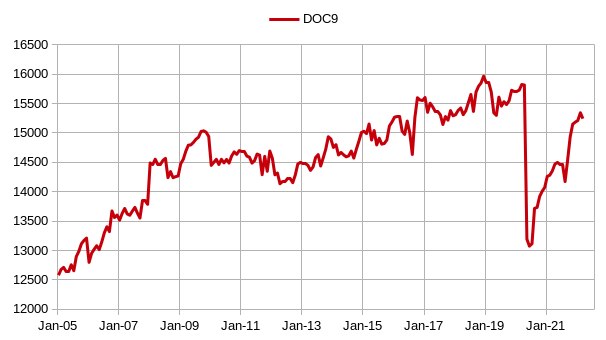
Charts below show the 9 countries, in some cases, two nations are shown on a single chart. Date is crude plus condensate (C+C) in kb/d and is from the US EIA.
The chart below shows all of OPEC + using EIA data.
Figure 9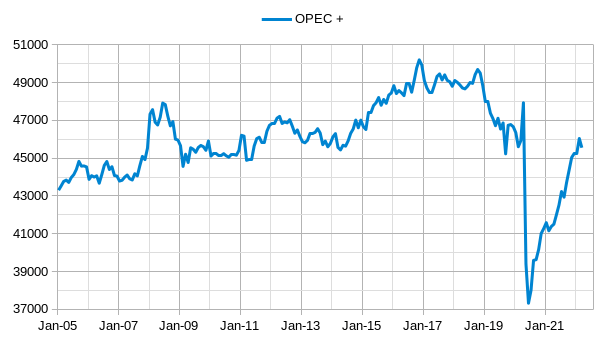
Chart below looks at OPEC+ plus the big 4 non-OPEC + producers, Brazil, Canada, China, and United States from Jan 2010 to Dec 2019, with OLS trend line shown.
Figure 10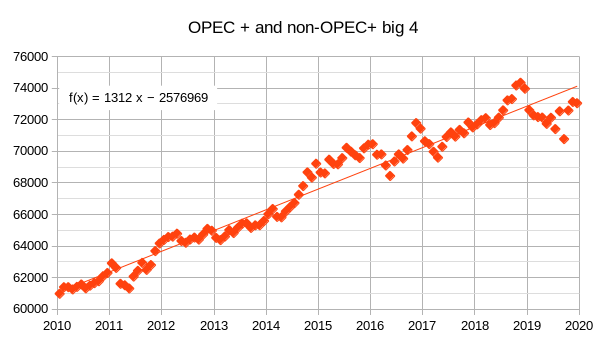
Final chart considers World C+C less (OPEC+ plus non-OPEC+ big4) and the OLS trend from Jan 2010 to March 2022.
Figure 11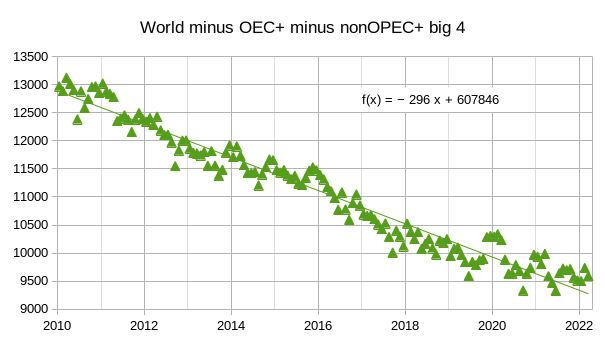
The annual decline rate is 296 kb/d and the exponential trend is an annual decline rate of 2.67%.
Editor’s Note: The summary bullets for this article were chosen by Seeking Alpha editors.
Be the first to comment