

Max Zolotukhin/iStock via Getty Images
This dividend ETF article series aims at evaluating products regarding the relative past performance of their strategies and quality of their current portfolios. As holdings and their weights change over time, reviews may be updated when necessary.
SDEM strategy and portfolio
The Global X MSCI SuperDividend Emerging Markets ETF (NYSEARCA:SDEM) has been tracking the MSCI Emerging Markets Top 50 Dividend Index since 03/16/2015. As of writing, it has 54 holdings, a 12-month trailing yield of 12.4% and a total expense ratio of 0.67%.
The net asset value (about $60 million) and the average trading volume (about 35k shares/day) are low for an ETF. This may be a concern for the fund’s survival on the long-term and its tradability on the short-term (using limit orders is absolutely necessary).
As described by MSCI, the underlying index “includes large and mid-cap stocks across 27 Emerging Markets (EM) countries*. The index aims to reflect the performance of 50 securities from the MSCI EM Index, selected by dividend yield that have increased or maintained their dividend per share compared to the previous year or have increased or maintained their payout ratio (defined as dividend per share/earnings per share) if the dividend per share has dropped by up to 10%”.
Constituents are in equal weight at every index reconstitution.
China is by far the heaviest country with 24.7% of asset value, followed by Brazil (12.5%). Other countries are below 10%. As of my latest review of this fund in November, Russia was number two with a weight over 13% of asset value. The fund had to drop Russian assets with heavy losses because of regulation relative to war in Ukraine. Geopolitical risks embedded in the portfolio still are very high: the aggregate weight of China, Taiwan and Hong-Kong is 35%.
SDEM countries (% weight) (Chart: author with GlobalX data)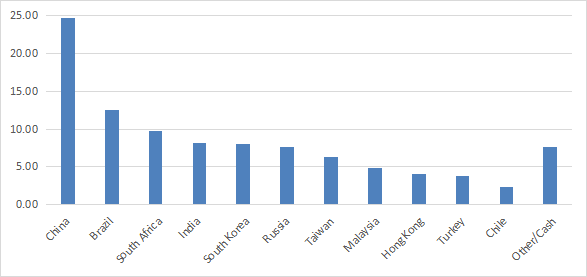
The heaviest sector is materials (29.2%), then come financials and energy (17.5% each). Other sectors are below 7%.
SDEM sectors (% weight) (Chart: author with GlobalX data)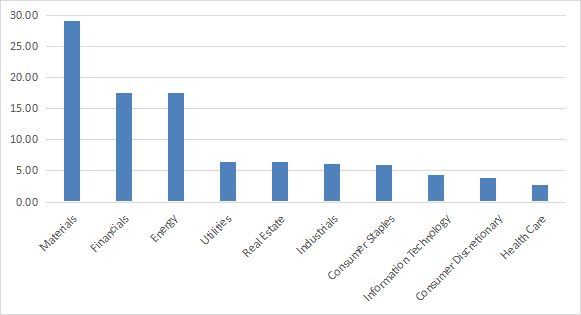
In size segmentation, large and mid-cap companies are 98% of asset value.
Size segments (chart: author; data: Fidelity )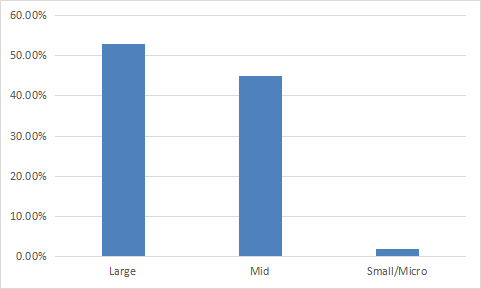
The top 10 holdings, listed below, represent about 24% of the portfolio value. Constituents are in equal weight every time the underlying index is reconstituted, but price variation may result in significant weight slippage. The top holding weighs 2.62% as of writing.
|
Name |
Ticker |
% of Net Assets |
|
YANKUANG ENRGY-H |
1171 HK |
2.62 |
|
EMPRESAS CMPC SA |
CMPC CI |
2.61 |
|
COAL INDIA LTD |
COAL IN |
2.61 |
|
LITE-ON TECHNOLOGY CORP |
2301 TT |
2.43 |
|
BIM BIRLESIK MAGAZALAR AS |
BIMAS TI |
2.41 |
|
SIME DARBY BERHAD |
SIME MK |
2.38 |
|
BHARAT PETROLEUM CORP LTD |
BPCL IN |
2.35 |
|
COMPAL ELECTRONICS |
2324 TT |
2.31 |
|
Cia Energetica de Minas G |
CMIG4 BZ |
2.3 |
|
CHINA POWER INTERNATIONAL |
2380 HK |
2.29 |
Past performance compared to competitors
The First Trust Dow Jones Global Select Dividend ETF (FGD), reviewed here, the WisdomTree Emerging Markets High Dividend Fund (DEM), reviewed here, and the WisdomTree Emerging Markets SmallCap Dividend Fund (DGS), reviewed here, are international dividend ETFs with lower (but still high) yields in a 5% to 8% range. SDEM has lagged all of them since inception by a wide margin. It is the only one in loss in this list for this time interval, and also the most volatile.
|
Total Return |
Annual Return |
Drawdown |
Sharpe ratio |
Volatility |
|
|
SDEM |
-18.89% |
-2.80% |
-47.00% |
-0.08 |
21.02% |
|
FGD |
25.06% |
3.08% |
-43.26% |
0.23 |
17.84% |
|
DEM |
21.29% |
2.65% |
-40.07% |
0.19 |
18.03% |
|
DGS |
35.15% |
4.17% |
-43.07% |
0.27 |
17.96% |
Data calculated with Portfolio123
In fact, SDEM has suffered a capital decay of 49% since inception, as shown on the share price chart below.
SDEM share price (TradingView on Seeking Alpha)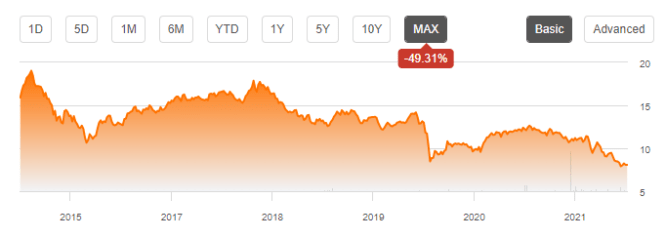
The full picture for an income-seeking investor is not pretty, considering the tax paid on distributions and inflation. The income stream is also likely to decrease in nominal value in the future: the yield cannot go up indefinitely to offset the capital decay.
Takeaway
SDEM is invested in 50 high-yield stocks listed in emerging markets. Its equal-weight policy and its balanced sector structure look good, but it has three red flags. First, low NAV and liquidity may threaten its own existence in the long-term. Second, 35% of asset value is exposed to geopolitical and regulatory risks related to China. Finally, the share price has lost 49% of its value since inception, and distributions have been very far from offsetting this loss. SDEM might be used as a trading instrument, but my opinion is that it should not be part of a sustainable retirement plan. This is true for a number of high-yield instruments, not only SDEM. For transparency, a dividend-oriented part of my equity investments is split between a passive ETF allocation and my actively managed Stability portfolio (14 stocks), disclosed and updated in Quantitative Risk & Value.
Be the first to comment