

THEPALMER
While it’s necessary to be patient when it comes to investing, it’s also true that, from time to time, you find a company that will appreciate significantly in a short period of time. Although a rare event, one great example that we can point to of this in action involves a company called Schneider National (NYSE:SNDR). With a market capitalization of $4.61 billion as of this writing, Schneider National is a fairly sizable player in the trucking and logistics space, providing trucking services, intermodal services, logistics activities, and more. Recently, financial performance achieved by the company has been really robust. Due to this strong performance, shares have risen materially in a short timeframe. Although it is true that the easy money for the company has already been made, I do think that some further upside likely exists. So because of this, I have decided to keep the ‘buy’ rating I had on the stock previously.
A fantastic ride
Back in late September of this year, I revisited Schneider National in an attempt to see whether or not the company offered investors attractive prospects. I lauded the company’s recent financial performance, particularly mentioning revenue and profit figures in light of broader economic concerns. I did say that investors would be wise to expect some deterioration to occur eventually because of the state of the economy. But because of how cheap shares were, I felt as though the risk-to-reward opportunity here was favorable enough to rate the company a ‘buy’. Since then, the company has performed even better than I would have anticipated. While the S&P 500 is up 10.6%, shares of this logistics company have generated a return for investors of 24.4%.
Author – SEC EDGAR Data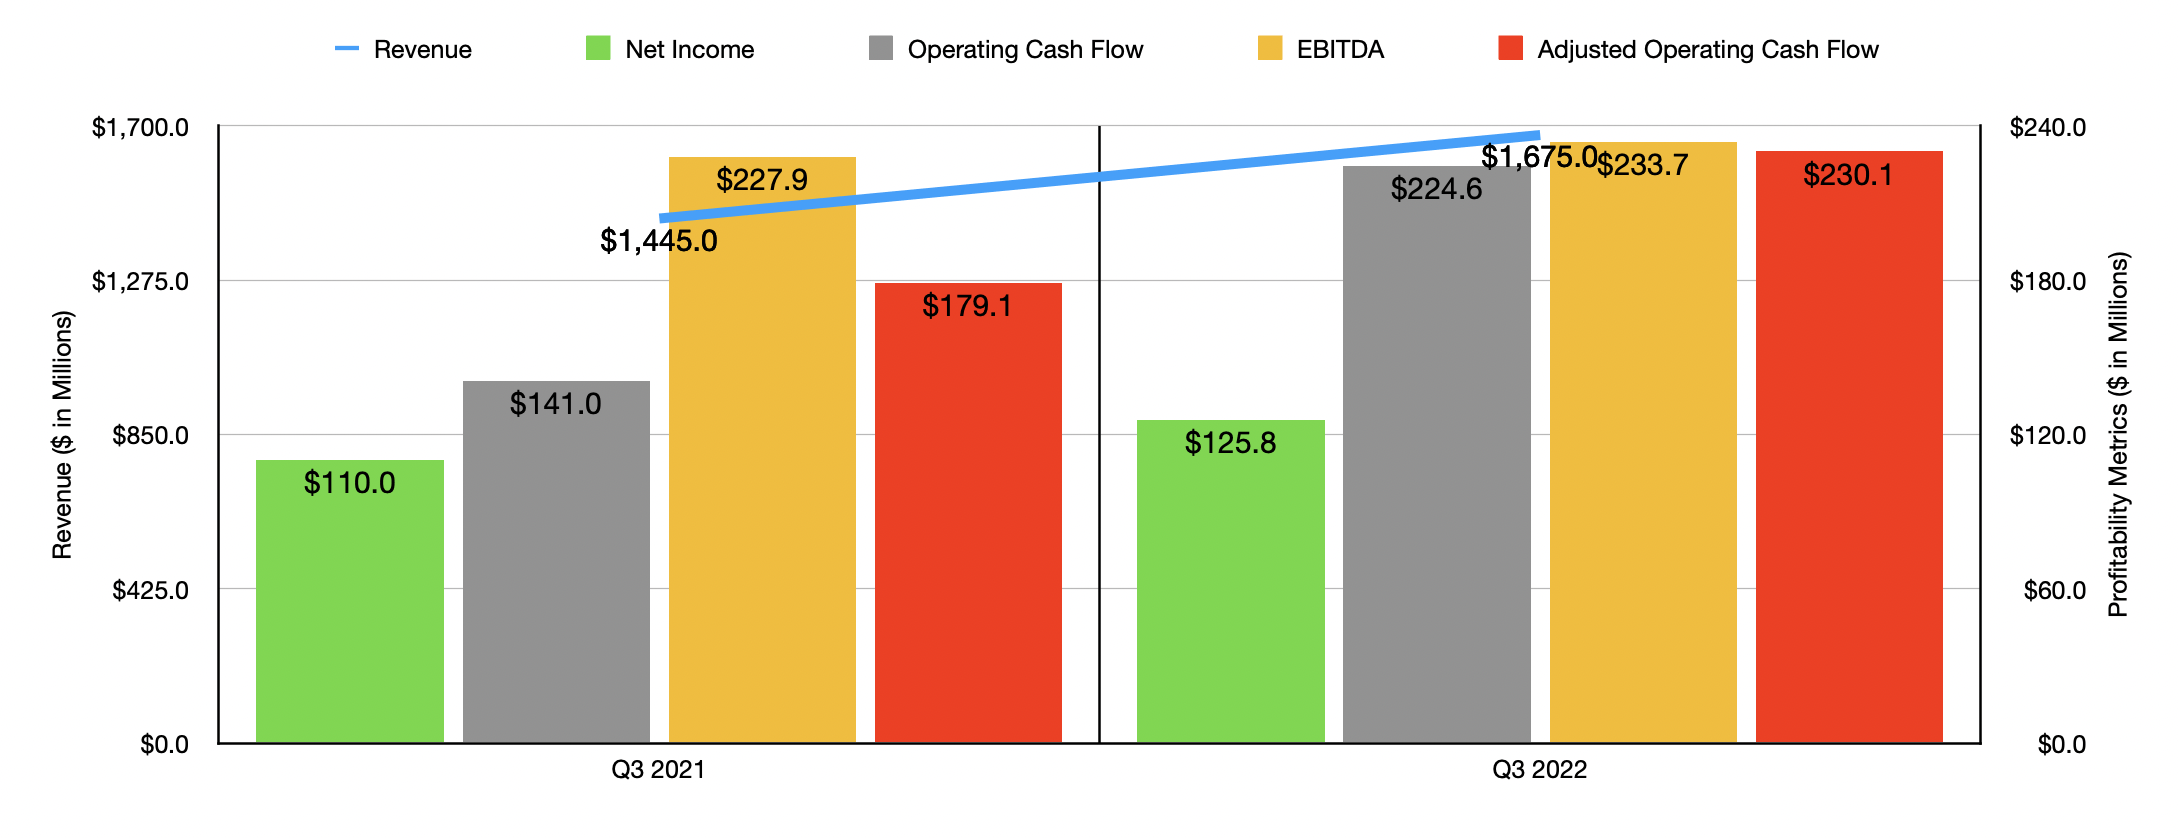
The only new data that has come out since I last wrote about the firm involves the third quarter of its 2022 fiscal year. During that quarter, sales came in at nearly $1.68 billion. That’s 15.9% higher than the $1.45 billion the company reported only one year earlier. It is worth mentioning that a sizable portion of this increase came from fuel surcharges. Removing these from the equation, you end up with revenue growth of 8.4% year over year. That is still an impressive figure no matter how you stack it. There were many different working parts behind this growth. For instance, under the dedicated operations of the company’s Truckload segment, revenue, excluding fuel server charges, jumped by 50.3% from $204 million to $306.7 million. This was driven by a rise in the average number of trucks from 4,240 to 6,020 and from an increase in average revenue per truck per week from $3,706 to $3,925. Network revenue figures actually declined as the average number of trucks dropped, but some of this drop was offset by higher revenue per truck per week. Under the Intermodal segment, revenue per order rose from $2,624 to $2,936, while the number of trucks increased from 1,569 to 1,691. This was instrumental in pushing revenue under that segment up from $295.7 million to $334.7 million.
The jump in revenue for the company also brought with it improved profitability. Net income rose from $110 million to $125.8 million. We should also pay attention though to other profitability metrics. As an example, operating cash flow for the company jumped, popping from $141 million to $224.6 million. Even if we adjust for changes in working capital, we would have seen a nice increase, with a metric climbing from $179.1 million to $230.1 million. Perhaps the metric that showed the least impressive results was EBITDA. According to the data available, it grew from $227.9 million to $233.7 million. Interestingly, all of these profit figures came at a time when the aggregate income from operations for the company’s segments actually dropped, falling from $153.7 million to $145.4 million. The big driver was actually a $25.9 million pre-tax gain on the company’s equity investments during the quarter. That compared to a $3.1 million pre-tax net loss experienced only one year ago.
Author – SEC EDGAR Data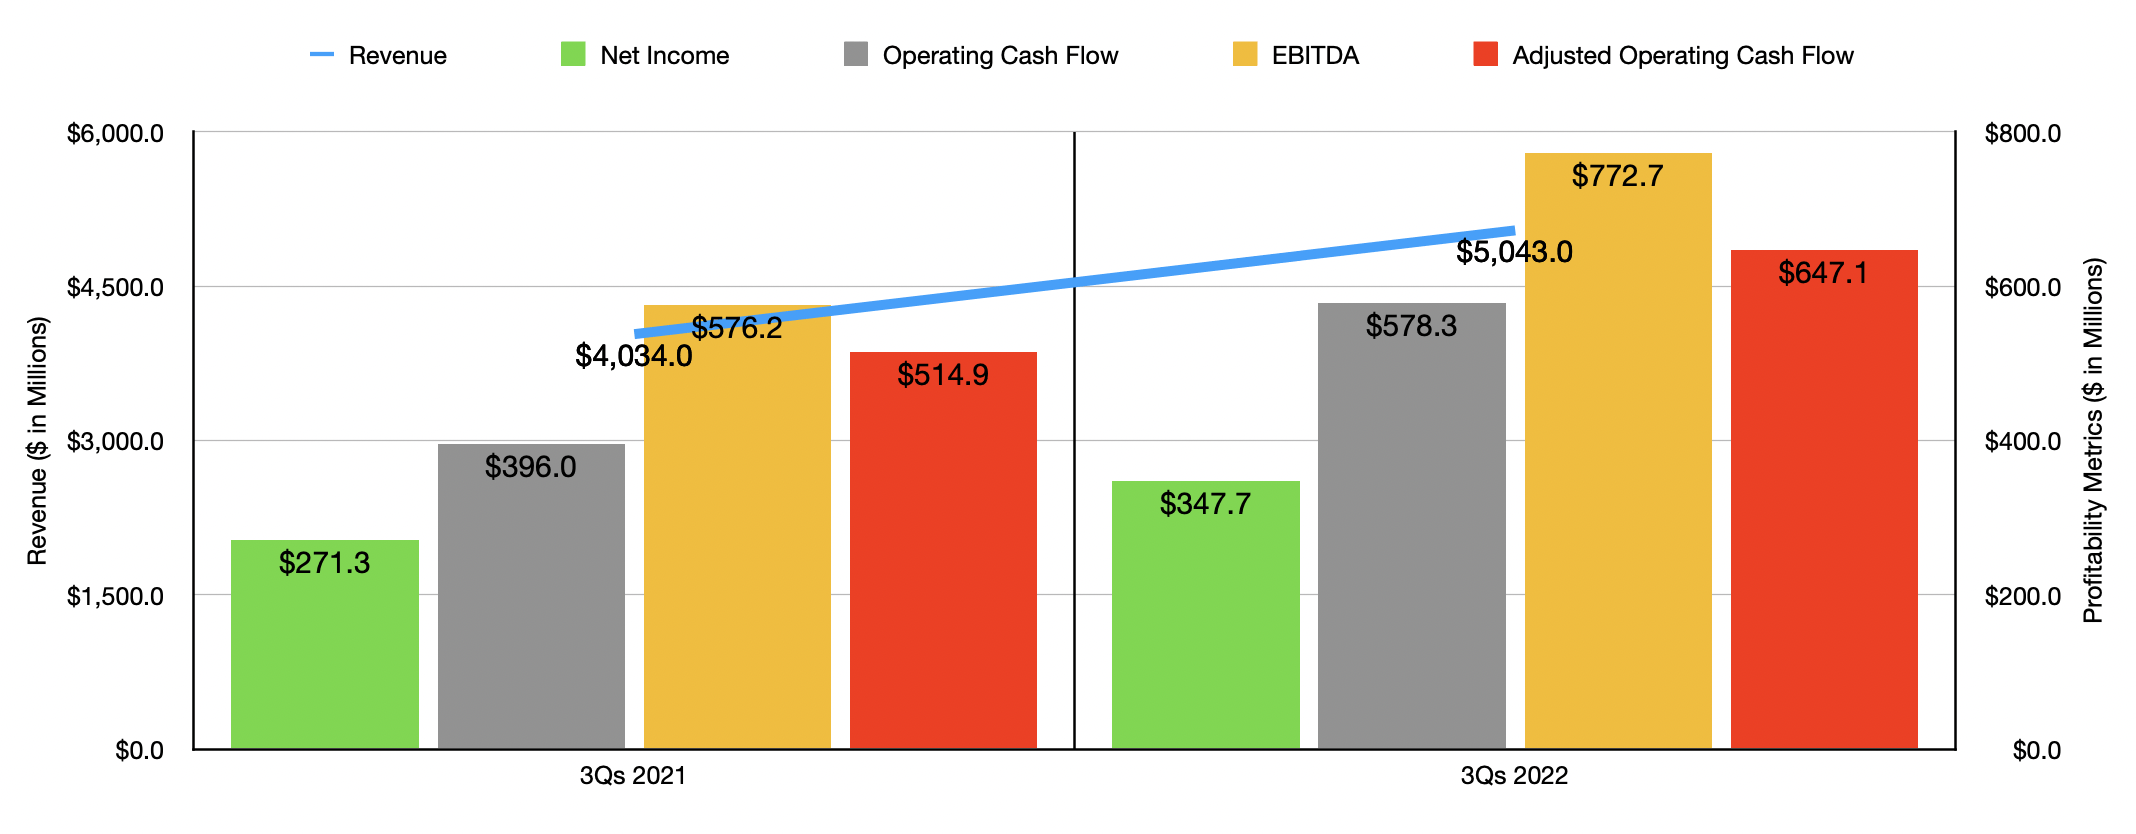
Thanks to the third quarter, the company has continued its impressive track record for 2022 as a whole. For the first nine months of the year, the company generated a revenue of $5.04 billion. That beat the $4.03 billion reported only one year earlier. Net income jumped from $271.3 million to $347.7 million. Operating cash flow popped up from $396 million to $578.3 million, while the adjusted figure for it grew from $514.9 million to $647.1 million. Also on the rise was EBITDA, with the metric climbing from $576.2 million to $772.7 million.
Author – SEC EDGAR Data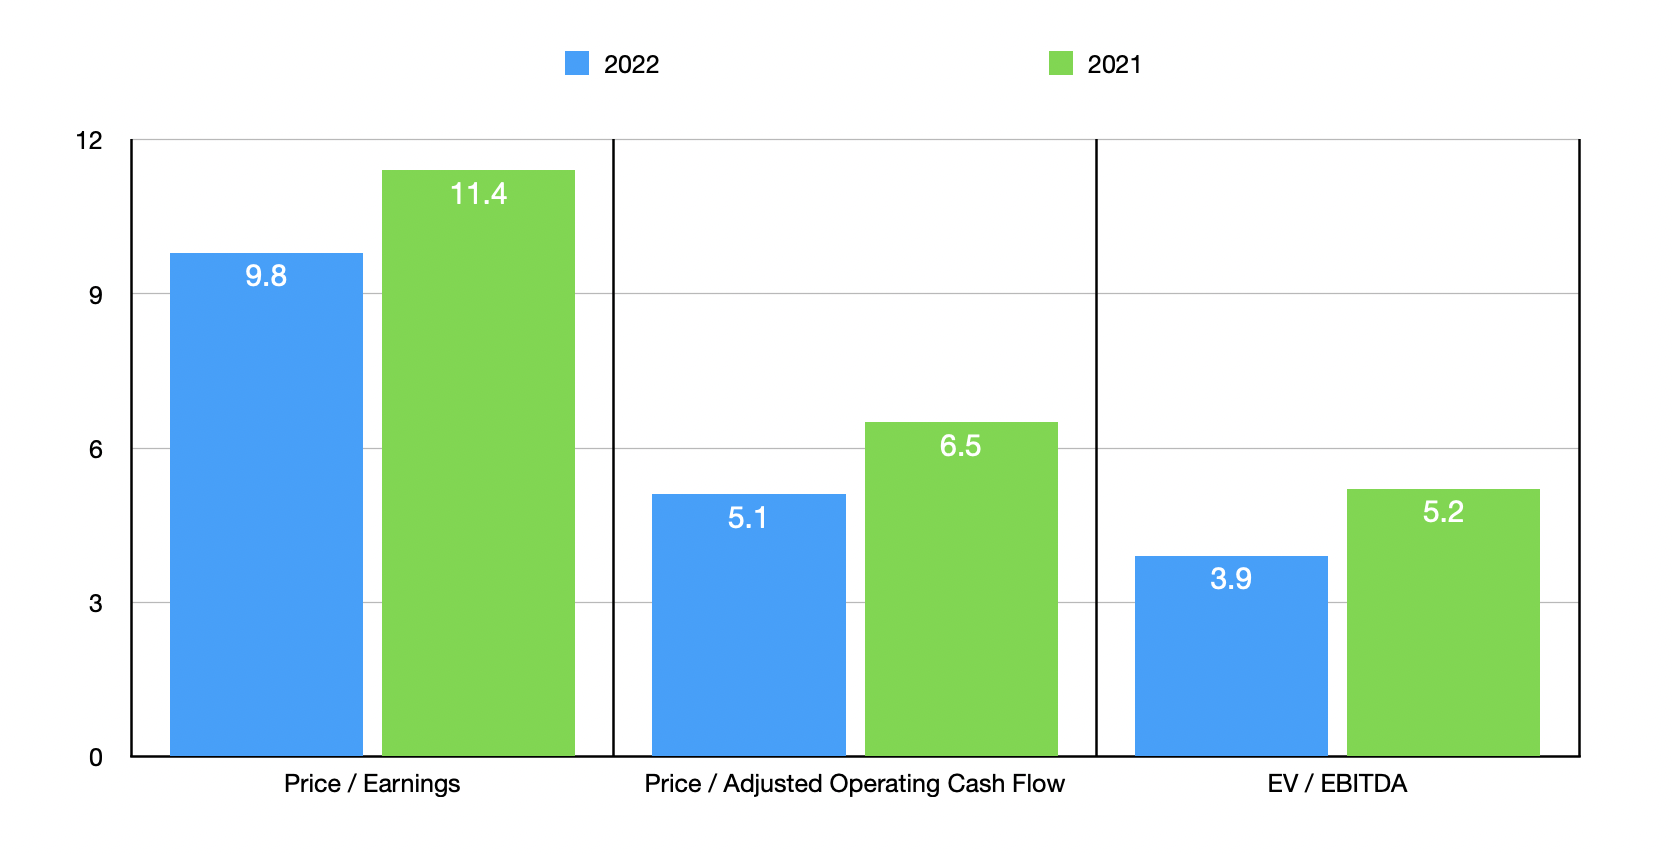
When it comes to 2022 in its entirety, management is now forecasting earnings per share of between $2.60 and $2.65. At the midpoint, that would translate to a net income of $469.1 million. If we annualize results experienced for the first nine months of the year across the other profitability metrics, we should anticipate an adjusted operating cash flow of $897.9 million and EBITDA of $1.15 billion. Based on these numbers, the company is trading at a forward price-to-earnings multiple of 9.8. It’s also trading at a forward price to adjusted operating cash flow multiple of 5.1 and at a forward EV to EBITDA multiple of 3.9. As you can see in the chart above, even a return to the levels of profitability seen in 2021 would still result in the company looking affordable. As part of my analysis, I also compared the company to five other logistics firms. On a price-to-earnings basis, these companies range from a low of 5.6 to a high of 17.6. In this case, two of the five companies were cheaper than Schneider National. On a price-to-operating cash flow basis, the range was from 2.1 to 13.8. In this case, only one of the five companies was cheaper than our target. And when it comes to the EV to EBITDA approach, the range was from 3.3 to 9.8. In this case, one of the companies was cheaper, while another was tied with it.
| Company | Price / Earnings | Price / Operating Cash Flow | EV / EBITDA |
| Schneider National | 9.8 | 5.1 | 3.9 |
| Ryder System (R) | 5.6 | 2.1 | 3.3 |
|
Saia (SAIA) |
17.6 | 13.8 | 9.8 |
| XPO Logistics (XPO) | 5.0 | 5.9 | 3.9 |
| Werner Enterprises (WERN) | 11.2 | 7.0 | 5.2 |
| Landstar System (LSTR) | 14.2 | 12.9 | 9.3 |
Takeaway
Because of the capital intensity of the trucking industry and the fact that it is highly susceptible to changes in economic conditions, I understand why a lot of investors might stay away from the space. At the end of the day though, you have to work for where value exists and adapt accordingly if you want the best returns possible. So far, Schneider National has done exceptionally well and I fully expect that trend will continue in the long run. Yes, we very well will see volatility from time to time. But given how cheap shares are right now, I believe that some further upside is still on the table.
Be the first to comment