

sommart
Dividend Growth Watchlist Criteria
The companies listed on this watchlist are stable with a track record of raising their dividends consistently. The company must also have a “Wide” economic moat, according to Morningstar. This ensures a company I consider for investment has a sustainable competitive advantage for the foreseeable future. An S&P Capital IQ Earnings and Dividend Ranking of A or A+ helps to establish the company has achieved and should continue to achieve lower price volatility when compared to the broader market.
Next, since this is a dividend growth watchlist, it would logically make sense to measure a company’s dividend growth. In this case, a company needs to have a 10-year dividend growth rate of 10% or greater to ensure growth in the dividend itself, in addition to being a quality company. The company should have room to grow their dividend too, so a payout ratio of 50% or less is used as the final filter.
I use the dividend yield theory to determine if a stock is potentially overvalued or undervalued. This idea suggests a company’s yield will revert to the norm over time. An example below is Texas Instruments Inc. (TXN) – the current yield is 2.75% while its five-year average is just 2.36%. The difference being 39 basis points or about 17%, which suggests it could be undervalued.
| Company | 10 Year DGR | Dividend Yield (11/30/22) |
Div. Yield (5 Year Avg.) |
Overvalued / Undervalued |
| Accenture PLC (ACN) | 11.13% | 1.49% | 1.35% | -10% |
| Applied Materials Inc (AMAT) | 11.39% | 0.95% | 1.31% | 27% |
| Amphenol Corp (APH) | 45.43% | 1.04% | 0.86% | -21% |
| Bank of New York Mellon Corp (BK) | 10.48% | 3.22% | 2.26% | -42% |
| Costco Wholesale Corp (COST) | 12.25% | 0.67% | 0.74% | 9% |
| Graco Inc (GGG) | 10.10% | 1.20% | 1.09% | -10% |
| Home Depot Inc (HD) | 20.30% | 2.35% | 2.07% | -14% |
| Lockheed Martin Corp (LMT) | 12.55% | 2.47% | 2.70% | 9% |
| Lowe’s Companies Inc (LOW) | 18.11% | 1.98% | 1.53% | -29% |
| Mastercard Inc (MA) | 40.16% | 0.55% | 0.50% | -10% |
| Microsoft Corp (MSFT) | 11.70% | 1.07% | 1.15% | 7% |
| Northrop Grumman Corp (NOC) | 12.08% | 1.30% | 1.63% | 20% |
| Roper Technologies Inc (ROP) | 17.01% | 0.62% | 0.52% | -19% |
| Sherwin-Williams Co (SHW) | 16.28% | 0.96% | 0.77% | -25% |
| Thermo Fisher Scientific Inc (TMO) | 22.63% | 0.21% | 0.23% | 9% |
| Texas Instruments Inc | 22.35% | 2.75% | 2.36% | -17% |
| US Bancorp (USB) | 13.15% | 4.23% | 2.83% | -49% |
| Visa Inc (V) | 21.16% | 0.83% | 0.63% | -32% |
Goal
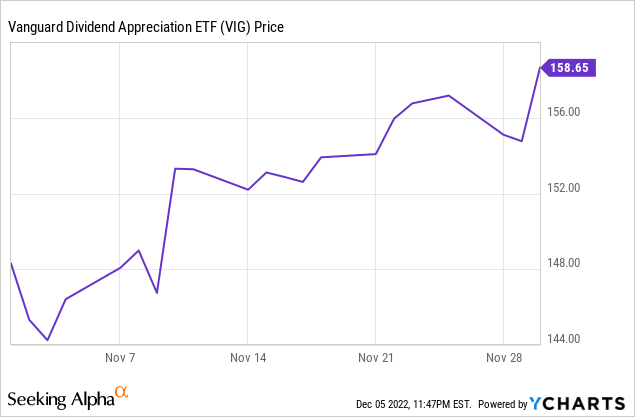
The goal of my dividend growth watchlist is to discover companies to add to my dividend growth portfolio in an attempt to consistently exceed the market return of the Vanguard Dividend Appreciation ETF (VIG). Through November of this year, an equally weighted portfolio of these 18 stocks mentioned above would have underperformed VIG by about 2%. VIG has lost 6.31% through November, while the stocks above lost 8.38%.
| Symbol | November Returns | YTD Return through November |
| ACN | 6.00% | -26.42% |
| AMAT | 24.44% | -29.71% |
| APH | 6.07% | -7.25% |
| BK | 9.00% | -18.45% |
| COST | 7.53% | -4.38% |
| GGG | 0.56% | -12.07% |
| HD | 10.05% | -19.98% |
| LMT | 0.31% | 40.05% |
| LOW | 9.03% | -16.25% |
| MA | 8.60% | -0.23% |
| MSFT | 10.22% | -23.42% |
| NOC | -2.54% | 39.76% |
| ROP | 5.87% | -10.25% |
| SHW | 11.01% | -28.57% |
| TMO | 9.00% | -15.90% |
| TXN | 12.35% | -1.59% |
| USB | 6.93% | -16.74% |
| V | 4.99% | 0.91% |
| VIG | 6.75% | -6.31% |
Final Thoughts
This dividend growth watchlist is used to identify companies worthy of further research. Stock prices fluctuate continuously, and although there are legitimate reasons for a price increase or decrease, occasionally there are times the market is just overreacting to a short-term issue. I believe if you can identify the reason(s) and determine for yourself if a decline in stock price is justified, you can minimize risk in your portfolio by purchasing a company’s stock when their yield is higher than average.
Be the first to comment