


Richard Drury
Author’s note: This article was released to CEF/ETF Income Laboratory members on August 26th, 2022.
The Schwab U.S. Dividend Equity ETF (NYSEARCA:NYSEARCA:SCHD) and the Vanguard High Dividend Yield ETF (NYSEARCA:NYSEARCA:VYM) are two of the largest, most well-known U.S. dividend equities ETFs in the market. Due to their popularity and reader interest, I thought to do an article comparing the funds, their holdings, fundamentals, and expected performance.
Both funds offer investors diversified exposure to U.S. dividend equities, with investments in at least one hundred securities, and with exposure to all relevant industry segments. As with most dividend equity funds, both are overweight old-economy industries like financials and industrials, while being underweight tech, although less so for SCHD compared to VYM. Both funds sport above-average yields, SCHD yields 3.3% while VYM yields 3.0%, and have strong dividend growth track-records too. SCHD’s overall performance track-record is stronger, but VYM has outperformed these past few months.
Although both funds are broadly similar investment opportunities, SCHD’s stronger dividend growth and consistent performance track-record make it the slightly superior choice. In my opinion, at least.
As an aside, Vanguard has another popular, well-known U.S. dividend equity index ETF, the Vanguard Dividend Appreciation ETF (VIG). Comparing SCHD with VIG would have made for a really interesting article too, in my opinion at least. I chose VYM over VIG, due to reader/editorial interest, and as VIG only yields 1.90%.
Strategy and Holdings Comparison – Tie
SCHD and VYM are both equity index ETFs, investing in a diversified portfolio of dividend-paying U.S. equities with above-average yields. Although both funds have broadly similar strategies and holdings, there are some important differences in investment and index methodologies.
VYM is a simple fund, investing in the 50% highest-yielding large-cap U.S. equities. As with most index funds, securities must also meet a basic set of liquidity, trading, size, etc., criteria, but these are quite lax. The resultant portfolio is incredibly well-diversified, with investments in over 400 equities. VYM’s holdings include most well-known blue-chip dividend stocks, including Johnson & Johnson (JNJ), AbbVie (ABBV), and Coca-Cola (KO). These are strong companies with above-average yields, but rarely the highest. The fund’s top 10 holdings are as follows.
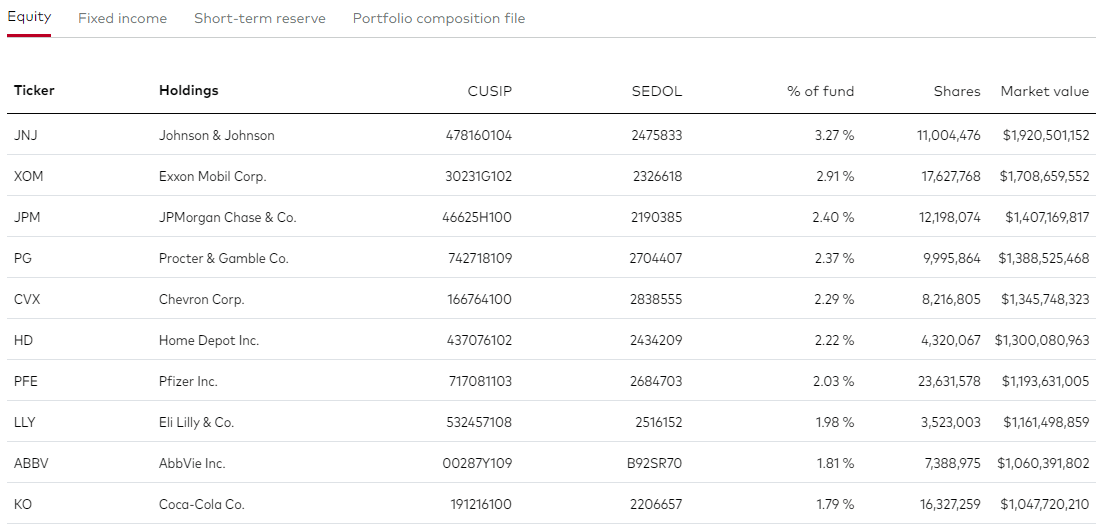
VYM
VYM provides investors with exposure to most relevant industries. Compared to broader equity indexes, the fund is overweight old-economy industries with above-average yields, including financials and consumer staples, while being underweight low-yield tech. Industry exposures are as follows.
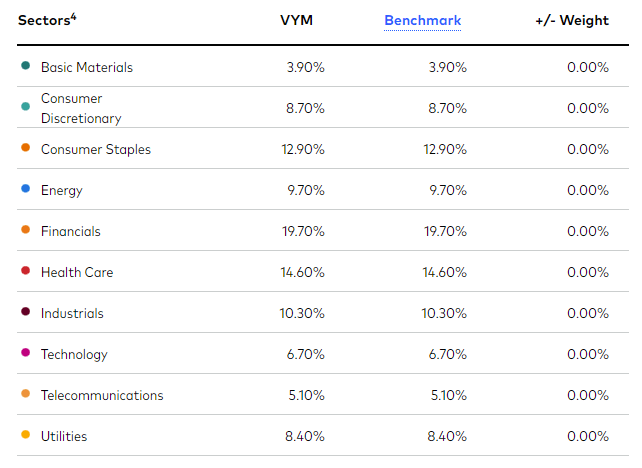
VYM
SCHD invests in the 100 U.S. equities with the strongest combination of dividend yield, dividend growth, return on equity, and free cash flow to debt. So, 100 companies with good yields and solid fundamentals. As with most index funds, securities must also meet a basic set of liquidity, trading, size, etc., criteria. SCHD is less diversified than VYM, with investments in only 100 companies. As with VYM, these are generally blue-chip dividend stocks, including Texas Instruments (TXN), Coca-Cola, and Pfizer (PFE). As with VYM, these are generally strong companies with above-average yields, but rarely the highest. The fund’s top 10 holdings are as follows.
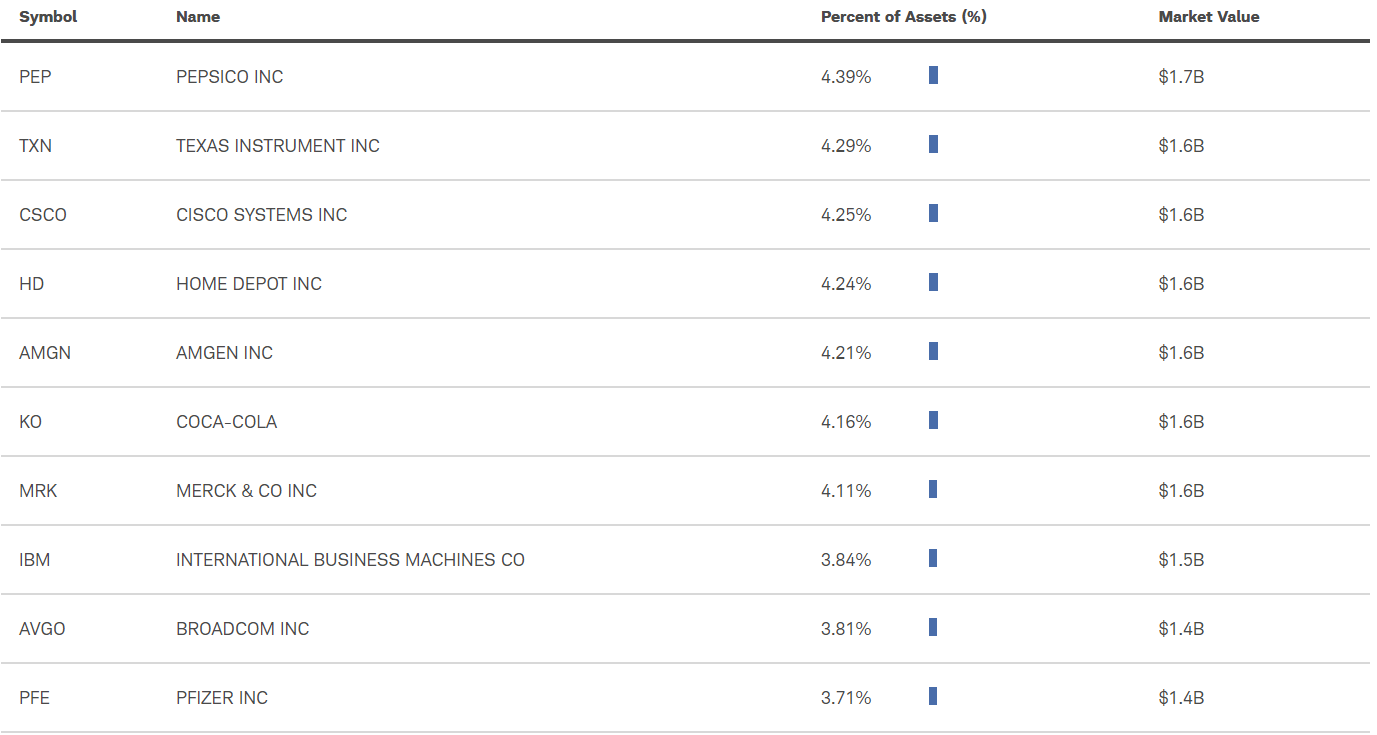
SCHD
VYM’s index is broader, while SCHD is narrower. As such, VYM includes most of SCHD’s holdings, but SCHD does not include most of VYM’s holdings. VYM’s broader, more diversified holdings reduce portfolio risk and volatility, and are a benefit for the fund and its shareholders. As such, VYM is the clear choice for investors looking for as much diversification as possible.

Etfrc.com
SCHD is somewhat less underweight tech/overweight old-economy industries than the average dividend-focused fund.. As such, SCHD’s industry exposures are much closer to those of most U.S. equity indexes, including the S&P 500. Industry exposures are as follows.
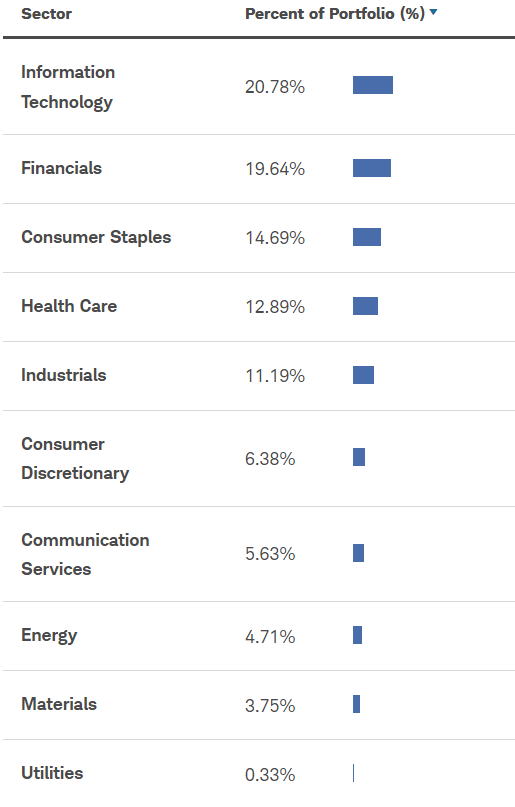
SCHD
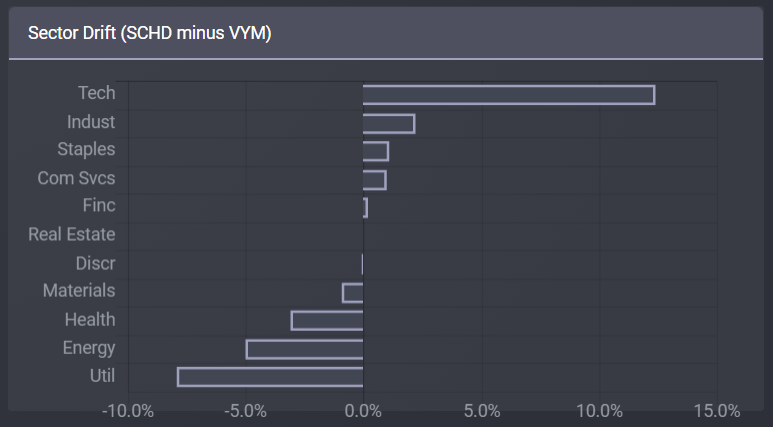
Comparing industry exposures between SCHD and VYM is consistent with the above. SCHD holds more tech than VYM, but less utilities, energy, and health.
etfrc.com
Differing industry exposures has important implications for investors.
VYM’s underweight tech position means that the fund’s performance relative to SCHD, as well as other broader equity indexes, is strongly dependent on the relative performance of tech. VYM should outperform when tech underperforms, as has been the case YTD, during which tech valuations have started to normalize.
SCHD and VYM have different industry weights, with important implications for shareholders. Although neither set of weights is strictly superior to the other, I’m much more partial to SCHD’s weights. Most dividend equity funds are underweight tech, so it is sometimes difficult for dividend investors to achieve sufficient exposure to said industry. SCHD is not significantly underweight tech, so it does not have these issues. This is somewhat rare for a dividend equity fund, meaning SCHD’s performance more closely tracks that of broader equity indexes, and is a benefit for SCHD and its shareholders.
Both SCHD and VYM are broadly similar funds, but VYM is more diversified, while SCHD’s industry weights are closer to the index average. In my opinion, on net, no fund has a clearly superior strategy or set of holdings.
Dividend Analysis – SCHD Clear Winner
Both funds focus on U.S. equities with above-average yields, so both funds yield moderately higher than average. SCHD currently yields 3.3%, slightly higher than VYM, with a 3.0% yield. SCHD’s slightly higher yield is due to the fund focusing on a smaller number of stocks. VYM is more diversified, which means investing in more companies with good, but not great, yields. Both funds yield more than the equity market average, as expected.
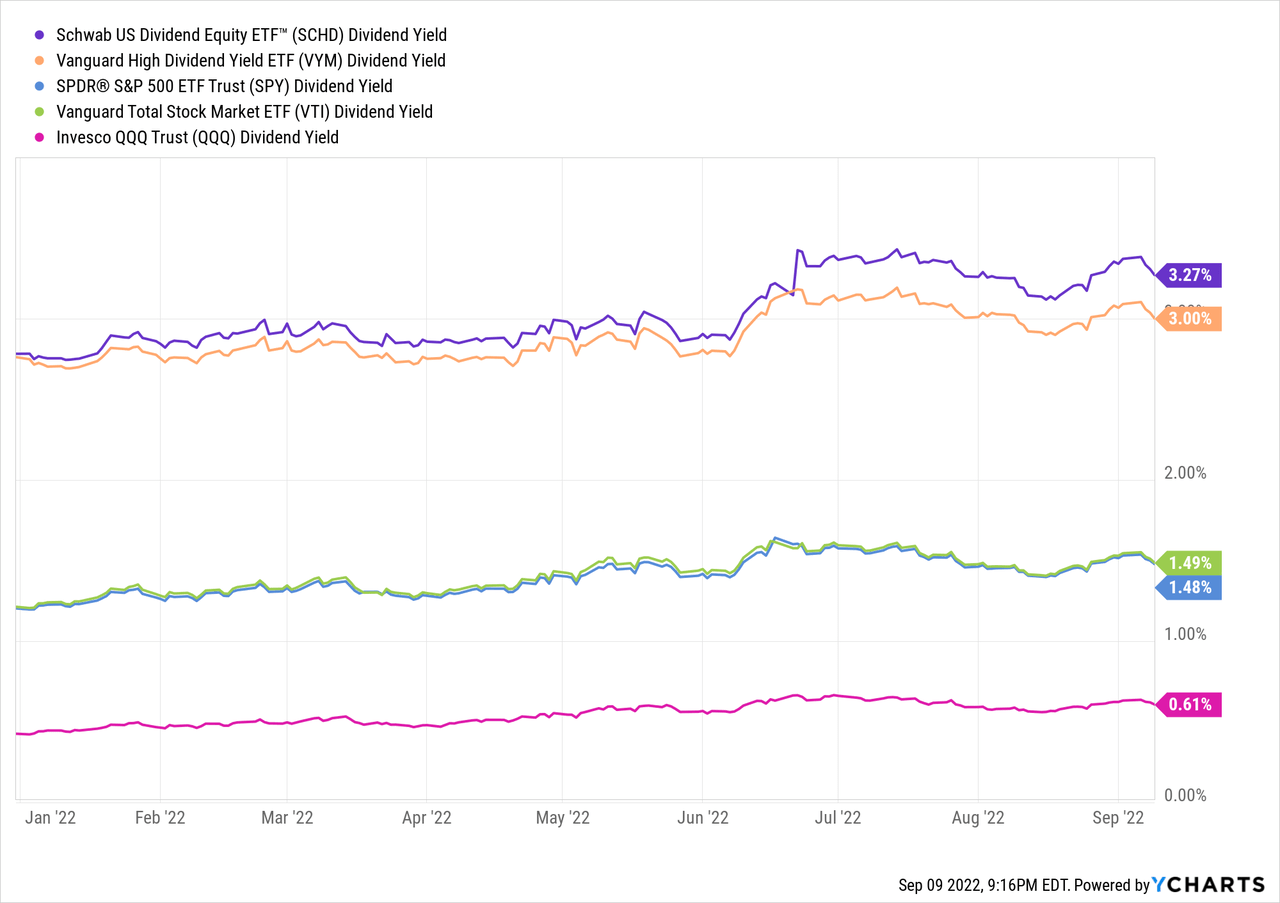
Strong dividend yields directly boost shareholder returns, and are a benefit for both funds and their shareholders. Although SCHD’s yield is slightly higher than that of VYM, the difference is quite small, and not terribly material. Where SCHD really shines is in its dividend growth track-record.
As mentioned previously, SCHD’s underlying index takes into consideration four fundamental criteria when selecting stocks for its portfolio. One of these is dividend growth and, from what I’ve seen, it is the dominant criteria. SCHD’s dividend growth track-record is outstanding, with the fund’s dividend growing at double-digit rates since inception, and for most relevant time periods. As an aside, disregard the 10Y growth figure below, growth was due to dividend volatility plus starting from a very low base.
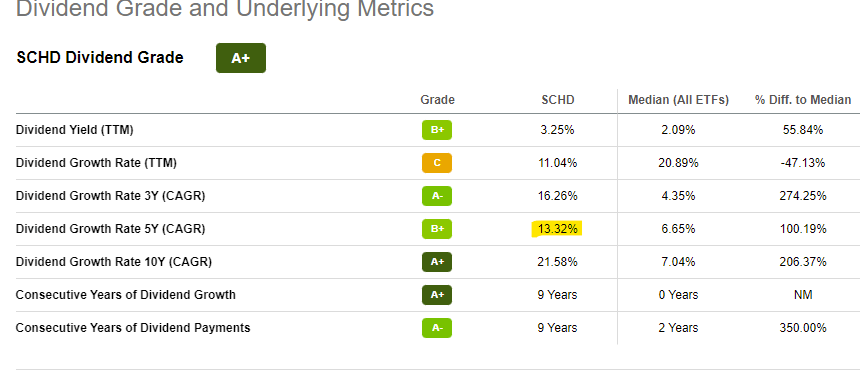
SeekingAlpha
VYM’s dividend growth track-record is quite good too, but pales in comparison to that of SCHD. VYM’s dividends have grown by around 9% per year during the past decade, with similar figures for most other relevant time periods. Growth is slower than SCHD, but the gap has been narrowing.
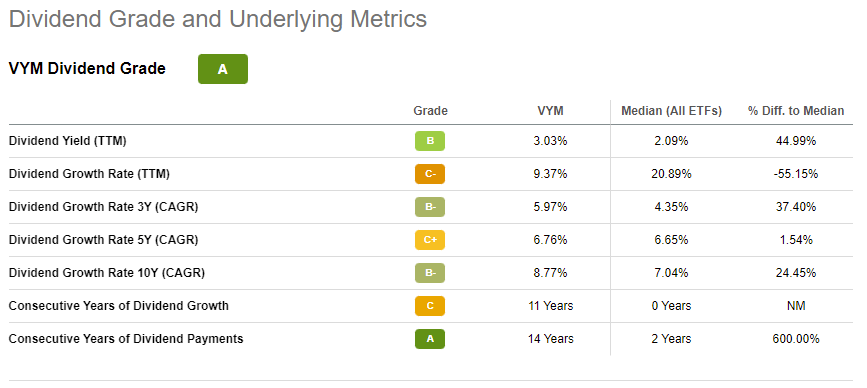
SeekingAlpha
Although SCHD’s dividends only grow 4.5% faster than VYM’s dividends, growth compounds fast. One year of 4.5% higher dividend growth means little, ten years of higher growth means a lot, and SCHD’s dividend growth has outpaced that of VYM for a decade, and counting. SCHD’s strong dividend growth track-record is a significant benefit for the fund and its shareholders, and a key advantage relative to VYM.
Strong dividend growth is a benefit for all investors, but particularly important for long-term dividend growth investors, who see very strong yield on costs from holding SCHD for long periods of time. As an example, the fund’s dividends have more than doubled in the past ten years, with the fund boasting a 10Y yield on cost of 8.3%, a very strong figure. VYM’s dividend growth is slower, so the fund’s yield on cost figures are lower too, for all relevant time periods.
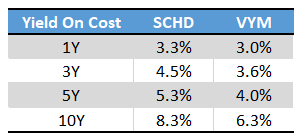
SeekingAlpha – Chart by Author
Importantly, the figures above do not take into consideration the re-investment of dividends. SCHD’s investors would have seen double-digit yield on costs in eight, nine years if they had re-invested their dividends, an incredibly strong figure. Do remember that these are equity funds, so capital gains are very strong too. We are discussing (potential) double-digit yield on costs for long-term investors in addition to healthy capital gains too. Very few funds offer such a strong value proposition, but SCHD does. VYM could, potentially, offer the same, but only for the most long-term investors, and is materially weaker than SCHD in this regard.
Although both funds offer investors above-average yields and good dividend growth track-records, SCHD is stronger on both counts, especially the latter.
Performance Track-Record – SCHD Slight Advantage
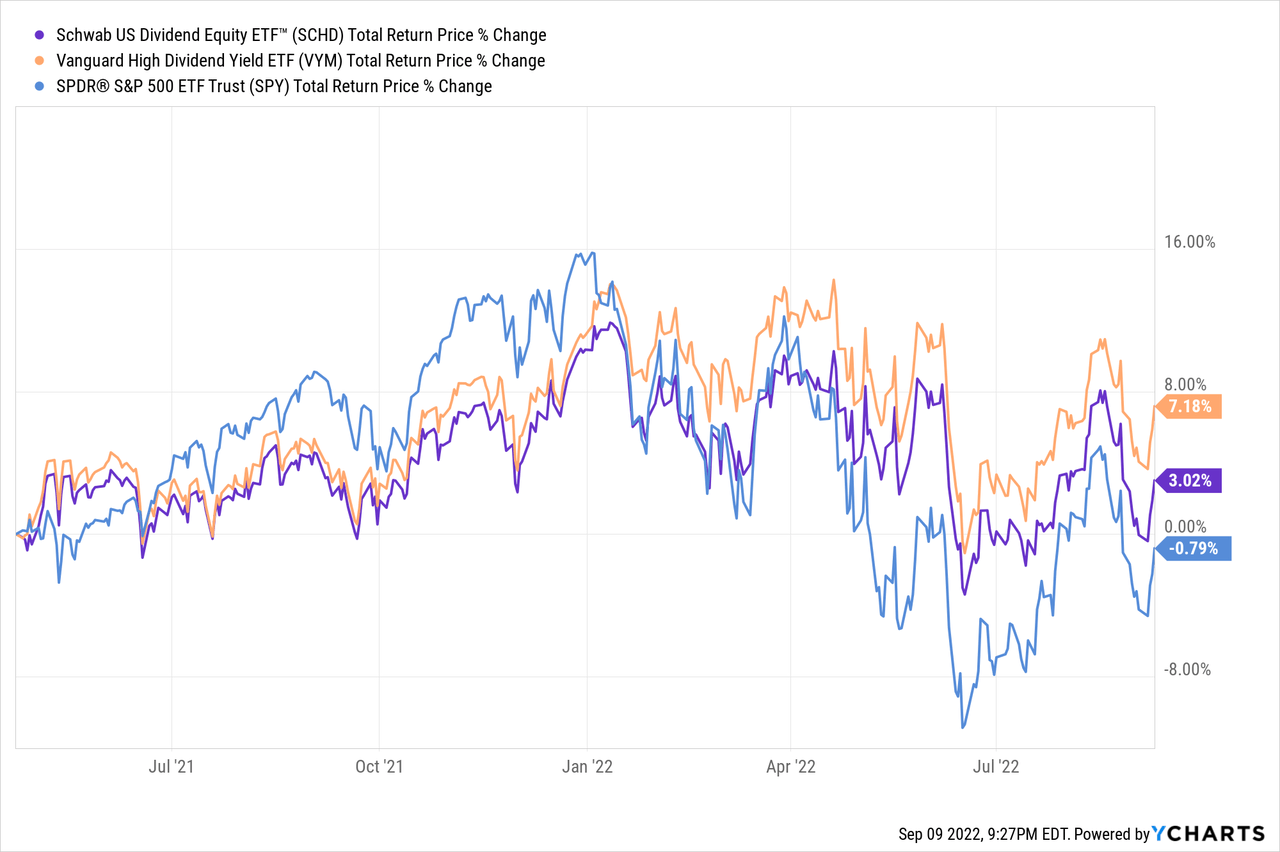
SCHD’s overall performance track-record is quite strong. VYM’s performance is materially weaker, but could be characterized as fair, and has improved as of late.
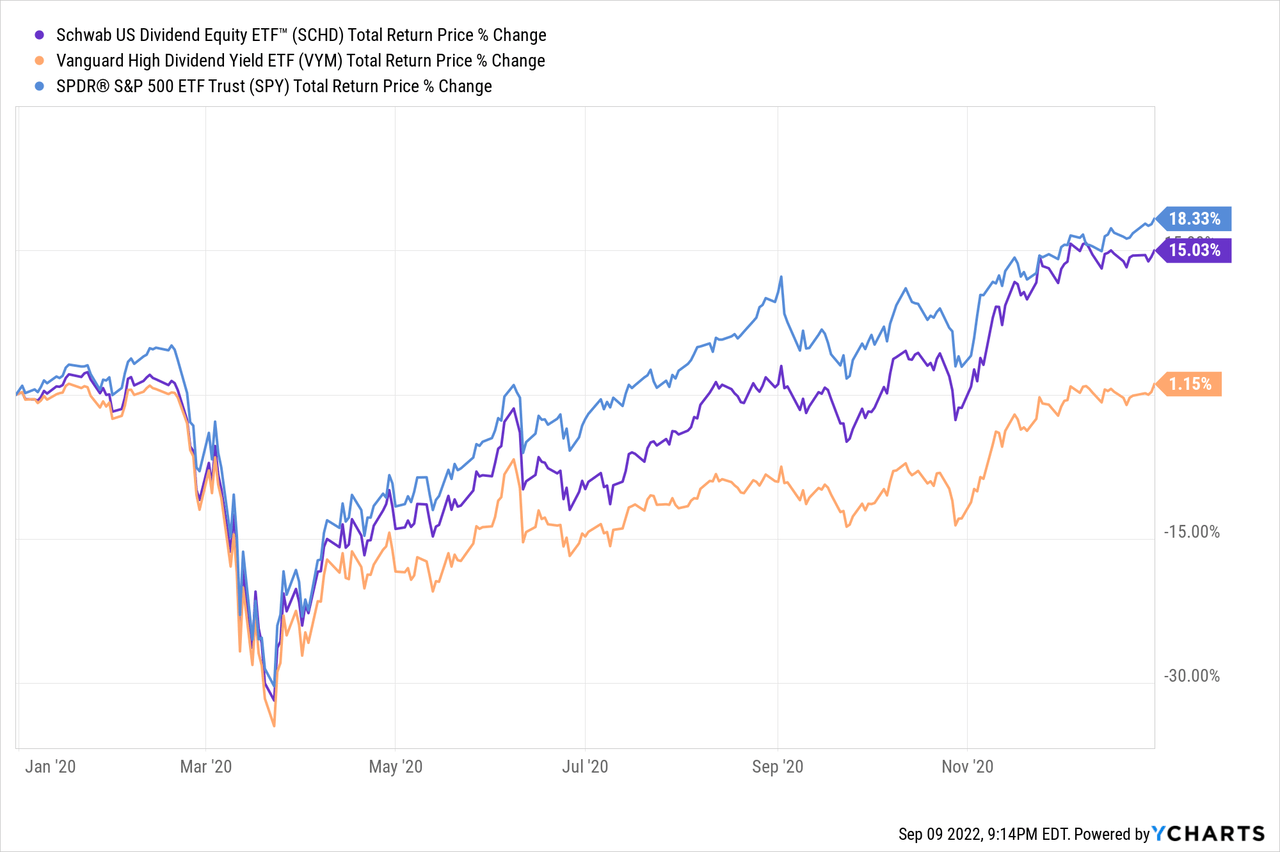
SCHD itself generally matches, if not surpasses, the performance of the S&P 500. It is also one of the best-performing dividend equity ETFs in the market, since inception, and for most relevant time periods too. SCHD’s outperformance is partly due to the fund’s comparatively larger/less underweight tech position, and partly due to the past effectiveness and strength of its index and strategy. SCHD tends to select stocks and industries with above-average performance, at least relative to other dividend equity funds.
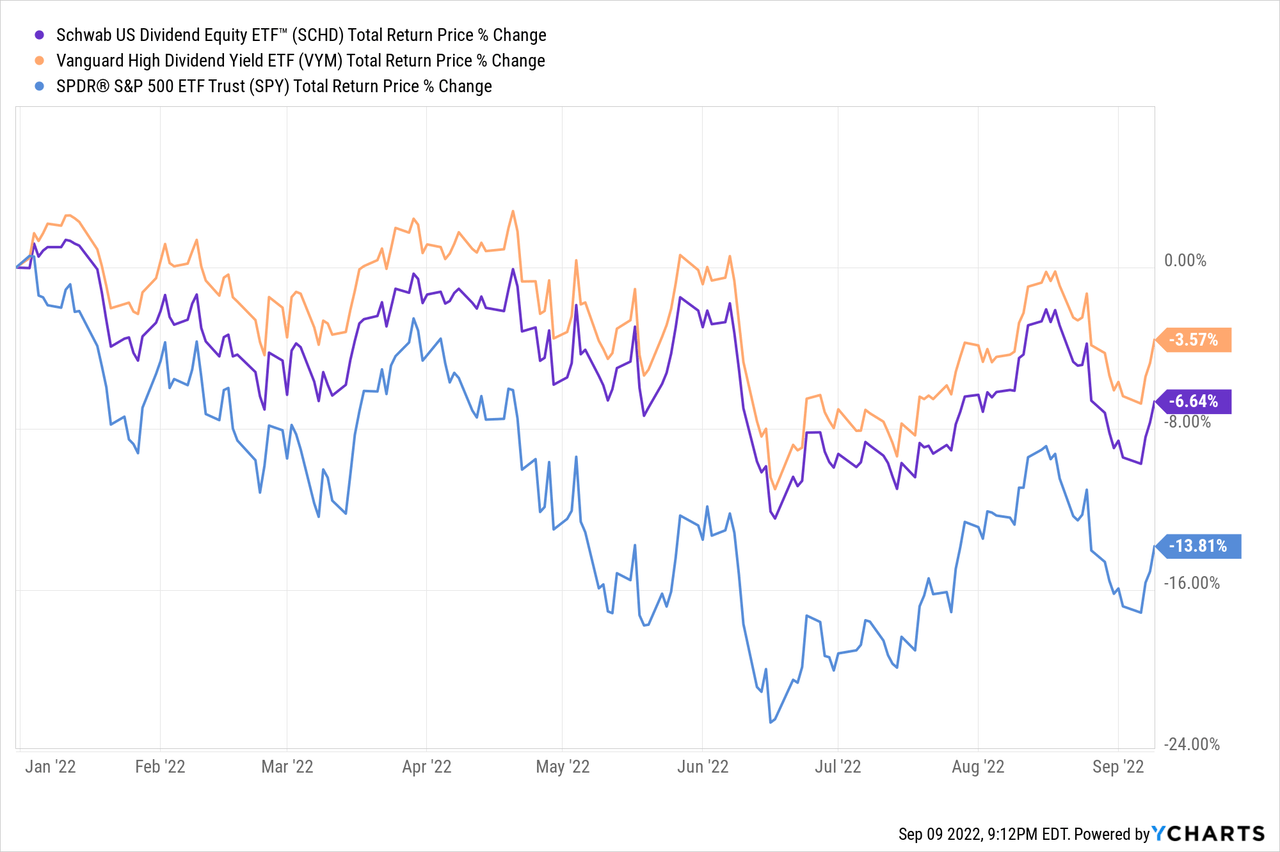
VYM’s performance track-record is much more mixed, and materially weaker than that of SCHD. VYM has slightly underperformed relative to the S&P 500 since inception, and for most relevant time periods. The fund’s underperformance is almost completely explained by its underweight tech position. Tech has soared in the past decade, VYM invests little in tech, so VYM experienced below-average gains. Importantly, tech has lagged behind the broader market for the past twelve months, during which VYM has outperformed, as expected.
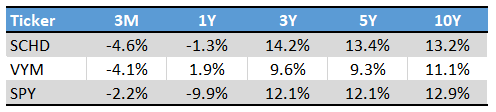
ETF.com – Chart by author
In my opinion, SCHD’s stronger performance track-record is only a small advantage relative to that of VYM. SCHD’s performance was at least partly the result of a higher tech allocation, and it is not obvious to me that tech will continue to outperform moving forward. Tech has not outperformed for months now, and SCHD’s performance relative to VYM has suffered as a result. Future performance could materially differ from past performance, as is always the case.
Valuation Analysis – VYM Slight Winner
Both funds sport cheaper valuations than average. Cheap valuations are a benefit for both funds and their shareholders, and could lead to significant capital gains and market-beating returns if valuations were to normalize. Valuations have normalized these past few months, during which both funds have outperformed broader equity indexes, as expected. Capital gains were low/non-existent on an absolute basis, as valuations normalizing coincided with a bear market, but that might not necessarily be the case moving forward.
Both funds sport the same PE ratio of 14.4x, while VYM’s PB ratio is quite a bit lower than that of SCHD. VYM does technically win on valuation grounds versus SCHD, but I do not consider the difference to be all that large or material to investors.
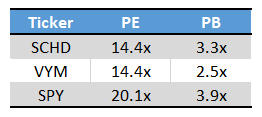
Fund Filings – Chart by Author
Backwards-Looking versus Forward-Looking Measures
SCHD’s most important benefits are all backwards-looking measures, looking at past events, performance, and the like. SCHD’s dividend growth and performance have outpaced those of VYM, in the past, but that might very well not be the case moving forward. Although I’m confident that most investors know this, I do think it is incredibly important to mention.
In general terms, although SCHD does look much better than VYM in most backwards-looking measures, the situation is much more mixed on present or forward-looking measures. SCHD yields a bit more than VYM, but the difference is not all that material. VYM sports a slightly cheaper valuation but, again, the difference is not all that material. There are differences in index methodologies, holdings, and industry exposures, but I do not have a strong opinion on their relative merits. Both funds look very similar in most forward-looking measures, and these are the most important factors when assessing a fund’s expected forward performance. As such, and in my opinion, both funds are broadly similar investment opportunities. SCHD’s stronger dividend growth and consistent performance track-record make it a slightly better investment opportunity than VYM, but the difference is small, and uncertain.
Importantly, I’ve thought and mentioned the above in the past, and to broadly positive effect. I’ve covered both SCHD and VYM several times in the past, my last article on SCHD was in April 2021, and although SCHD has performed relatively well since, the fund no longer consistently outperforms its peers. As an example, VYM has outperformed SCHD since my first article on the fund.
SCHD is still a fantastic fund, and I do think it is slightly better than VYM, but do take care when looking through and analyzing a fund’s past track-record. Future returns are what matters, and these might not necessarily be the same as past returns.
Conclusion – Both Good Funds, SCHD Slightly Stronger
SCHD and VYM are two of the largest, most well-known U.S. dividend ETFs in the market. Both are broadly similar investment opportunities, but SCHD’s stronger dividend growth and consistent performance track-record make it the slightly superior choice, in my opinion at least.
Be the first to comment